Abstract
Exon-capture studies have typically been restricted to relatively shallow phylogenetic scales due primarily to hybridization constraints. Here, we present an exon-capture system for an entire class of marine invertebrates, the Ophiuroidea, built upon a phylogenetically diverse transcriptome foundation. The system captures approximately 90% of the 1,552 exon target, across all major lineages of the quarter-billion-year-old extant crown group. Key features of our system are 1) basing the target on an alignment of orthologous genes determined from 52 transcriptomes spanning the phylogenetic diversity and trimmed to remove anything difficult to capture, map, or align; 2) use of multiple artificial representatives based on ancestral state reconstructions rather than exemplars to improve capture and mapping of the target; 3) mapping reads to a multi-reference alignment; and 4) using patterns of site polymorphism to distinguish among paralogy, polyploidy, allelic differences, and sample contamination. The resulting data give a well-resolved tree (currently standing at 417 samples, 275,352 sites, 91% data-complete) that will transform our understanding of ophiuroid evolution and biogeography.
Keywords: phylogenomics, hybrid enrichment, Echinodermata
Introduction
Next-generation sequencing is revolutionizing phylogenetics through the provision of massive amounts of sequence data (Lemmon EM and Lemmon AR 2013; McCormack et al. 2013). Many studies use transcriptomes to focus sequencing effort on a common set of phylogenetically useful markers but RNA sequencing has demanding requirements on sample quality, effectively ruling out many taxa. On the other hand, museums possess many samples suitable for DNA extraction (e.g., fixed in ethanol). To expedite the construction of tree of life phylogenies or to explore the origins and biogeography of biota from remote environments, such as the deep sea, this reservoir of material is vital.
Hybridization enrichment has emerged as a key technology for collecting targeted DNA sequences from museum specimens (Mason et al. 2011; Bi et al. 2012). Extracted DNA is fragmented, ligated with adaptors and barcodes, hybridized to probes (or “baits”) to enrich or “capture” the targeted sequences, which are then sequenced using next-generation technology (Gnirke et al. 2009; Lemmon EM and Lemmon AR 2013). The key limitation is that hybridization capture is most effective if the genetic distance between probe and target is less than approximately 12% (Hancock-Hanser et al. 2013; although see Li et al. 2013). Thus, probes have to be designed from known genetic sequences that are not expected to be too divergent from the target.
For large tree of life-scale phylogenies, this hybridization limitation raises the question of how to capture recognizably orthologous targets across a wide range of phylogenetic divergences. Various approaches have been taken to deal with this issue. One approach has been to use highly conserved sequences as “anchors” that allow capture across a wide range of taxa, relying upon variable flanking regions to provide most of the phylogenetic information (e.g., ultraconserved elements: Bejerano et al. 2004; Faircloth et al. 2012; anchored elements: Lemmon et al. 2012). An alternative approach is to directly target variable and phylogenetically informative exons (Bi et al. 2012; Hedtke et al. 2013; Mandel et al. 2014). Given the 12% hybridization constraint, however, probes for such loci would need to be designed from multiple representative taxa to ensure simultaneous capture across highly divergent lineages (Lemmon et al. 2012). Fortunately, for taxonomic groups without genomic-scale data, this diversity of probes can be designed directly from cheaper transcriptome-based phylogenetic data sets (Bi et al. 2012). Here, we embrace and extend this approach for the marine invertebrate class Ophiuroidea.
Abundant in marine benthic habitats, ophiuroids (brittlestars, basketstars) are a key group for the study of marine biogeography and macroecology (O’Hara 2007; O’Hara et al. 2011; Stöhr et al. 2012; O’Hara et al. 2014), especially of the deep sea. However, existing molecular data have been very limited in taxonomic and genetic scope, consisting predominantly of short sequences of mitochondrial (COI, 16S) and/or ribosomal (28S, 18S) DNA (Janies et al. 2011). There is no sequenced ophiuroid genome and the closest available (the sea urchin Strongylocentrotus purpuratus) diverged at least 485 Ma (Sprinkle and Guensburg 2004). Consequently, we embarked on a multistage plan to generate a tree of life for the Ophiuroidea, founded on transcriptome data of 425 protein-coding genes from 52 taxa across all major groups (O’Hara et al. 2014), followed by exon-capture developed from this transcriptome gene set. This article reports on the second stage of the process, the successful construction of an efficient exon-capture system designed to consistently capture nuclear and mitochondrial (COI) genes across an ancient and diverse taxonomic group.
Results
Probe Design
We identified exons from a 425 aligned gene data set (O’Hara et al. 2014) derived from 52 ophiuroid transcriptomes and outgroups and used the closest genome (Strongylocentrotus purpuratus) as the basis for breaking up the ophiuroid transcriptome data into putative exons. After excluding exons with insufficient sequence length (<99 bp), excessive length variation, repeat elements, or missing data, our final target consisted of 1,552 nominal exons in 418 genes spanning 285,165 sites (fig. 1 “final”). All selected exons were at least 24% different from any other sequence in the original 425 gene data set. The 1,552 exons contained 139,000 variable sites, two-thirds of which were third position. There was a mix of conserved and variable exons, with half having greater than 17% differences across the class. We also targeted the mitochondrial COI gene to help verify sample identity (by matching against available “barcodes”) and to allow incorporation of taxa with only COI data through supermatrix methods (de Queiroz and Gatesy 2007).
Fig. 1.
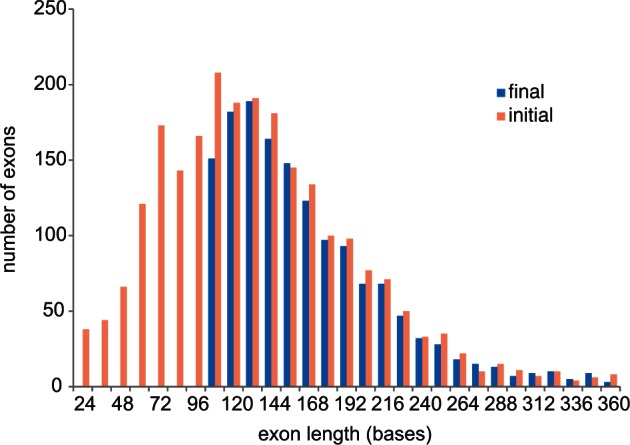
Exon size distribution of the 425 gene data set, before and after selection of the exon-capture target.
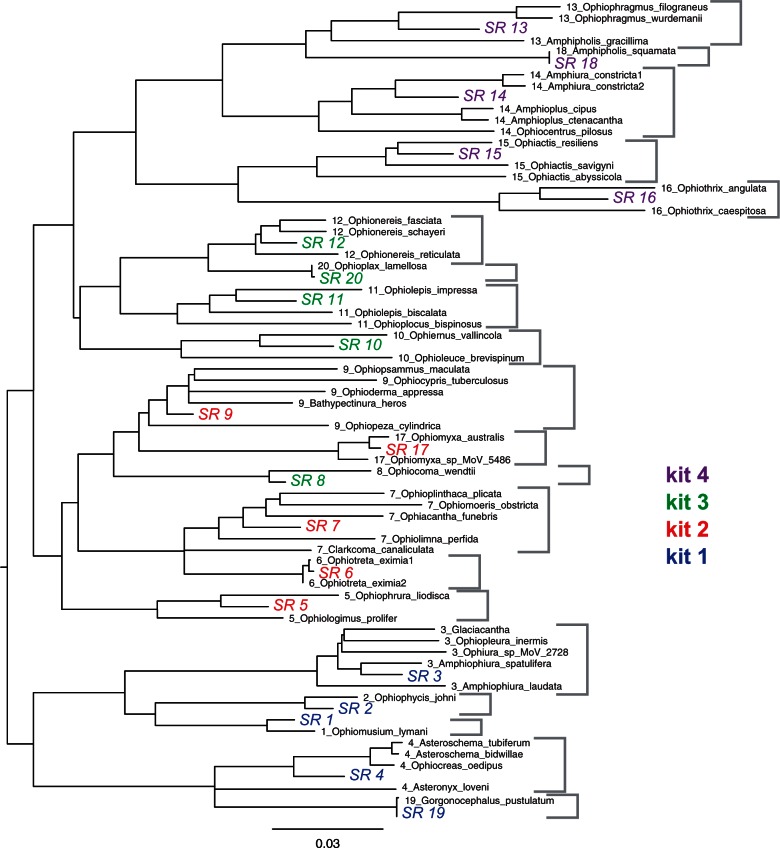
Across the Ophiuroidea most exons exceeded the reported hybridization efficacy limit of 12% genetic distance between probe and target (Hancock-Hanser et al. 2013) (fig. 2A). Therefore, we included multiple versions of each probe to span the known diversity. We adopted a phylogenetic approach by designing sets of probes for each major clade identified from our transcriptome tree (fig. 3). We further reduced potential genetic distance by designing artificial exons to represent a clade (based on the ancestral state, see Materials and Methods) rather than selecting one of the constituent species as an exemplar. We empirically determined that 20 representatives were needed to keep the majority (>80%) of probe distances to transcriptome exemplars to within 12% (figs. 2B and 3). These 20 representatives were then combined into four 20,000 MYbaits (http://www.mycroarray.com, last accessed October 16, 2015) probe kits of five each, based on the transcriptome phylogeny (fig. 3), in order to be able to flexibly match target samples to their phylogenetically nearest probe sets.
Fig. 2.
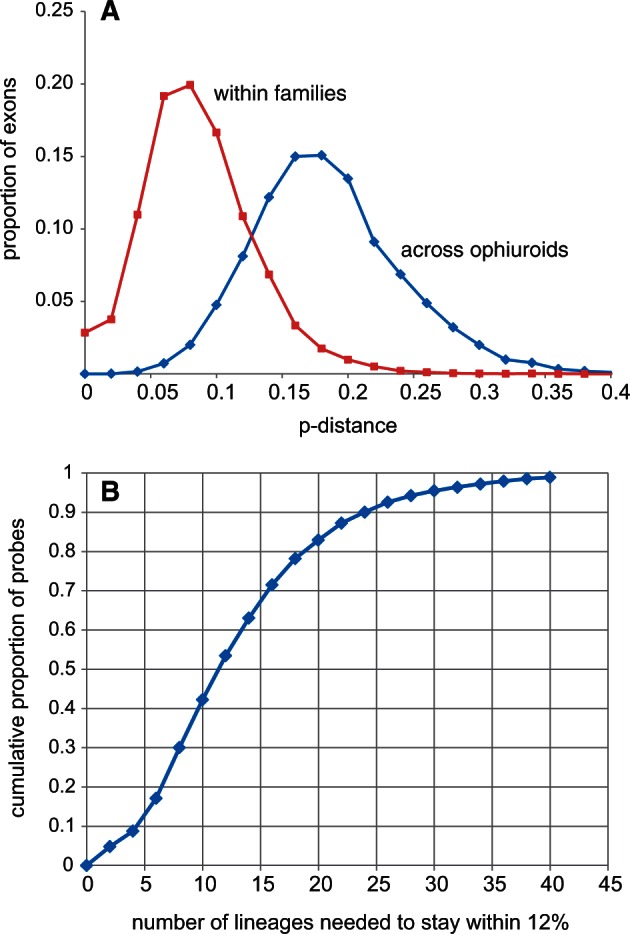
The scale of the problem. (A) Exon distances among ophiuroids. Across the class most p-distances are well over the 12% benchmark, within families most are within 12%. (B) Diversity of capture probes required. The plot shows the cumulative distribution of the proportion of hybridization probes requiring a given number of representatives to ensure that no transcriptome sequence is more than 12% different. With 20 lineages 83% of probes fall within this limit across the candidate target of 425 genes.
Fig. 3.
Simple p-distance neighbor-joining tree of the aligned 1,552 exons of the original 52 transcriptome taxa and the subsequent 20 representative sequences (labeled SR). These are color-coded by the four kits into which they were combined. Taxa contributing to a representative are indicated by the first number in the label and gray brackets to the right. Note that kit 3 contains the clade 8 representative even though it is phylogenetically closer to the kit 2 sequences. This tree is essentially the same as the full transcriptome analysis in O’Hara et al. (2014).
Sequence Recovery
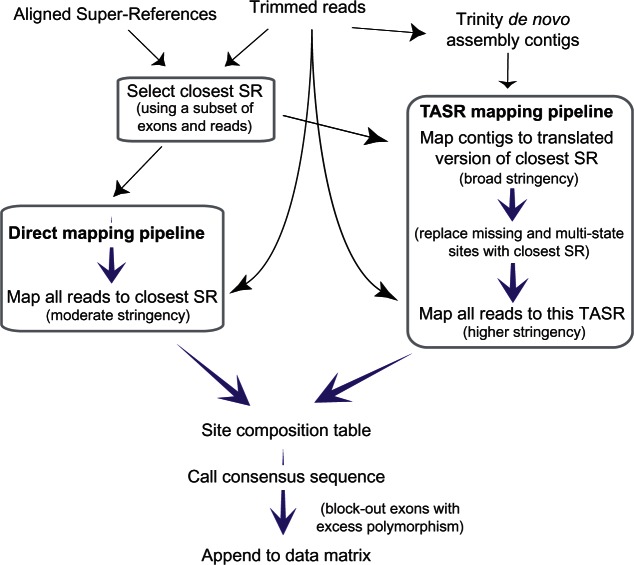
To reconstruct exons, we mapped reads using two custom pipelines to explore the issues in creating phylogenomic data sets across an entire class of marine invertebrates: 1) Direct mapping against the closest superreference (SR), and 2) mapping reads to a sample-specific reference derived by first de novo assembling the reads using Trinity (Grabherr et al. 2011), dubbed TASR mapping. These pipelines are outlined in figure 4 and described in detail in Materials and Methods. Data and scripts are available through DRYAD: http://dx.doi.org/10.5061/dryad.db339, last accessed October 16, 2015.
Fig. 4.
General schema of read mapping strategies. Black arrows indicate primary input, mauve arrows indicate processing. Boxes indicate steps using BLAT sequence alignment software.
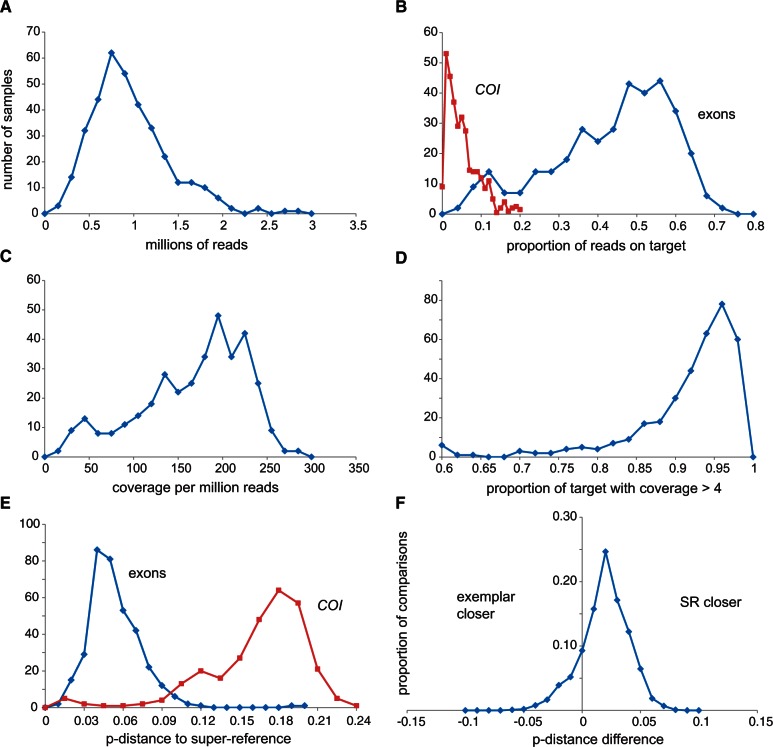
We obtained usable exon-capture data from 365 samples (table 1), with a median of 0.89 million trimmed reads per sample (fig. 5A). Direct SR mapping returned a median of 45% reads on target (fig. 5B) and coverage per million reads of 172 (fig. 5C). More importantly, the variance in coverage, among samples and among exons, was reasonably low (SD/mean < 1; figs. 5C and 6) such that the proportion of sites of the whole target (285,165 sites) with coverage greater than 4 averaged 0.93 (figs. 5D and 6). Sample target to closest SR p-distances averaged 4.5%, up to a maximum of 11.4% (fig. 5E). The sample-specific TASR mapping returned very similar overall results (table 1) but with slightly less polymorphism (0.0065 vs. 0.0073) and slightly higher distance to the closest SR (0.050 vs. 0.045). Across the core test sample set, 95% of exons had at least three-quarters of sites with coverage greater than 4 but 37 exons (2% of the target sites) were never recovered irrespective of distance to the SR or overall number of reads on target. The common factor here appears not to be variability but that almost all had sections of at least one of the 20 references excluded by the MYbaits screening algorithm, indicating that they were problematic to begin with, typically containing quasi-repetitive motifs.
Table 1.
Summary of Exon-Capture Performance by Kit and Mapping Pipeline.
| Kit | n | Reads | p-RoT | Coverage | cov/Mr | p-cov | p-cov>4 | pm |
|---|---|---|---|---|---|---|---|---|
| 1 | 109 | 0.74 | 0.41 | 117 | 155 | 0.900 | 0.865 | 0.0071 |
| 2 | 100 | 0.86 | 0.42 | 139 | 160 | 0.949 | 0.911 | 0.0065 |
| 3 | 95 | 0.99 | 0.39 | 153 | 150 | 0.917 | 0.870 | 0.0100 |
| 4 | 61 | 0.99 | 0.46 | 174 | 171 | 0.927 | 0.891 | 0.0118 |
| Wildlife | 32 | 1.09 | 0.36 | 159 | 136 | 0.930 | 0.893 | 0.0084 |
| TASR | 365 | 0.89 | 0.44 | 145 | 159 | 0.928 | 0.910 | 0.0065 |
Note.—Rows include four single kits and the “wildlife” all-four-kits-in-one using direct SR mapping; and all samples using the TASR assembly-based mapping. Columns include number of samples, reads in millions, proportion of reads on target (p-RoT), average coverage, average coverage per million reads (cov/Mr), proportion of target hit (p-cov), proportion of target with coverage >4 (p-cov >4), and proportion of sites that were polymorphic (pm).
Fig. 5.
Summary of exon-capture and direct SR mapping performance. The plots show the number of samples (y-axes) for five key statistics (A)–(E) (x-axes). Blue and red refer to exons and COI (B and E), respectively. The sixth plot (F) shows proportion of comparisons (y-axis) against the difference in p-distance between sample and SR and sample and transcriptome exemplar, for clades with more than one exemplar (see fig. 3). Assembly-based mapping results appear similar.
Fig. 6.
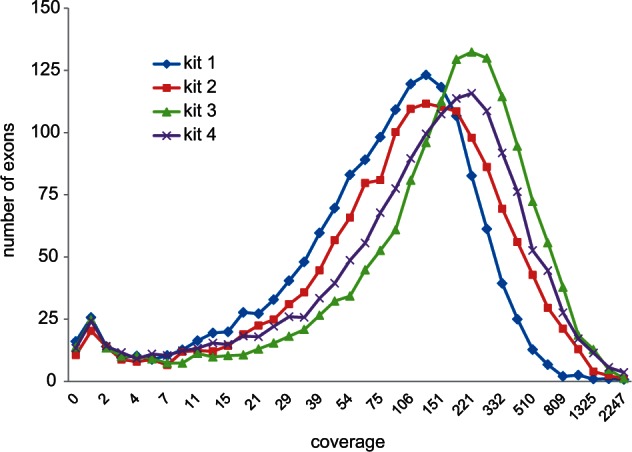
Exon coverage distributions across a 44-sample test set. The four kits are color-coded as per figure 3.
To assess the value of designing probes to reconstructed ancestral states, we compared genetic distances between the final mapped consensus and 1) the closest SR, and 2) the original transcriptome sequences from the corresponding clade (see fig. 3). Overall, for 79% of comparisons, the 20 SRs were closer than the individual transcriptomes (fig. 5F). These SRs effectively trade increased distances to close samples for reduced distances to divergent samples, and in addition, provide a method of filling sequence that was missing from the transcriptome exemplars. Thus creating artificial exon sequences directly helped mapping, and by inference probably helped capture.
There was a strong relationship between distance to the closest SR and proportion of target recovered that fits a quadratic polynominal function (fig. 7; R2 >0.8), such that beyond a certain distance the proportion of target recovered with adequate coverage rapidly declines. There are two primary reasons for this loss of target: 1) Failure to capture the sequence in the first place due to probe mismatch and 2) the captured sequence is too distant from the reference to directly map. In this extensive set of samples, only a handful appeared to fall near or beyond these critical limits. We investigated these aspects using the assembly-based TASR mapping, where loss of target should more represent probe capture limitation alone. This returned a shallower target recovery function (fig. 7 blue line) with substantial gains of 10–20% for the most divergent samples, especially within the more variable exons (correlation between gain in coverage and exon variability = 0.29), resulting in a yet greater gain in information and hence the slightly higher distances to the closest SR. Nevertheless, target recovery for these outlying samples was still well below the overall average of approximately 90%.
Fig. 7.
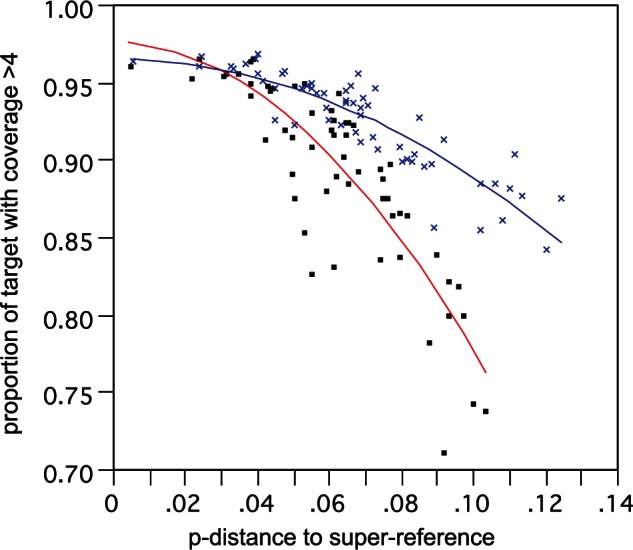
Correlation of proportion of target recovered versus distance from SR. Analysis based on a test subset of 59 samples. Lines show two-degree polynomial best fit for direct SR mapping (red line, black squares) and assembly-based TASR mapping (blue line, blue crosses).
All Probes Combined “Wildlife” Capture
The bulk of the samples were successfully recovered using one of the four probe kits; however, not all taxa can be assigned a priori to a kit, or may be divergent from all kits. Therefore we tested exon-capture using all four kits combined (dubbed “wildlife kit” captures), on a subset of samples previously hybridized with a single kit. Results were essentially as good as the single-kit captures (table 1), with the ratio of wildlife/single kit for target recovered averaging 1.00 and none less than 0.86, indicating that high probe diversity and concentration are no impediment. More importantly, one highly divergent sample (Ophiomyces delata BP34), that was poorly recovered by a single-kit capture, returned a much greater proportion of reads on target and three times the target recovered (from 0.22 to 0.65) in a wildlife capture.
Polymorphism, Paralogy and Exon Boundaries
Overall, there was on average 0.7% of sites with two base states (table 1) but few sites with more than two states (average 6, maximum 73, out of 285,165 sites). The distribution of the putatively heterozygote sites among exons was largely in keeping with coalescent exponential expectations of allelic divergence (fig. 8), with the more stringent TASR mapping returning lower polymorphism and a better fit. Nevertheless, 20 exons consistently showed an excess of polymorphic sites across the test sample set, indicative of being confounded by closely related paralogs.
Fig. 8.
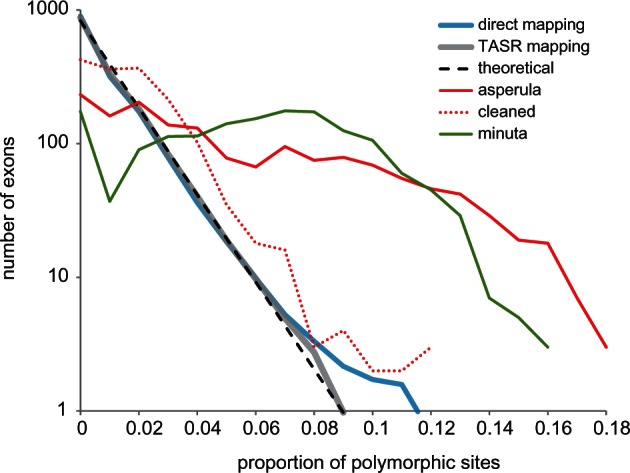
Distribution of exon polymorphism. The thick lines show average distribution of proportion of polymorphic sites per exon across a 44-sample test set: Blue direct SR mapping, gray assembly-based TASR mapping. The dashed line shows a log-linear coalescent expectation. The red lines show Ophiactis asperula F167536 before and after filtering of contaminating reads. The putative polyploid/hybrid Amphistigma minuta F173962 is shown in green.
In addition to unexpected paralogs, two other problems caused elevated polymorphism: Cross-contamination and genuinely divergent alleles (fig. 8). One example is Ophiactis asperula that was (inadvertently) badly contaminated with a divergent species (Ophiothrix spongicola, identified by Trinity assembled COI contigs) resulting in 6% polymorphic sites, spread across most exons. Filtering the reads of the offending contaminant cleaned this particular sample enough to be used in phylogenetic inference (fig. 8) but we were forced to discard several other contaminated samples that could not be adequately filtered. The second example, Amphistigma minuta, contained only one COI contig but had at least 90% of exons with approximately 7% polymorphic sites. Phylogenetic assessment of Trinity contigs of six example exons from this sample showed in each case two or three distinct variants belonging to the same lineage in the Amphiuridae (SR 18; fig. 3), accounting for the high rates of polymorphism. Possibly this species is a polyploid, hybrid, and/or asexual organism.
The exon boundaries in our SR set were based on the half-billion year distant Strongylocentrotus genome but approximately 80% conservation with the sister phylum Saccoglossus suggested that ophiuroids would be quite similar. Nevertheless, analysis of read mapping coordinates in 44 test samples indicated that there were at least 63 substantial differences to our a priori boundaries shared across all major ophiuroid lineages. In at least 20 instances adjacent exons were actually contiguous, that is, introns were absent. Given the large phylogenetic scale there could also be some boundary differences among ophiuroid lineages. This remains to be fully assessed but in the test samples 50 exons showed boundary differences among the five major ophiuroid lineages.
Mitochondrial COI Gene
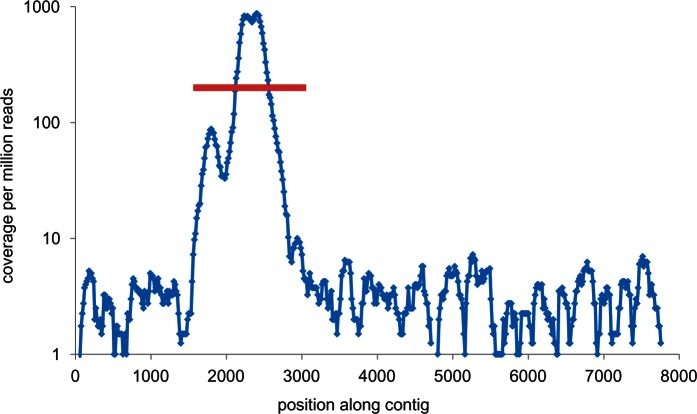
Due to much higher divergence levels (median 0.17, max 0.25, fig. 5E), the COI exon-capture sequences were always obtained directly from Trinity assembled contigs rather than read mapping. Empirically, recovery of the COI gene was quite variable (fig. 5B), and in some cases (n = 9) failed entirely, but on average accounted for 5% of all reads, resulting in a high median coverage of 3,000. Despite this high coverage, COI appears to have had little effect on exon-capture (correlation coefficient between relative abundance of COI reads and nuclear exon coverage = −0.043, P = 0.43). Recovery of highly divergent samples (i.e., exceeding the purported 12% hybridization limit) is driven by enrichment of on-target COI versus off-target flanking mtDNA sequences (fig. 9), amplified by the greater natural abundance of mitochondrial DNA (estimated from unpublished ophiuroid partial-genomic data at ≥100-times that of nuclear loci). Without probes mtDNA was not reliably recovered; neither were nuclear ribosomal RNA genes.
Fig. 9.
Mitochondrial COI gene capture. Coverage along a long Trinity-assembled mtDNA contig containing the targeted COI gene (red line).This test sample (Ophiotreta valenciennesi UF8999) had 4.4 million reads and the COI gene was 17% different to the closest reference.
Limits of Precision
An important criterion in exon-capture is accuracy: How close is the mapped sequence to the true genotype? We do not have a known genotype but gauged consistency by comparing replicated captures, using the two mapping pipelines. For this, we used 16 phylogenetically diverse samples captured twice: Once with a single kit and again with the wildlife kit. These comparisons excluded previously identified null and paralogous exons. Across all comparisons the number of fixed site differences was low. For direct SR mapping, replicate captures gave near-identical results (average four fixed differences) reflecting the deterministic mapping process (Kent 2002). For sample-specific TASR mapping, replicate captures showed higher differences (0.00014 or ∼50 fixed differences), perhaps reflecting the more complex assembly-based process (Grabherr et al. 2011). Between mapping pipelines for the same capture, fixed differences averaged 0.00026. These measures of inconsistency or “error rate” amount to Phred scores of at least 36, higher than typical read sequence quality cutoffs and better than Sanger sequencing. About 11% of differences were associated with exon boundary and indel sites, which only make up 3.5% of all sites, suggesting that they have higher mapping error (Homer et al. 2009; Bi et al. 2012).
Phylogenetic Analysis
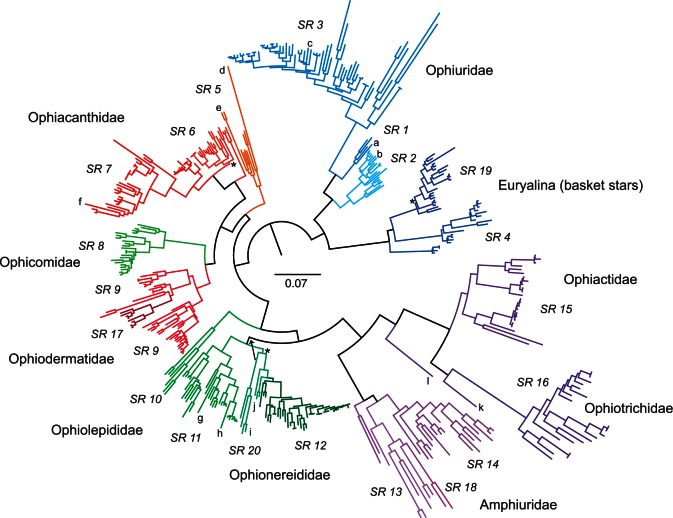
Approximately 3% of our target was not captured and a further approximately 2% was confounded by paralogy. Exclusion of these exons gave a 91% (range 41–98%) character-complete data matrix of 275,352 sites by 417 tips (including the original 52 transcriptomes) and covering 380 species in 121 genera of ophiuroids. Phylogenetic analysis, generated from a RAxML analysis of 200 GTR (general time reversible)-CAT fast bootstrap (BS) trees followed by a full GTR-GAMMA ML search (fig. 10), resulted in a highly resolved tree, with 90% of nodes having 100% BS support, including nearly all major lineages. The subtree of the 52 transcriptome species was topologically identical to the original transcriptome tree in O’Hara et al. (2014). Excluding exon boundary and indel codons (11% of sites) made negligible difference (topology differed for only three minor nodes with <60 BS support). The trees generated from the two mapping pipeline data sets had 15 differences, mostly nonsignificant intraspecific tips. The exception was the position of the divergent genus Ophiopsila which did differ by one major node (with 100% BS) in the direct mapping data tree (fig. 10 Ophionereididae, SR20 group, indicated by the arrow). This RAxML analysis of the 120 megabytes 417 tip data matrix took 2,436 CPU hours. Consequently, we experimented with an alternative analysis that generated a consensus topology from 200 GTR-CAT fast BS trees, with the GTR-GAMMA ML only used to estimate branch-lengths of this topology. This process took 550 CPU hours and returned an identical tree—same topology, support, and branch-lengths as the full search but taking considerably less CPU time.
Fig. 10.
An ophiuroid exon-capture phylogeny. The tree is a RAxML codon-position GTR-CAT fast BS consensus with ML branch lengths, for 417 samples (380 species) from 275,352 sites in 1,490 exons, rooted according to O’Hara et al. (2014). Centre bar indicates divergence scale; taxon names have been omitted for simplicity; lineages are color-coded and labelled by mapping SR, and some large family groups indicated. The three higher-level nodes with BS support less than 95% are marked by asterisk; major difference between mapping pipelines in placement of the SR20 lineage is indicated by arrow. Genera mentioned in the text are denoted as follows: a, Astrophiura; b, Ophiomusium; c, Ophiosparte; d, Ophiomyces; e, Ophioscolex; f, Ophiocanops; g, Hemieuryale; h, Astrogymnotes; i, Ophiopsila; j, Amphilimna; k, Ophiopholis; l, Ophiothamnus.
Discussion
In this article we demonstrate what is required to reliably capture exons across a broad taxonomic group. Compared with anchored methods our exon approach requires more primary references but the advent of transcriptomics now makes this relatively cost-effective. It also requires substantially more probes per target although this can be reduced by designing them from ancestral character states rather than extant exemplars. An advantage is that these exons are known loci: Most of the genes in our target could be identified by reference to the well-annotated sea-urchin and zebra-fish genomes, thereby enabling analysis and interpretation. The result is a system that reliably sequenced 275 kb of approximately 1,500 orthologous exons from hundreds of species across an entire class of marine invertebrates, the Ophiuroidea, spanning a quarter-billion years.
Multiple Lineage Capture System
Compared with most hybridization enrichment phylogenetic studies published to date, our system has both a large phylogenetic scale and a high target recovery (e.g., Bi et al. 2012; Faircloth et al. 2012; Lemmon et al. 2012; Hedtke et al. 2013; Leaché et al. 2014; Mandel et al. 2014; Faircloth et al. 2015). The major factors contributing to this consistent recovery are 1) use of multiple references based on a thorough transcriptome phylogeny of the class (O’Hara, Hugall, et al. 2014), 2) excluding exons and parts of exons that would be difficult to capture or map or align, 3) designing our probes and references from ancestral-state-derived sequences, and 4) mapping pipelines designed to maximize the recovery of captured exons. Use of long 120-base RNA in-solution hybridization probes may have also helped (Faircloth et al. 2012). The final target size of 285 kb in 1,552 exons is limited to transcripts commonly expressed across the Ophiuroidea and filtered to a tractable target. The benefit of this a priori trimming of the target, in combination with multiple phylogenetically diverse references, means that the final output is dense in information with a high proportion of useable exons and variable sites.
Having an a priori good measure of the phylogenetic diversity of the target allowed us to create multiple artificial consensus representative sequences for probe design and for mapping references. Our procedure for creating these was somewhat ad hoc, and doubtless could be refined, but the key point is that the concept appears valid, narrowing the range of distances to novel samples to improve capture and mapping. We combined a 12% rule of thumb, measures of diversity across the class and MYbaits technical requirements, to estimate that 20 representatives would be sufficient to capture class-wide phylogenetic divergence. Our target recovery (figs. 4 and 6) indicated that this level of replication was quite adequate for exon-capture, with only a handful of samples too divergent to capture and map fully (e.g., the distribution tails in figs. 5D, 5E, and 7). Although we cannot calculate exactly how much the artificial representative sequences actually helped in target recovery, applying the TASR coverage versus distance function (fig. 7 blue line) to the distances between sample and reference underlying figure 4F, would imply up to 40% more missing data using single-species exemplars instead of the artificial SR. Given appropriate transcriptome diversity, the approach used here of mixing multiple representatives of clade-based consensus exon probes should be applicable to any metazoan group.
Wildlife Kit
There appears to be little biochemical impediment to combining multiple homologous probes into the one bait kit. For the majority of samples, we used probe kits containing five related lineages. However, we also combined probes from all 20 lineages to create a wildlife kit potentially capable of hybridizing to any ophiuroid species. Although we only tested this on a small number of samples, the results were encouraging, with little evidence of loss in the proportion of exons recovered using the wildlife versus single bait kit. Moreover, in several cases it actually improved recovery, especially in the highly divergent O. deleta, where target recovery rose from <30% to >60%.
Multiple Lineage Mapping System
The next key issue is how to faithfully reconstruct clean homologous informative sequences from divergent exon-capture data. Although multi-transcriptome phylogenetic analysis aided in the a priori exclusion of some problematic loci (e.g., confounding paralogs), not all such loci are necessarily accounted for, such as infrequently expressed genes and in particular pseudogenes. Neither do transcriptomes provide information on exon boundaries. Across any substantial phylogenetic diversity there are likely to be lineage-specific paralogs and exon boundary shifts (Lynch 2002; Zhang 2003; Parmley et al. 2007; Roy 2009). Therefore, some post hoc filtering is necessary. The problem with lineage-specific paralogs is that, unless they lie outside the reference clade, they cannot readily be distinguished from the true ortholog by match similarity to the reference: They will in effect appear as equidistant competing copies. Sample cross-contamination, a constant danger in any laboratory work, can pose a similar difficulty. Therefore, it is important to have a mapping system that identifies problematic exons and samples (Lemmon EM and Lemmon AR 2013; Mandel et al. 2014).
Hence, we developed a read mapping system that has a number of features facilitating tree of life-scale phylogenetic analyses. Because reads are clipped to match length, mapping is resilient to unknown target exon boundaries. It also means that sequence alignment can be built into the read mapping through the pre-aligned set of 20 SRs, allowing new samples immediately to be appended to existing data sets. The direct SR mapping is fast and consistent, at the expense of loss of data in divergent samples. The TASR mapping is more complex and slightly less consistent but recovers more target from divergent samples. It has less interference from close paralogs and (relatively abundant) contaminants due to the tighter mapping criteria (7% vs. 14%). The key point is that, in both methods, the fairly relaxed read mapping makes a virtue of necessity by flagging problematic exons and samples through the pattern of elevated polymorphic sites, which can then be used to diagnose potentially paralogous exons and contaminated samples (fig. 8). This also has the advantage of highlighting taxa that may truly have complex divergent allele patterns (e.g., hybrids, polyploids). For phylogenetic analysis, after excluding certain exons (and samples) entirely, coding remaining polymorphic sites as ambiguous is a reasonably conservative approach.
Both of our mapping systems probably have some inconsistency in mapping around indels (Homer et al. 2009). However as we eliminated most of these regions in the target a priori, the remainder comprises a tiny fraction of sites, and it is more efficient to exclude them in subsequent analyses than to try improving their alignment; similarly for sites immediately adjacent to exon boundaries.
Altogether, these pipeline attributes are desirable for tree-of-life scale phylogenomic data sets, where trying to account for sample-specific indels, exon boundaries and confounding paralogs in thousands of loci for hundreds of taxa across multiple divergent lineages would be costly for little gain. Retaining a stable reference sequence length and alignment throughout the pipeline greatly simplifies incremental addition of new taxa to existing data sets.
Refinement and Precision
With information on many lineages, we are now in a position to refine the target, revise exon boundaries, and possibly expand the set of SRs through phylogenetic ancestral state inference. For the phylogeny presented here, we have only excluded ophiuroid-wide null and paralogous exons but this process can be extended further to a more detailed taxon-by-exon filtering of unreliable exons (e.g., Mandel et al. 2014). For example, a pattern of high polymorphism (in both the mapped contig TASR and the final consensus sequence) can be used to eliminate exons confounded by paralogy. Applying this approach to the test sample set using a cutoff of 0.04 polymorphic sites excludes 1.2% of the data, largely comprised the same 20 exons previously identified. High polymorphism can also flag samples affected by ingroup contamination but this is a sample-wide problem, as opposed to paralogy, which is an exon problem.
Our system is primarily focused on large tree of life-scale phylogenetics, especially of groups with little genomic and phylogenetic information. However, the exon set appears to contain useful information (e.g., there are typically 1,500 heterozygous sites per individual) suitable for multilocus species-tree and population genetic inference (Knowles 2009). For these purposes, data would be remapped with appropriately tighter stringencies and coverage limits, along with separating alleles and including genotype quality likelihood metrics (e.g., Altmann et al. 2012).
Mitochondrial COI
We included the mitochondrial COI gene in our probe design to help verify the sample identity against “barcode” data sets, identify contaminants, and facilitate the future incorporation of legacy COI sequences from other species into our phylogeny. Although off-target reads will contain some mtDNA, the probes were essential in recovery of the COI (fig. 9), typically with coverage far in excess of what is needed but with little apparent decrement to exon-capture. The recovery and enrichment of divergent COI sequences (figs. 5E and 9) suggest that probes can have utility well beyond the reported 12% hybridization limit. The major concern for COI is the sheer diversity of sequences that are recovered, indicating all manner of minor cross-contamination as well as the expected mis-indexing. This requires a significant amount of effort to interpret. As the best matching or highest coverage contigs were not always the correct one, all candidate contigs needed to be included in phylogenetic assessments of orthology. Furthermore, the Trinity software occasionally did generate chimeric sequences from mixtures of divergent samples (see also Grabherr et al. 2011). Despite these complications, our experience has been that having a tool to validate sample identity is highly desirable.
Ophiuroid Phylogeny
Generation of phylogenetic trees from massive genetic data sets is problematic. Although recent methods are remarkably efficient (Aberer et al. 2014; Stamatakis 2014), genomic-scale tree of life phylogenies still requires vast amounts of CPU time. On the other hand, such large data sets should be very powerful and contain a great deal of information on sequence evolution patterns. Therefore they ought to be well-suited to the very efficient GTR-CAT approximation, allowing a great reduction in CPU time for very little loss of inference (Stamatakis 2014). For our data set, the fast approximation returned the same tree as the full search. Among the data sets, most of our tree discrepancies involved tip intraspecific complexes, which are better analyzed in a multilocus coalescent framework (Knowles 2009). But for very large phylogenetic analyses, a concatenated approach is sensible. The tree presented in figure 10 contains 417 tips covering 380 species in 121 genera across all currently named ophiuroid families with full support for 90% of nodes, and would be one of the most powerful of any metazoan class published to date. It is fully consistent with the transcriptome tree but not congruent with the current classification of the Ophiuroidea (O’Hara et al. 2014) nor with any previous published hypotheses of superfamily groups. Hence the results make possible a whole-scale taxonomic revision of the entire class, involving detailed interrogation of phylogenetic hypotheses and mapping of morphological characters. Such a task is beyond the scope of the work presented here but below we draw attention to several major aspects.
Many existing families and genera are polyphyletic (Ophiolepididae, Ophiomyxidae, Ophiocomidae) or paraphyletic (Ophiacanthidae, Ophiodermatidae, Ophiactidae). Thus many characters that have been used to define higher-level taxa are evidently homoplasic, including the reduction of the external skeleton, the form of the arm vertebrae, and the position of oral papillae and tentacle pores on the jaws. Only microscopic characters of the lateral arm plates, most notably the form of the articulation with the arm spines, appear to be reliably diagnostic for family-level clades (Martynov 2010; Thuy and Stöhr 2011; O’Hara et al. 2014).
Our phylogeny also resolves the position of many controversial taxa, both ancient and young, emphasizing the power of a thousand exons. The relationships of the aberrant genus Ophiocanops have been debated since its first discovery, often being classified as a stem relic in its own family (e.g., Mortensen 1932; Fell 1963; Smith et al. 1995; Stöhr et al. 2008). But here we reveal it to be an ophiacanthid related to Ophiomoeris. The pentagonal Astrophiura, originally considered close to the sea-stars (Sladen 1879), is actually related to Ophiomisidium and Ophiophycis, within the greater Ophiuridae sensu stricto. The large Antarctic carnivore Ophiosparte gigas, previously classified as an ophiacanthid or ophiomyxid, falls well within the Ophiuridae sensu stricto. Hemieuryale, type genus of the family Hemieuryalidae, is merely a derived Ophiolepididae, a relationship completely at odds with its traditional taxonomic placement which emphasized the form of the arm vertebrae. Surprisingly, Astrogymnotes formerly considered an ophiomyxid is also a derived member of the Ophiolepididae. On the other hand, Ophioscolex, Ophiopsila, Amphilimna, Ophiopholis, and Ophiothamnus each form the basis of divergent lineages that appear to be deserving of family-level status. A detailed systematic analysis is in preparation.
The data generated through emerging next-generation technologies will not only resolve contentious phylogenetic problems but also provide a solid basis for evolutionary, biogeographic and conservation studies. Marine invertebrate taxonomies to date have been too uncertain or unresolved to be useful in such analyses. O’Hara et al. (2014) and this study provide clear evidence that historical qualitative taxonomic diagnoses can be a poor guide to phylogenetic relationships. Large phylogenomic data sets combined with recently assembled global distributional data (e.g., OBIS 2014) will be a powerful tool to explore the origin and distribution of marine life.
Materials and Methods
Target Selection
We selected exons from the 425 nuclear gene alignment described in O’Hara et al. (2014), which was assembled from 52 ophiuroid transcriptomes, 6 outgroup transcriptomes, and 3 reference genomes (the fish Danio rerio, hemichordate Saccoglossus kowalevskii, and echinoid Strongylocentrotus purpuratus). We also included the mitochondrial COI gene (also derived from the transcriptomes). We estimated exon boundaries in each of the reference genomes by mapping corresponding proteomes against the genomes using the program BLAT (Kent 2002). For simplicity all boundaries were made to be in-frame. Within these 425 genes, 83% of exon boundaries were conserved (within four codons) between Strongylocentrotus and Saccoglossus and 75% between Strongylocentrotus and Danio; consequently, we used the closest genome (Strongylocentrotus) as the basis for breaking up the ophiuroid transcriptome data into putative exons. After removing all outgroups, the starting alignment for selecting exon-capture targets comprised 425 genes with 2,544 nominal exons spanning 427,832 sites (142,611 codons; fig. 1 “initial”). Of these 2,544 exons, we excluded 1,036 because they were too short (<99 bp), had excessive length variation or repeat elements, or were missing from several of the major ophiuroid clades of our transcriptome phylogeny (O’Hara et al. 2014). Some exons were trimmed in length and some (44) were split, to avoid complex regions. This left a final target of 1,552 nominal exons in 418 genes spanning 285,165 sites (fig. 1 “final”).
Accommodating Phylogenetic Diversity
We investigated two approaches to constructing artificial representatives from selected clades in our transcriptome data. For each base along an exon we 1) selected the most frequent nucleotide within the clade, and 2) derived an ancestral state using accelerated transformation as implemented in PAUP 4b10 (Swofford 2003). Both approaches are intended to reduce the distance (as a proxy for hybridization efficiency) between the representative and most members of a clade. The frequency method will push the representative toward the most speciose lineage in the clade, whereas the ancestral approach will push the representative toward basal lineages. The best option then depends on the sampling of clade diversity. Consequently, we implemented a mixed solution, constructing the final representative exons by randomly selecting bases from both the frequency and ancestral models. Finally, we substituted the phylogenetically closest sequence for any missing data.
We selected the MYbaits (http://www.mycroarray.com) sequence capture system because they offered custom-built kits of long 120-base probes for relatively small targets (minimum 20,000 probes). We determined how many clade representatives were needed to keep probe distances to all the members of that clade within 12% (figs. 2B and 3). With 20 representatives, based on one to five transcriptomes each, 83% of 120-base probes remain within 12% distance to any transcriptome. These 20 representatives were then split into four sets of five representatives each, based on the transcriptome phylogeny (fig. 3). The major ophiuroid clades derived from our transcriptome data were uneven in terms of their putative species richness and genetic diversity. Consequently one kit contained a probe set from a distant lineage (kit 3, fig. 3). We retained duplicate sequences from different clades (e.g., for conserved or substituted exons) and further duplicated small exons (99–120 bases, that could not be tiled) to reduce variation in probe concentration across the target sequences. Based on these 1,552 target exon sets, four 20,000 probe kits were designed and synthesized by MYcroarray using 2× tiling.
Sample Selection and Laboratory Procedures
DNA was extracted using Qiagen DNeasy Blood & Tissue kits from a diverse range of shallow and deep-water ophiuroid species collected since the year 1999 and fixed/preserved in ethanol (70–95%). We selected several hundred reasonable quality DNA extractions (based on agarose gels), with similar numbers putatively assigned to each of the four probe kits. The extractions were dried on 96-well DNAStable plates (Biomatrica).
Dried DNA extractions were rehydrated in Tris-ethylenediaminetetraacetic acid, quantified using a 96-well fluorometer and Sybr Green I (Life Technologies) and, where possible, normalized to 15 ng/µl. DNA was sheared by Covaris S2 then transferred to 96-well plates and processed using the Kapa Biosystems DNA Library Preparation Kit. After library preparation using a truncated common Illumina Y-adapter stub, a standard dual-indexed sequencing adapter for Illumina sequencing was added using a unique combination of indexed i7 and i5 polymerase chain reaction (PCR) primers for each library in the 96-well plate. After six cycles of PCR, the amplification was checked by agarose gel electrophoresis and low concentration samples subjected to additional amplification. Libraries were purified and the concentration determined by fluorometry. The final amount of library varied substantially due to sample quality but where possible up to 200 ng of each library was combined into pools of eight individuals for sequence capture.
The pooled libraries were concentrated to a volume of 30 µl using Qiaquick PCR Purification columns and then further concentrated to 3.4 µl using a centrifugal vacuum concentrator. MyBait probes were diluted with water and used according to the manufacturer’s protocol version 2.2 with the optional high-stringency wash conditions. In general we used a one-quarter dilution of a MYbaits kit per capture. We also trialed mixing all four kits together (creating a wildlife kit), again at one-quarter dilution. Briefly, heat denatured concentrated library pools were combined with probes, standard MYcroarray blocking reagents, and hybridized for 40 h at 65 °C. Hybridized probes were captured using Dynabeads MyOne Streptavidin C1 beads, washed three times at 65 °C with a 1:5 dilution of MYcroarray Wash Buffer 2 and the beads resuspended in 30 µl of water. Ten microliters of beads were then used in a 50 µl PCR reaction with 25 µl 2× Kapa HiFi HotStart ReadyMix and 0.3 µM each of the Illumina PCR amplification primers. Amplifications were checked by agarose gel electrophoresis after 12 cycles then cycled for an additional 4 or 5 cycles. After purification, the capture pools were resuspended in 15 µl EB (Qiagen), quantified by Qubit fluorometry and the size distribution checked with the NGS Fragment Analysis Kit on a Fragment Analyzer (Advanced Analytical). Typically, six captured library pools were combined in equimolar amounts (amounting to ≥48 individual sample libraries) and sequenced on an Illumina MiSeq using Reagent Kit v2 running 300 cycles with dual-indexed paired-end 150 cycle settings.
Mapping Pipelines
Figure 4 outlines the key elements of our read mapping pipelines. Illumina adapters and low-quality read regions were removed using Trimmomatic-0.22 (minimum quality score 25 per 4-base window) (Lohse et al. 2012). Duplication levels (estimated by FASTQC and a custom script) were on average 17% and all reads were used. All mapping was conducted using BLAT (Kent 2002) built into custom UNIX shell scripts to interpret the psl format output. The basis of our reference system is an alignment of the 20 representative sequences used to design the hybridization probes. These 20 super-references (SRs) are aligned sets of the 1,552 exons incorporating 340 separate indels spanning a total of 1,089 sites (333 codons), keeping all exon boundaries and indels in-frame. The basic pipeline comprises three parts: 1) Identify the SR closest to the sample, 2) map all reads to this SR either directly or through a species-specific reference (TASR) generated from assembled contigs, 3) summarize the output as a site by character state table (for five states: A, C, G, T, other) and then infer a final consensus sequence based on a set of rules.
Selecting an SR
A subset of 50,000 reads were mapped onto a subset of 50 variable exons (3.5% of sites) for all 20 SRs, the closest SR being the one matching the most reads. BLAT mapping was done with default twin 11-base tile match initiation, minimum match and block size filters, and a minimum identity of 0.86.
Direct Mapping
All reads were then mapped directly against the selected SR using BLAT with parameters as above.
TASR Mapping
All sample read sets were first assembled using Trinity (Grabherr et al. 2011, default settings). These contigs were then mapped using BLAT (at the translated amino acid level with minimum identity 0.86) to the closest SR to generate a consensus nucleotide sequence forming a species-specific SR. This potentially allows detection of genes that were captured by the hybridization probes but are too divergent to effectively map directly. Sites with more than one state due to competing contigs were marked as polymorphic. A final composite TASR was then derived by replacing missing and polymorphic sites with the corresponding positions in the closest SR, to give a fully defined complete TASR of exactly the same length and alignment as the original SR set. Reads were then mapped to this TASR using BLAT as described above but with a more stringent 0.93 minimum identity.
Assembly-based references frequently generate competing contigs (Bi et al. 2012; Lemmon et al. 2012; Mandel et al. 2014; Tilston-Smith et al. 2014) where the best similarity score match may not always select the true ortholog. Hence we took a different approach, of collecting all candidate contigs and then resolving sites in favor of the closest SR, which has a number of attributes. It effectively excludes divergent (out-) paralogs and contaminants from mapping while avoiding choosing the wrong contig or discarding exons unnecessarily. Mapping multiple contigs also allows us to gather nonoverlapping exon fragments due to gaps in coverage or unexpected exon boundaries.
Consensus Calling
For both pipelines, a consensus sequence was then generated from the mapped reads. Sites with no coverage were coded as “-”, coverage 1-4 coded as “n”, and above this limit a site state was included if abundance was greater than 20%. Two-state sites (nominally heterozygous) were IUPAC-coded, more than two coded as “X”. A minimum coverage of 5 for exons was chosen to exclude mis-indexing and other very low coverage contaminants from affecting base-calling, although a higher limit could be used if heterozygote status was critical (Altmann et al. 2012).
Both pipelines take advantage of BLAT accepting reference gap sites and clipping reads to match length. Thus, because novel insertions are excluded and all the exons in the 20 SRs are prealigned, the output sequences are aligned as they are mapped, and can be added to pre-existing data sets without any further processing.
Post Hoc Processing
Finally we tracked polymorphism levels in the final sequence (and the mapped contig consensus of the TASR pipeline) to detect exons confounded by closely related paralogs, such as pseudogenes. The observed polymorphism was compared with coalescent expectations among independent loci and samples (Hudson 1991). Exons with excessive polymorphism were excluded from final sequence data sets. This procedure was also used in conjunction with COI sequences to identify contaminated samples. Detailed assessment of individual exons for coverage, changes in exon boundaries, and patterns of polymorphic sites used a subset of samples spanning ophiuroid phylogenetic diversity and distance from SR. To provide a consistent measure of genetic distance between sample and reference, we used a subset of 34 exons spanning 24 kb that were reliably recovered and approximated distances estimated from the whole target.
Exon Boundaries
As our target is a modified version of the original genes with sections deleted, only a proportion of our exon boundaries are directly comparable with those of Strongylocentrotus. Within this scope, changes in exon target boundaries were measured by assessing the concentration of mapped read match end positions and by visual inspection of BFAST BAM files in IGV 2.3.23 (Robinson et al. 2011). We used the default settings for BFAST with the exception of the index mask option (–m) set to 22 positions with no mismatches and an index hash width (-w) of 16 bp. Resulting SAM output files were converted to binary format (BAM), sorted, indexed and a mpileup BCF file produced using the SAMTOOLS library (Li et al. 2009). An exon boundary change was defined as a boundary shifting by at least a quarter of the length of the exon. By using an SR made of concatenated gene exons, intron loss could be detected where reads mapped across nominal exon boundaries.
Mitochondrial COI
Owing to its much higher level of variation, the mitochondrial COI gene was identified from the Trinity de novo assembly. Candidate COI contigs were identified and aligned (to a length of 1,431 sites) using a custom script incorporating BLAT matching by translated amino acid. Read coverage (as a proxy for abundance) was assessed by remapping sample reads at high stringency (minimum identity 0.97). In conjunction with coverage, the diversity of COI was then phylogenetically assessed against a large database of legacy and barcode COI sequences (Ratnasingham and Hebert 2007) to identify the likely true COI from diverse misindexing artefacts, contaminants, and pseudogenes.
Phylogenetic Analyses
After excluding poorly captured and otherwise dubious exons, data matrices (including the 52 original transcriptome taxa) were subjected to phylogenetic analysis. Owing to the size of these data matrices (100+ Megabytes) we used RAxML v7.2.8, applying a codon position partition (first, second, and third positions) model and rooted according to previous transcriptome analyses (O’Hara et al. 2014). Such exon-capture data sets present a large computational task requiring many hundreds or thousands of CPU hours. Therefore, in addition to the typical full RAxML analysis, an approximate approach was investigated. An all-compatible consensus topology was derived (through PAUP) from RAxML GTR-CAT model fast BS trees. Maximum-likelihood branch lengths were then estimated using the full GTR-gamma model.
Sample and exon target information, Illumina read files, SR sequences, mapping pipeline scripts, phylogenetic data set, and RAxML tree are all available through DRYAD http://dx.doi.org/10.5061/dryad.db339.
Acknowledgments
The authors thank Sadie Mills (NIWA), Marc Eléaume (MNHN) and Gustav Paulay (UF) for providing tissue samples, Kate Naughton (MV) for assembling plate 4, Melanie Mackenzie (MV) for facilitating transport of materials, Travis Glenn (University of Georgia) for early discussions on the potential of exon-capture, Luisa Teasdale (MV) for bioinformatics advice, Kevin Rowe (MV) for commenting on drafts of this article, and Brant Faircloth and Travis Glenn for advice in review. This work was supported by the Marine Biodiversity Hub, funded through the National Environmental Research Program (NERP), and administered through the Australian Government’s Department of the Environment. This article is an output of the project “National maps of biodiversity and connectivity.”
References
- Aberer AJ, Kobert K, Stamatakis A. 2014. ExaBayes: massively parallel Bayesian tree inference for the whole-genome era. Mol Biol Evol. 31:2553–2556. [DOI] [PMC free article] [PubMed] [Google Scholar]
- Altmann A, Weber P, Bader D, Preuß M, Binder EB, Müller-Myhsok B. 2012. A beginners guide to SNP calling from high-throughput DNA-sequencing data. Hum Genet. 131:1541–1554. [DOI] [PubMed] [Google Scholar]
- Bejerano G, Pheasant M, Makunin I, Stephen S, Kent WJ, Mattick JS, Haussler D. 2004. Ultraconserved elements in the human genome. Science 34:1321–1325. [DOI] [PubMed] [Google Scholar]
- Bi K, Vanderpool D, Singhal S, Linderoth T, Moritz C, Good JM. 2012. Transcriptome-based exon capture enables highly cost-effective comparative genomic data collection at moderate evolutionary scales. BMC Bioinformatics 13:1–14. [DOI] [PMC free article] [PubMed] [Google Scholar]
- de Queiroz A, Gatesy J. 2007. The supermatrix approach to systematics. Trends Ecol Evol. 22:34–41. [DOI] [PubMed] [Google Scholar]
- Faircloth BC, Branstetter MG, White ND, Harvey MG, Brady SG. 2015. Target enrichment of ultraconserved elements from arthropods provides a genomic perspective on relationships among Hymenoptera. Mol Ecol Resour. 15:489–501. [DOI] [PMC free article] [PubMed] [Google Scholar]
- Faircloth BC, McCormack JE, Crawford NG, Harvey MG, Brumfield RT, Glenn TC. 2012. Ultraconserved elements anchor thousands of genetic markers spanning multiple evolutionary timescales. Syst Biol. 61:717–726. [DOI] [PubMed] [Google Scholar]
- Fell HB. 1963. The phylogeny of sea stars. Philos Trans R Soc Lond B Biol Sci. 246:381–435. [Google Scholar]
- Gnirke A, Melnikov A, Maguire J, Rogov P, LeProust EM, Brockman W, Fennell T, Giannoukos G, Fisher S, Russ C, et al. 2009. Solution hybrid selection with ultralong oligonucleotides for massively parallel targeted sequencing. Nat Biotechnol. 27:182–189. [DOI] [PMC free article] [PubMed] [Google Scholar]
- Grabherr MG, Haas BJ, Yassour M, Levin JZ, Thompson DA, Amit I, Adiconis X, Fan L, Raychowdhury R, Zeng Q, et al. 2011. Full-length transcriptome assembly from RNA-Seq data without a reference genome. Nat Biotechnol. 29:644–652. [DOI] [PMC free article] [PubMed] [Google Scholar]
- Hancock-Hanser BL, Frey A, Leslie MS, Dutton PH, Archer FI, Morin PA. 2013. Targeted multiplex next-generation sequencing: advances in techniques of mitochondrial and nuclear DNA sequencing for population genomics. Mol Ecol Resour. 13:254–268. [DOI] [PubMed] [Google Scholar]
- Hedtke SM, Morgan MJ, Cannatella DC, Hillis DM. 2013. Targeted enrichment: maximizing orthologous gene comparisons across deep evolutionary time. PLoS One 8:e67908. [DOI] [PMC free article] [PubMed] [Google Scholar]
- Homer N, Merriman B, Nelson SF. 2009. BFAST: an alignment tool for large scale genome resequencing. PLoS One 4:e7767. [DOI] [PMC free article] [PubMed] [Google Scholar]
- Hudson RR. 1991. Gene genealogies and the coalescent process. Oxf Surv Evol Biol. 7:1–44. [Google Scholar]
- Janies D, Voight JR, Daly M. 2011. Echinoderm phylogeny including Xyloplax, a progenetic asteroid. Syst Biol. 60:420–438. [DOI] [PubMed] [Google Scholar]
- Kent WJ. 2002. BLAT—the BLAST-like alignment tool. Genome Res. 12:656–664. [DOI] [PMC free article] [PubMed] [Google Scholar]
- Knowles LL. 2009. Statistical phylogeography. Annu Rev Ecol Evol Syst. 40:593–612. [Google Scholar]
- Leaché AD, Wagner P, Linkem CW, Böhme W, Papenfuss TJ, Chong RA, Lavin BR, Bauer AM, Nielsen SV, Greenbaum E, et al. 2014. A hybrid phylogenetic–phylogenomic approach for species tree estimation in African Agama lizards with applications to biogeography, character evolution, and diversification. Mol Phylogenet Evol. 79:215–230. [DOI] [PubMed] [Google Scholar]
- Lemmon AR, Emme SA, Lemmon EM. 2012. Anchored hybrid enrichment for massively high-throughput phylogenomics. Syst Biol. 61:727–744. [DOI] [PubMed] [Google Scholar]
- Lemmon EM, Lemmon AR. 2013. High-throughput genomic data in systematics and phylogenetics. Annu Rev Ecol Evol Syst. 44:99–121. [Google Scholar]
- Li C, Hofreiter M, Straube N, Corrigan S, Naylor GJP. 2013. Capturing protein-coding genes across highly divergent species. Biotechniques 54:321–326. [DOI] [PubMed] [Google Scholar]
- Li H, Handsaker B, Wysoker A, Fennell T, Ruan J, Homer N, Marth G, Abecasis G, Durbin R, 1000 Genome Project Data Processing Subgroup. 2009. The Sequence Alignment/Map format and SAMtools. Bioinformatics 25:2078–2079. [DOI] [PMC free article] [PubMed] [Google Scholar]
- Lohse M, Bolger AM, Nagel A, Fernie AR, Lunn JE, Stitt M, Usadel B. 2012. RobiNA: a user-friendly, integrated software solution for RNA-Seq-based transcriptomics. Nucleic Acids Res. 40:W622–W627. [DOI] [PMC free article] [PubMed] [Google Scholar]
- Lynch M. 2002. Intron evolution as a population-genetic process. Proc Natl Acad Sci U S A. 99:6118–6123. [DOI] [PMC free article] [PubMed] [Google Scholar]
- Mandel JR, Dikow RB, Funk VA, Masalia RR, Staton SE, Kozik A, Michelmore RW, Rieseberg LH, Burke JM. 2014. A target enrichment method for gathering phylogenetic information from hundreds of loci: an example from the Compositae. Appl Plant Sci. 2:1300085. [DOI] [PMC free article] [PubMed] [Google Scholar]
- Martynov AV. 2010. Reassessment of the classification of the Ophiuroidea (Echinodermata), based on morphological characters. I. General character evaluation and delineation of the families Ophiomyxidae and Ophiacanthidae. Zootaxa 2697:1–154. [Google Scholar]
- Mason VC, Li G, Helgen KM, Murphy WJ. 2011. Efficient cross-species capture hybridization and next generation sequencing of mitochondrial genomes from noninvasively sampled museum specimens. Genome Res. 21:1695–1704. [DOI] [PMC free article] [PubMed] [Google Scholar]
- McCormack JE, Hird SM, Zellmer AJ, Carstens BC, Brumfield RT. 2013. Applications of next-generation sequencing to phylogeography and phylogenetics. Mol Phylogenet Evol. 66:526–538. [DOI] [PubMed] [Google Scholar]
- Mortensen T. 1932. On an extraordinary ophiurid, Ophiocanops fugiens Koehler. With remarks on Astrogymnotes, Ophiopteron, and on an albino Ophiocoma. Papers from Dr. Th. Mortensen’s Pacific Expedition 1914–16. LX. Vidensk Medd Dansk Naturhist Foren. 93:1-21, pl. 21. [Google Scholar]
- OBIS. 2014. Global biodiversity indices from the Ocean Biogeographic Information System. Intergovernmental Oceanographic Commission of UNESCO [accessed 2015 Jan 21]. Available from: http://www.iobis.org [Google Scholar]
- O’Hara TD. 2007. Seamounts: centres of endemism or species-richness for ophiuroids? Glob Ecol Biogeogr . 16:720–732. [Google Scholar]
- O’Hara TD, England PR, Gunasekera R, Naughton KM. 2014. Limited phylogeographic structure for five bathyal ophiuroids at continental scales. Deep Sea Res Part 1 Oceanogr Res Pap. 84:18–28. [Google Scholar]
- O’Hara TD, Hugall AF, Thuy B, Moussalli A. 2014. Phylogenomic resolution of the Class Ophiuroidea unlocks a global microfossil record. Curr Biol. 24:1874–1879. [DOI] [PubMed] [Google Scholar]
- O’Hara TD, Rowden AA, Bax NJ. 2011. A southern hemisphere bathyal fauna is distributed in latitudinal bands. Curr Biol. 21:226–230. [DOI] [PubMed] [Google Scholar]
- Parmley JL, Urrutia AO, Potrzebowski L, Kaessmann H, Hurst LD. 2007. Splicing and the evolution of proteins in mammals. PLoS Biol. 5:e14. [DOI] [PMC free article] [PubMed] [Google Scholar]
- Ratnasingham S, Hebert PDN. 2007. BOLD: The Barcode of Life Data System (www.barcodinglife.org). Mol Ecol Notes. 7:355-364. [Google Scholar]
- Robinson JT, Thorvaldsdóttir H, Winckler W, Guttman M, Lander ES, Getz G, Mesirov JP. 2011. Integrative genomics viewer. Nat Biotechnol. 29:24–26. [DOI] [PMC free article] [PubMed] [Google Scholar]
- Roy SW. 2009. Phylogenomics: gene duplication, unrecognized paralogy and outgroup choice. PLoS One 4:e4568. [DOI] [PMC free article] [PubMed] [Google Scholar]
- Sladen WP. 1879. On the structure of Astrophiura, a new and aberrant genus of Echinodermata. Ann Mag Nat Hist Series 5 4:401–415, pl. 20. [Google Scholar]
- Smith AB, Paterson GLJ, Lafay B. 1995. Ophiuroid phylogeny and higher taxonomy: morphological, molecular and palaeontological perspectives. Zool J Linn Soc. 114:213–243. [Google Scholar]
- Sprinkle J, Guensburg TE. 2004. Crinozoan, blastozoan, echinozoan, asterozoan, and homalozoan echinoderms. In: Webby BD, Paris F, Droser ML, Percival IG, editors. The Great Ordovician Biodiversification Event. New York: Columbia University Press; p. 266–280. [Google Scholar]
- Stamatakis A. 2014. RAxML version 8: a tool for phylogenetic analysis and post-analysis of large phylogenies. Bioinformatics 30:1312–1313. [DOI] [PMC free article] [PubMed] [Google Scholar]
- Stöhr S, Conand C, Boissin E. 2008. Brittle stars (Echinodermata: Ophiuroidea) from La Réunion and the systematic position of Ophiocanops Koehler, 1922. Zool J Linn Soc. 153:545–460. [Google Scholar]
- Stöhr S, O’Hara TD, Thuy B. 2012. Global diversity of brittle stars (Echinodermata: Ophiuroidea). PLoS One 7:e31940. [DOI] [PMC free article] [PubMed] [Google Scholar]
- Swofford DL. 2003. PAUP*. Phylogenetic Analysis using Parsimony (* and other methods). Version 4. Sunderland (MA): Sinauer Associates. [Google Scholar]
- Thuy B, Stöhr S. 2011. Lateral arm plate morphology in brittle stars (Echinodermata: Ophiuroidea): new perspectives for ophiuroid micropalaeontology and classification. Zootaxa 3013:1–47. [Google Scholar]
- Tilston-Smith B, Harvey MG, Faircloth BC, Glenn TC, Brumfield RT. 2014. Target capture and massively parallel sequencing of ultraconserved elements for comparative studies at shallow evolutionary time scales. Syst Biol. 63:83–95. [DOI] [PubMed] [Google Scholar]
- Zhang J. 2003. Evolution by gene duplication: an update. Trends Ecol Evol. 18:292–298. [Google Scholar]


