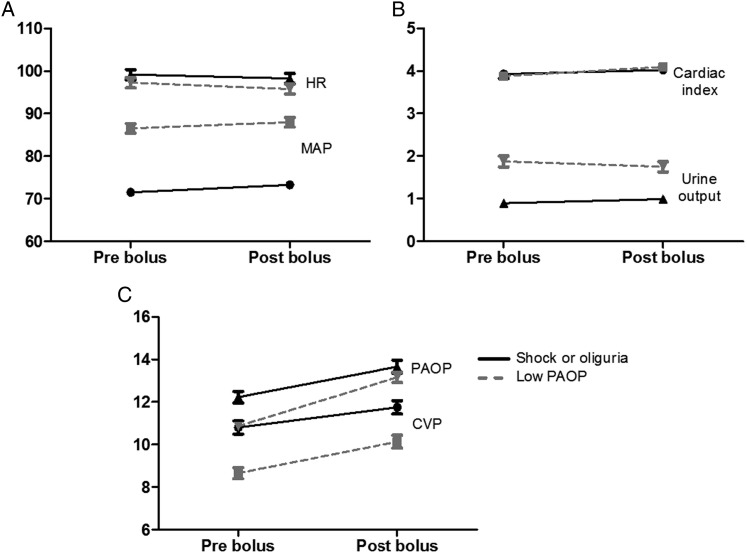
Figure 2 –
Change in hemodynamic variables before a fluid bolus (“pre”) and after a fluid bolus (“post”). Changes are stratified by indication, with solid lines and black symbols representing patients with shock or low UOP and dotted lines and gray symbols representing patients with acceptable MAP and UOP but low PAOP. A, MAP (mm Hg) and HR (beats/min). B, Cardiac index (L/min/m2) and UOP (mL/kg/h). C, CVP (mm Hg) and PAOP (mm Hg). See Figure 1 legend for expansion of abbreviations.

