Abstract
We aimed to characterize the organization of collagen within a fibrotic scar in swine and human samples from patients with chronic infarctions. Swine were subjected to occlusion of the left anterior descending artery followed by reperfusion 1 week (acute myocardial infarction group) or 1 month (chronic myocardial infarction group) after infarction. The organization of the collagen fibers (Fast Fourier Transform of samples after picrosirius staining; higher values indicate more disorganization) was studied in 100 swine and 95 human samples. No differences in collagen organization were found between the acute and chronic groups in the core area of the scar in the experimental model. In the chronic group, the endocardium [0.90 (0.84–0.94); median (interquartile range)], epicardium [0.84 (0.79–0.91)] and peripheral area [0.73 (0.63–0.83)] displayed a much more disorganized pattern than the core area of the fibrotic scar [0.56 (0.45–0.64)]. Similarly, in human samples, the collagen fibers were more disorganized in all of the outer areas than in the core of the fibrotic scar (P < 0.0001). Both in a highly controlled experimental model and in patient samples, collagen fibers exhibited an organized pattern in the core of the infarction, whereas the outer areas displayed a high level of inhomogeneity. This finding contributes pathophysiological information regarding the healing process and may lead to a clearer understanding of the genesis and invasive treatment of arrhythmias after acute myocardial infarction.
Keywords: fibrosis, myocardial infarction, swine model
Introduction
The healing process following a myocardial infarction (MI) plays a key role in patient outcomes. It involves a cascade of events that includes different cell types; the aim of the healing process is to remove necrotic tissue, which leads to the synthesis and deposition of new collagen in the infarcted area (van den Borne et al. 2010; Mewton et al. 2011).
In addition to providing strength and stiffness to the myocardium, the organization of collagen in the scar provides a structural support for cardiomyocytes (Whittaker et al. 1991). Collagen fibers play a key role in preserving the structural integrity and tissue function after MI (Whittaker et al. 1991; Rich & Whittaker, 2005). The organization of collagen is influenced by the deformation of the ischemic area, which produces mechanical stretching; this leads to the migration of fibroblasts and thereby the deposition of collagen fibers (Zimmerman et al. 2000; Fomovsky et al. 2012).
A ‘gray zone’, which consists of a region of heterogeneous tissue within the infarcted periphery and correlates with ventricular arrhythmias and post‐MI mortality, has been described using cardiac magnetic resonance (CMR; Schmidt et al. 2007; Mewton et al. 2011). Although collagen fiber organization has been studied in previous papers (Whittaker et al. 1991; Zimmerman et al. 2000; Holmes et al. 2005; Zhou et al. 2011; Fomovsky et al. 2012), an in‐depth pathological characterization of this process throughout all areas of the fibrotic scar using myocardial samples has not yet been performed. This issue may have potential implications for the pathophysiology of left ventricular (LV) remodeling as well as on the genesis and invasive therapy of ventricular arrhythmias by catheter ablation (Zipes et al. 2006).
We aimed to carry out a comprehensive characterization of the organization of collagen fibers within the different zones of the fibrotic scar both in the core of the infarction and in the outer areas using myocardial samples obtained from an in vivo swine model of an anterior MI and in samples of patients with a chronic infarct.
Materials and methods
Experimental study
Seventeen juvenile domestic pigs weighing 25–30 kg were used. The local Animal Care and Use Committee approved the study; this study conforms to the Guide for the Care and Use of Laboratory Animals published by the US National Institutes of Health (NIH Publication No. 85‐23, revised 1993) and to The ARRIVE guidelines (www.nc3rs.org.uk/ARRIVE).
Further details on our study protocol can be found elsewhere (Bodi et al. 2010, 2012). Pigs were sedated using intra‐muscular 8 mg kg−1 ketamine and 0.1 mg kg−1 medetomidine. The right jugular vein was cannulated to administer drugs and to obtain blood samples. A 10 mg kg−1 h−1 continuous intra‐venous infusion of 2% propofol was used as anesthesia. Pigs were pretreated with intra‐venous amiodarone (300 mg) and lidocaine (30 mg) to diminish life‐threatening arrhythmias, and with heparin (3000 U). Pigs were mechanically ventilated using a 50% oxygen gas mixture and a continuous electrocardiographic monitoring of heart rate, rhythm, and ST‐segment changes was performed. A 7F sheath was introduced into the right femoral artery to monitor blood pressure and to access the left anterior descending coronary artery (LAD). A 7F Amplatz Left 0.75 catheter was used to engage selectively the proximal LAD, and a standard hydrophilic angioplasty wire was advanced and placed in the distal LAD. A 2.5 × 15 mm angioplasty balloon was inflated at 6 atm in the mid LAD. Coronary artery occlusion was confirmed by contrast injection and by electrocardiographic ST‐segment elevation.
Two groups of experiments with reperfusion were carried out: the acute MI group and the chronic MI group. In both groups, the balloon was deflated after 90 min of coronary occlusion, and restoration of normal coronary flow was documented by angiography. Afterwards, the animals were allowed to recover, and after 1 week (n = 5, acute MI group) or 1 month (n = 5, chronic MI group), coronary angiography was repeated using the same methodology. No coronary occlusion or dissection was detected when the second catheterization was carried out. The hearts were arrested with potassium chloride and excised.
The control group consisted of five experiments. In this group we used the same study protocol described above, but the balloon angioplasty was not inflated and thus ischemia and infarction were not provoked. Hearts were then arrested with potassium chloride and excised.
Macroscopic study
Immediately after excision, the whole heart was photographed and sectioned into 5‐mm‐thick short‐axis slices. Thereafter, the slices were incubated in a 2,3,5‐triphenyltetrazolium chloride (TTZ; Merck Millipore, Billerica, MA, USA) 2% solution for 20 min at 37 °C. Finally, the slices were viewed under room light and photographed. Infarcted tissue was defined as the myocardial area that did not stain with TTZ; it was expressed as the percentage of the LV volume.
The images were digitalized, and manual quantification of all of the short‐axis slices was carried out offline in a core laboratory (Cardiac Imaging Unit, Incliva, Valencia, Spain) by an experienced observer unaware of the protocol used in each experiment. The software package matlab 6.5 (The Mathworks, Inc., Natick, MA, USA) was used. A ruler, which was used as a reference for measurement, was photographed next to myocardial slices in all images. This, combined with the predefined slice thickness (5 mm), permitted the calculation of LV myocardial volumes and infarcted areas (tissue not stained with TTZ) (Fig. 1A).
Figure 1.
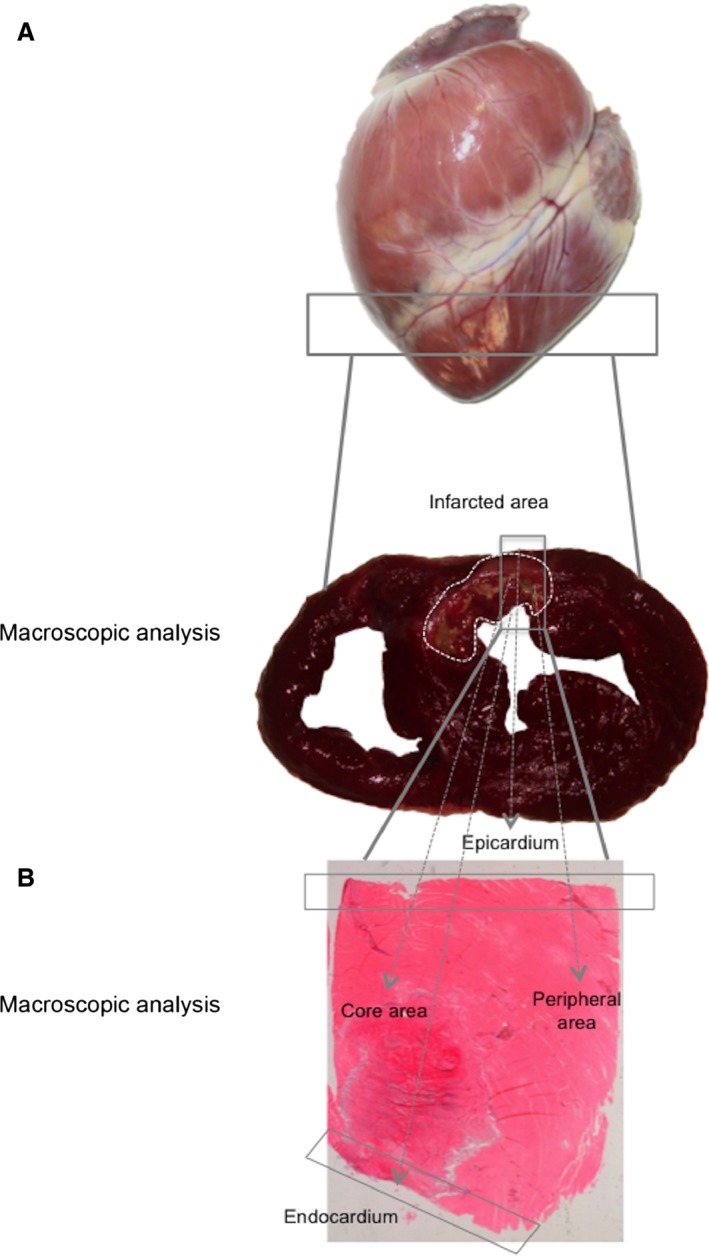
Samples used to evaluate collagen organization within the fibrotic scar. (A) Images of the whole heart and TTZ stained section. Infarcted tissue was defined as the myocardial area that did not stain with TTZ (white points) and is expressed as the percentage of the LV volume. (B) Four different areas were studied within the fibrotic scar: the core area, endocardium, epicardium and peripheral area. LV, left ventricular; TTZ, 2,3,5‐triphenyltetrazolium chloride.
Microscopic study of myocardial samples
Picrosirius staining
Collagen quantification and fiber organization were studied using a picrosirius method. The specimens were embedded in paraffin and sectioned at 5 μm. The sections were stained in 0.1% Direct Red 80 (Sigma‐Aldrich, St. Louis, MO, USA) in saturated picric acid for 1 h. Afterwards, the sections were differentiated in 0.5% acetic acid, dehydrated, cleared and mounted (Osman et al. 2013). Images for each sample were captured in an optic microscope, Leica DMD 108 (Leica Microsystems, Weztlar, Germany), at 20× magnification using a polarizer filter. This filter permitted the differentiation of type I collagen (orange‐red) and type III collagen (yellow‐green).
The scar was divided into four areas: the core area (central core of infarcted tissue), endocardium, epicardium and peripheral area (zone within the infarcted tissue but near the edge with the healthy tissue) (Fig. 1B). Overall, 100 samples of the swine model were assessed and the results were obtained comparing the core area with the outer areas (including all samples collected from endocardium, epicardium and peripheral area). Additionally, the core area was separately compared with the endocardium, epicardium and peripheral area. Image processing was performed using image proplus 6.0 software (Media Cybernetics, Rockville, MD, USA). The quantity of type I collagen and type III collagen were calculated and expressed as a percentage per field.
Fourier transformation of cardiac images
The Fast Fourier Transform (FFT) algorithm was implemented in image proplus 6.0 software to determine the organization of collagen fibers. As has been described by Osman et al. (2013) in their work regarding the collagen architecture in skin, FFT is an algorithm to compute the Discrete Fourier Transform (DFT) of a signal and its inverse. The DFT of an image extracts the strength of the frequency waveforms contributing to the pixel value of the entire image. The amplitude of the DFT values for all of the pairs of frequencies form the overall Fourier spectrum of the image. All of the frequencies present in an image are represented in the frequency spectrum, and the image patterns in the spectrum are used to determine the relative organization of the original image texture. In this way, the organization of an image is deducible and quantifiable from the spectrum of all of the present frequencies. For each spectrum, elliptical measurements of the scatter pattern were performed (Fig. 2). A collagen organization index (n) was generated as described in the following equation:
Figure 2.
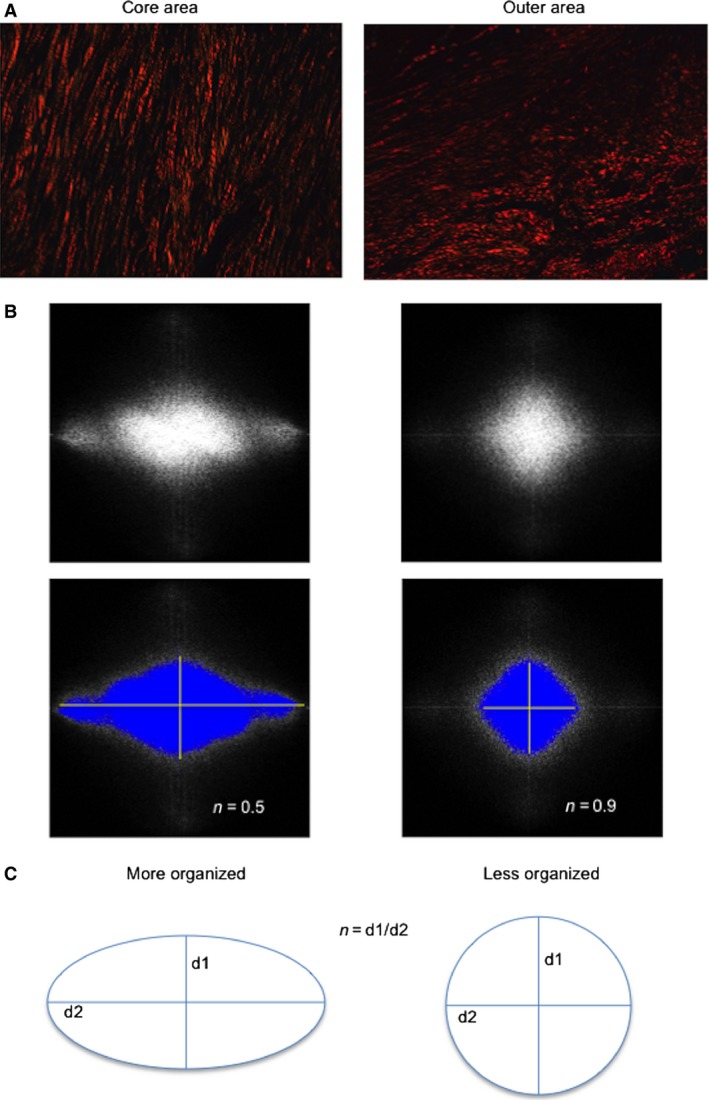
The FFT method was used to assess the organization of collagen fibers in the different parts of the fibrotic scar. (A) Samples from the core (left) and the outer (right) areas stained with picrosirius and photographed using a polarizer filter at 20× magnification. (B) FFT spectra obtained from photographs in (A). Collagen fibers in the core area are organized in a parallel manner; therefore, the collagen organization index is 0.5. In contrast, in the outer area, collagen fibers present a disorganized arrangement; hence, the collagen organization index is near 1. (C) The scheme represents the Fourier transform pattern obtained in each photograph. The equation used to calculate the organization index is described. FFT, Fast Fourier transform.
The organization index ranges between 0 and 1 (van Zuijlen et al. 2002; Osman et al. 2013; Marcos‐Garcés et al. 2014). A completely random orientation, suggesting total disorganization, results in an organization index that approximates to 1, whereas a perfect organization results in an organization index that approximates to 0. Therefore, the n value ranges between 0 and 1, higher values indicating disorganization and lower values a more parallel organization (van Zuijlen et al. 2002).
Transmission electron microscopy
For visualization with transmission electron microscopy (TEM), samples from the infarct region were fixed in 2.5% glutaraldehyde and then in osmium tetroxide. Semi‐thin and subsequently ultra‐thin sections were prepared and images for each sample were captured using a JEM‐1010 (JEOL Ltd., Tokyo, Japan) at 10 000× magnification.
Myofibroblast detection
Paraffin sections from the infarct region were used for myofibroblast detection. The primary antibody anti‐alpha smooth muscle actin (α‐SMA) (Abcam, Cambridge, UK) was applied and incubated overnight at 4 °C. Amplification of the primary antibody signal was carried out by a 45‐min incubation with secondary antibody polyclonal goat anti‐rabbit immunoglobulins/HRP (Dako Denmark, Glostrup, Denmark). Photographs at 20× magnification were taken of each part (core area, endocardium, epicardium and peripheral area) using an optic microscope Leica DMD 108. An experienced observer assessed the arrangement of myofibroblasts.
Study of patient samples
Myocardial samples of five patients with a chronic infarct (more than 6 months after acute MI) were obtained from autopsies. Clinical and autopsy characteristics of patients included in the study group are displayed in Table 1. Overall, 95 samples were analyzed from the core area, endocardium, epicardium and peripheral area from the fibrotic scar.
Table 1.
Clinical data and autopsy results of patients
| Clinical data | Autopsy results | |
|---|---|---|
| Patient 1 |
Male, hypertension, ex‐smoker, heart failure, ischemic cardiomyopathy EF by CMR: 15% Infarct: 2005, 70 years Death: heart failure, 2012, 77 years |
Chronic infarcted area: 2 × 3 cm lateral wall of the left ventricle Chronic infarcted area: 2.5 × 0.7 cm interventricular septum Atherosclerosis |
| Patient 2 |
Male, hypertension, dyslipidemia, diabetes mellitus, ischemic cardiomyopathy EF by Echo: 36% Infarct: 2002, 71 years Death: heart failure, 2013, 82 years |
Chronic infarcted area: anterolateral wall of the left ventricle Atherosclerosis |
| Patient 3 |
Male, hypertension, ex‐smoker, hepatopathy, dyslipidemia, obesity, atrial septal defect, chronic alcoholism, ischemic cardiomyopathy EF by Echo: 32% Infarct: Unknown Death: re‐infarct, 2014, 58 years |
Chronic infarcted area: 6.5 × 7.5 cm anterior wall of the right ventricle |
| Patient 4 |
Male, hypertension, chronic kidney disease, dyslipidemia, hypertrophic cardiomyopathy of the left ventricle, chronic obstructive pulmonary disease, achalasia, abdominal aortic aneurysm, supraglottic carcinoma EF by Echo: 56% Infarct: Unknown Death: cardiogenic shock, 2014, 78 years |
Chronic infarcted area: intramyocardial patchy fibrosis in the interventricular septum and at subendocardial level of the left ventricle Atherosclerosis |
| Patient 5 |
Male, smoking, dyslipidemia, obesity, chronic obstructive pulmonary disease, cardiomegaly Infarct: Unknown Death: stroke, 2012, 55 years |
Chronic infarcted area: 2 × 2 cm interventricular septum Atherosclerosis |
CMR, cardiac magnetic resonance; Echo, echocardiography; EF, ejection fraction.
A microscopic study of the myocardial samples was performed following the same protocol described for the experimental samples (staining with picrosirius and FFT analysis).
Endpoints
The endpoints of the present study were as follows:
First, we aimed to describe the organization of the collagen fibers in the core area, endocardium, epicardium and peripheral area of the fibrotic scar in myocardial samples obtained from a highly controlled swine model of reperfused anterior MIs.
Secondly, we intended to ascertain whether the organization pattern detected in the experimental model also occurred in patients with spontaneous chronic infarctions.
Statistical analyses
Non‐parametric tests were used throughout. Data were expressed as the median with the interquartile range and compared using the Mann–Whitney U‐test. The Kruskal–Wallis test was used for multiple comparisons. Statistical significance was considered for two‐tailed P < 0.05. graphpad prism 6.0 (GraphPad, La Jolla, CA, USA) was used throughout.
Results
Experimental study
Seventeen juvenile domestic pigs weighing 25–30 kg were used. Two of them died during balloon inflation due to refractory ventricular fibrillation. Electrical ventricular defibrillation was needed in another seven pigs during LAD occlusion. No significant complications were recorded over the reperfusion period. Successful experiments were divided in three groups: the control group (n = 5), acute MI group (n = 5) and chronic MI group (n = 5).
In the acute MI group, the infarcted area occupied 27% of the LV volume. In the chronic MI group, the fibrotic area shrunk and occupied 15% of the LV volume.
The acute MI and the control groups displayed similar amounts of type I and type III collagen (Supporting Information Fig. S1A). Type I collagen predominated in both cases (P < 0.0001). A significant increase in the amount of type I and type III collagen was detected in the chronic MI group (P < 0.0001 vs. control and acute MI groups). Type I collagen was also more prevalent than type III in the chronic MI group (P < 0.0001) (Fig. S1B).
Collagen fiber organization in swine samples
When the organization of collagen fibers in the core of the infarcted area (acute MI group) and the core of the fibrotic scar (chronic MI group) were compared, no significant differences were detected: the collagen organization index was 0.56 (0.49–0.66) [median (interquartile range)] in the acute MI group and 0.56 (0.45–0.64) in the chronic MI group (P = ns) (Fig. 3).
Figure 3.
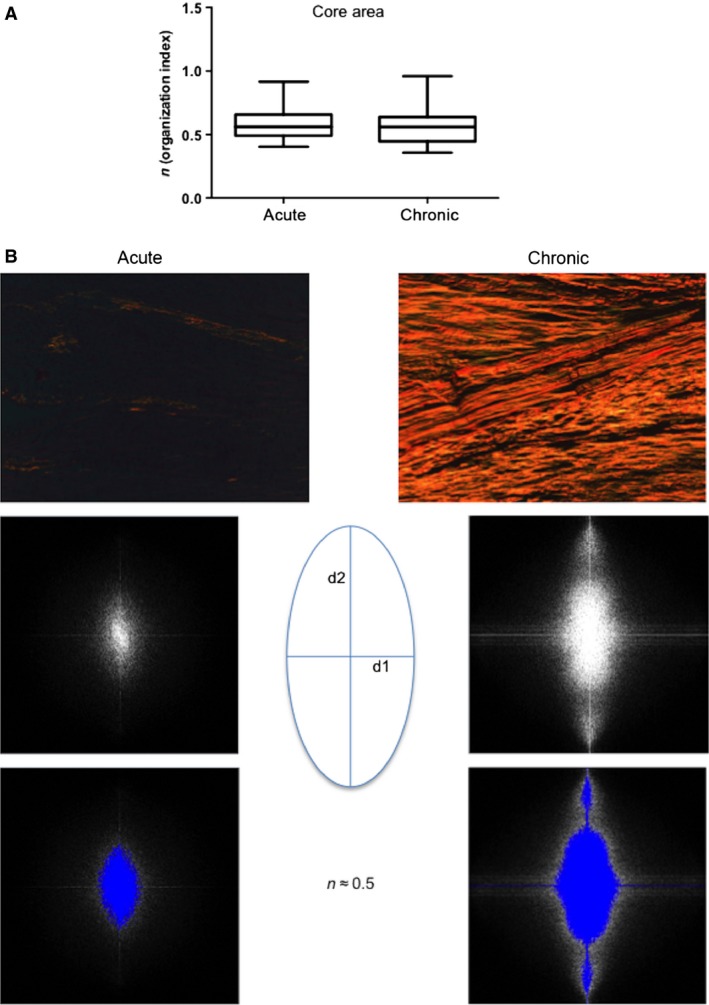
Dynamics of collagen organization in the core area of the fibrotic scar. No differences existed between the acute and chronic MI groups when we compared the organization of collagen fibers in the core area of the infarcted tissue. (A) The collagen organization index was similar in the core area of the acute and chronic MI groups. Upper and lower lines of the boxes represent the 25th and 75th percentiles. The line in the middle of the box is plotted at the median. Whiskers represent 1 and 99 percentiles. (B) Images illustrate examples of the core area of the infarcted tissue from the acute and chronic MI groups stained with picrosirius and photographed using a polarizer filter at 20× magnification. Fourier transform spectra obtained from these images and their representative schemes are presented. A lower quantity of collagen is observed in the acute MI group than in the chronic MI group. Both groups present an organized arrangement of collagen fibers in the core area of the scar; hence the Fourier transform spectra show a directional pattern.
In the chronic MI group, samples were collected from the core area, endocardium, epicardium and peripheral area for microscopic studies of the fibrotic scar (Fig. 1). A higher disorganization was found in the outer areas (including the endocardium, epicardium and peripheral area) compared to the core of the fibrotic scar (P < 0.0001) (Fig. 4).
Figure 4.
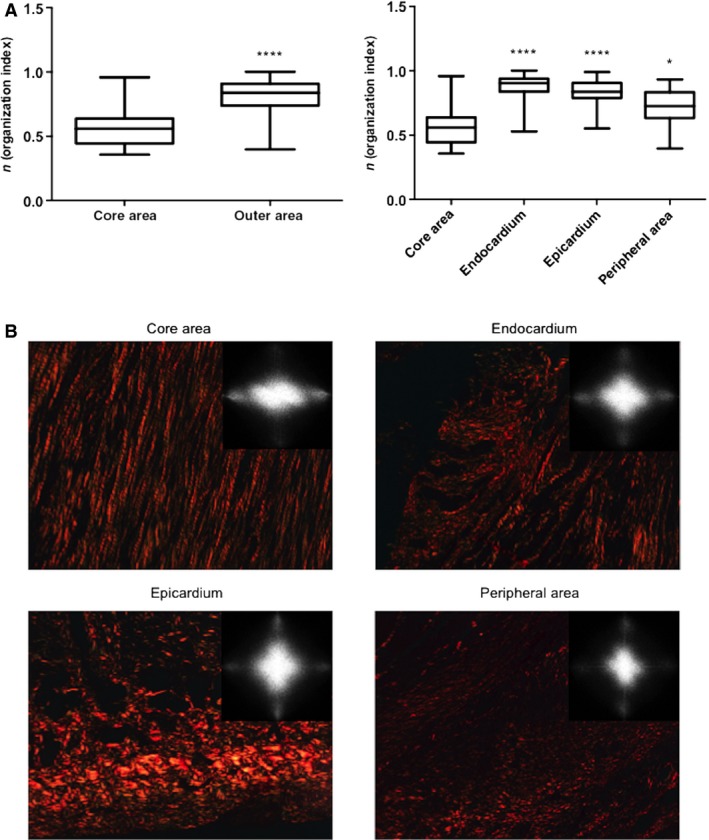
Collagen fiber organization in different areas within the fibrotic scar of swine samples. (A) The collagen organization index was higher in the outer zones compared to the core area. Upper and lower lines of the boxes represent the 25th and 75th percentiles. The line in the middle of the box is plotted at the median. Whiskers represent 1 and 99 percentiles. ****P < 0.0001 vs. core area; *P < 0.05 vs. core area. (B) Images stained with picrosirius (photographed using a polarizer filter at 20× magnification) and Fourier transform spectra obtained from these images illustrate the differences in collagen organization between the different areas of the fibrotic scar. Collagen fibers in the core area are organized almost in a parallel manner. In contrast, in the endocardium, epicardium and peripheral area, collagen fibers show a random arrangement.
In the core of the scar, collagen fibers displayed an almost parallel arrangement; in the separately analyzed outer areas, a random distribution was detected (Fig. 4). The organization index in the core area [0.56 (0.45–0.64)] was much lower than the endocardium [0.90 (0.84–0.94)], epicardium [0.84 (0.79–0.91)] and peripheral area [0.73 (0.63–0.83)], P < 0.0001, core area vs. endocardium and epicardium; P < 0.05, core area vs. peripheral area (Fig. 4). These figures suggest that in a highly controlled porcine model of chronic MI, collagen fibers display an almost perfect organization in the core of the scar. In contrast, the outer areas (including the endocardium, epicardium and peripheral area) exhibit a much more inhomogeneous pattern.
Transmission electron microscopy
In the TEM captions, in parallel with optical microscopy, the collagen fibers in the core area were well organized. In the endocardium, epicardium and peripheral area, collagen fibers were disposed in a random manner (Fig. 5).
Figure 5.
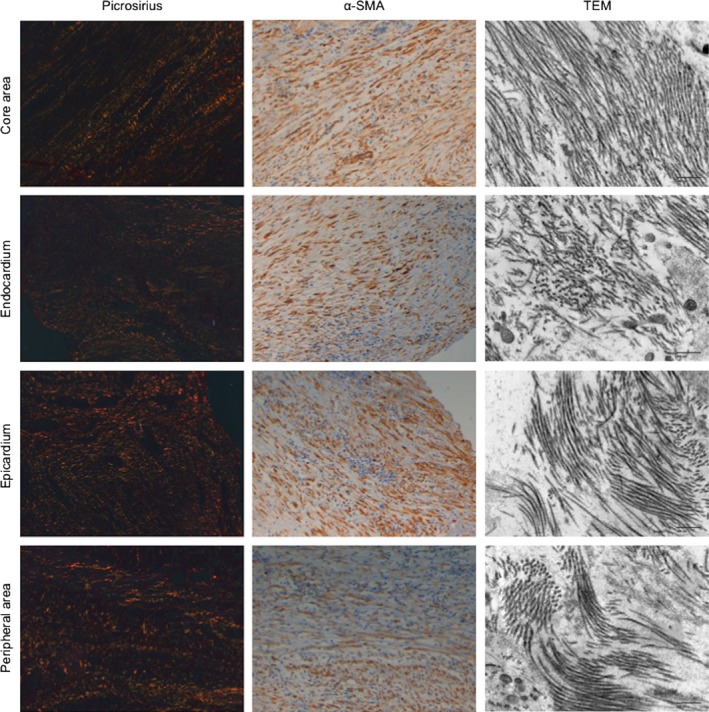
Collagen fibers and myofibroblast arrangement in different areas of the fibrotic scar of swine samples. Left panels: Images stained with picrosirius photographed using a polarizer filter at 20× magnification. Middle panels: Images of alpha smooth muscle actin (α‐SMA) inmunohistochemistry photographed at 20× magnification. Right panels: Images of transmission electron microscopy (TEM) photographed at 10 000× magnification. Images exemplify the similarities between collagen and myofibroblasts arrangement in the different areas of the fibrotic scar. Upper panels correspond to the core area. In parallel with collagen fibers, myofibroblasts display a parallel disposition. TEM captions confirm the organized disposition of collagen fibers in the core area. Nevertheless, in the endocardium, epicardium and peripheral areas, collagen fibers stained by picrosirius display a disorganized disposition and myofibroblasts mirror this disorder. Finally, by TEM the collagen fibers are disposed in a disorganized manner. α‐SMA, alpha smooth muscle actin; TEM, transmission electron microscopy.
Myofibroblast organization in swine samples
To ascertain whether the myofibroblasts arrangement was also different in the different parts of the fibrotic scar, we performed a staining using anti α‐SMA antibody. The results showed that the myofibroblasts were arranged similarly to collagen fibers. In the core area, myofibroblasts were organized in a parallel manner, whereas in the endocardium, epicardium and peripheral areas they showed a more disorganized disposition (Fig. 5).
Study in patient samples
Myocardial samples obtained from five patients with chronic MIs were analyzed in the study. Their baseline characteristics and autopsy findings are listed in Table 1. All of the patients were male with a mean age of 70 ± 12 years. The autopsies revealed a fibrotic scar in all cases.
Type I and type III collagen were quantified and expressed as a percentage per field. Similar to the swine model, type I collagen predominated in all of the samples analyzed [28.4% (10.8–69.0) of type I collagen vs. 1.7% (0.9–2.8) of type III collagen, P < 0.0001] (Fig. 6).
Figure 6.
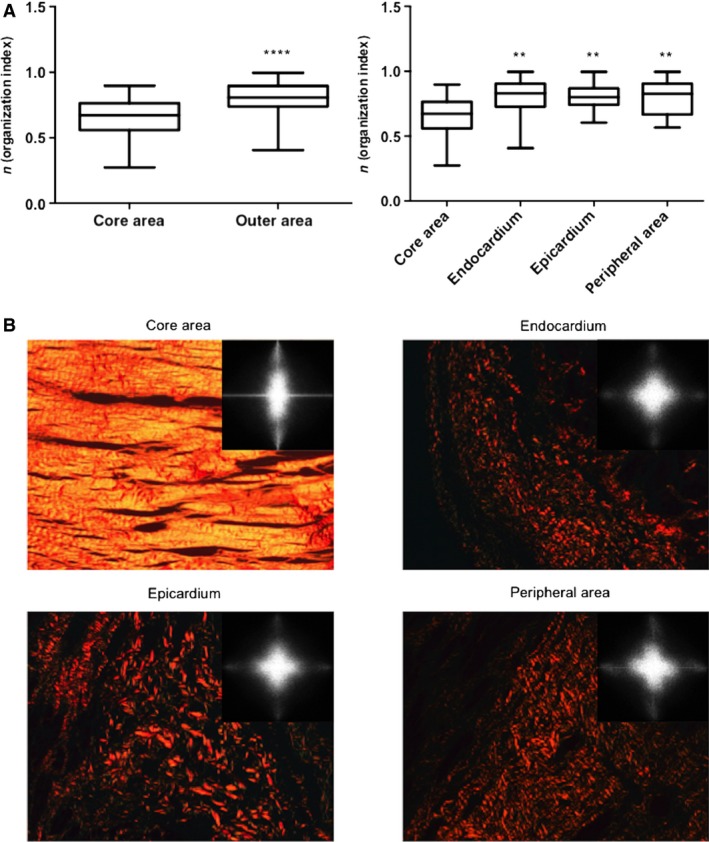
Collagen fiber organization in different areas within the fibrotic scar of human samples. The organization pattern found in human samples paralleled those detected in swine. (A) As we observed in the animal model, the collagen organization index was higher in the outer zones than in the core area. Upper and lower lines of the boxes represent the 25th and 75th percentiles. The line in the middle of the box is plotted at the median. Whiskers represent 1 and 99 percentiles. ****P < 0.0001 vs. core area; **P < 0.01 vs. core area. (B) Images stained with picrosirius (photographed using a polarizer filter at 20× magnification) and Fourier transform spectra obtained from these images are represented. Collagen fibers in the core area are organized almost in a parallel manner, whereas the fibers are disorganized in the endocardium, epicardium and peripheral area.
Collagen fiber organization in human samples
In patients with chronic infarction, collagen fiber organization was determined in 95 myocardial samples obtained from the core area and the outer zones (endocardium, epicardium and peripheral area).
Similar to the animal model, when the core of the infarcted tissue was compared with the outer areas, the latter displayed a much more disorganized pattern of collagen fiber distribution (P < 0.0001) (Fig. 6). Furthermore, we performed specific comparisons between the core area [0.67 (0.56–0.76)] and endocardium [0.83 (0.73–0.90)], epicardium [0.80 (0.74–0.87)] and peripheral area [0.83 (0.67–0.90)]. In all cases, the organization index indicated more homogeneity in the arrangement of collagen fibers in the core area compared with the outer areas of the fibrotic scar (P < 0.01 for all comparisons) (Fig. 6).
In summary, the organizational pattern of the fibrotic scar found in the myocardial human samples of patients with chronic infarction mirrored that detected in the experiments; the pattern was characterized by a more organized distribution of collagen fibers in the core area and a much more random distribution in the outer areas of the scars.
Discussion
The main contribution of the present study is the characterization of collagen fiber organization in four areas of the fibrotic scar: the core area, endocardium, epicardium and peripheral area. Our results show that collagen fibers are well organized in the core area but display a random distribution in the outer areas. This phenomenon occurs both in a highly controlled swine model and in patients with a spontaneous chronic infarction.
Collagen quantification
After MI, collagen is synthesized and secreted by myofibroblasts. These cells are involved in the scar formation after MI and produce collagen that is expected to stabilize the damaged tissue (van den Borne et al. 2010). During the healing process, the increase in collagen content occurs approximately 3 weeks post‐MI and is correlated with infarction stiffness (Lerman et al. 1983; Gupta et al. 1994). In our study, we compared the collagen content after 1 week and after 1 month of MIs. In accordance with previous work (Lerman et al. 1983; Gupta et al. 1994), an increase in the total amount of collagen was detected. Furthermore, we analyzed both collagen type I and collagen type III separately; although an increment was observed in both types of collagen, type I collagen exhibited a much higher increase. Similar to previous studies (Whittaker et al. 1989), the observed scar in both swine and human samples was characterized by a high amount of collagen type I and a smaller amount of collagen type III fibers.
Fast Fourier method
The present investigation was designed to study the differences between the organization of collagen fibers in the core area of the infarcted tissue and in the outer zones. For this purpose, the organization of collagen fibers was assessed 1 week (acute MI group) and 1 month (chronic MI group) after infarction in swine as well as in human samples of patients with chronic infarction. To determine the organization index, the FFT algorithm was implemented after staining the samples with picrosirius. The FFT algorithm has been used to estimate the power spectrum of images in other specialties, such as dermal studies (van Zuijlen et al. 2002; Osman et al. 2013; Marcos‐Garcés et al. 2014). Additionally, it has been proven that Fourier image analysis is suitable for determining the morphometry of the collagen orientation. Higher values in this index suggest more inhomogeneity in the collagen fiber distribution (van Zuijlen et al. 2002).
Dynamics of collagen fiber organization in swine
The dynamics of collagen fiber distribution in the days and weeks following acute MI tissue is controversial. Whittaker et al. (1989) demonstrated a progressive increase in the molecular organization of collagen in the first 6 weeks after infarction. Conversely, Zhou et al. (2011) suggested that as the collagen deposition increased, the fiber orientation changed from a well‐organized pattern at 3 days post‐infarction to a partially disorganized pattern at 7–14 days, and thereafter displayed a well‐organized structure 1 month after infarction.
We assessed the dynamic evolution of the distribution of collagen in the core area of the infarcted zone from the acute (1 week post‐MI) to the chronic phase (1 month post‐MI) in swine. No dynamic changes in the arrangement of collagen were detected; an almost parallel disposition of fibers existed in the core area of both the infarcted zone and the fibrotic scar.
Our results indicate that despite a massive increase in collagen content, the organization of collagen fibers is maintained in the core of the infarction. However, the arrangement of fibers in the outer areas of the fibrotic scar once the deposition of collagen has been completed is unknown. Knowledge of this issue may be relevant for a better understanding of the pathophysiology of LV remodeling as well as for the comprehension of the genesis and management of life‐threatening ventricular arrhythmias in patients with a chronic infarction.
Chronic scar
Similar to previous experimental studies (Whittaker et al. 1989; Zhou et al. 2011), in a controlled swine model of acute MI, a high level of organization of collagen fibers existed in the core of the fibrotic scar 1 month after MI.
To date, there are no data available regarding this issue in humans. In myocardial samples obtained from patients with a spontaneous chronic infarction, we observed that this homogeneous distribution of collagen fibers in the core of the scar also occurs in patients late after infarction.
Interestingly, the outer areas of the fibrotic scar exhibited a much more inhomogeneous pattern both in swine and in human samples; in the endocardium, epicardium and peripheral areas, the organization index suggested a much more random distribution of fibers compared with the core area.
Thus, our study contributes original data regarding the organization of collagen fibers; we report the first‐in‐human information regarding the inhomogeneous distribution of collagen within different areas of the fibrotic scar after acute MI.
Clinical implications
The comprehensive description of the organization of collagen fibers performed in the present study yields novel information for a better understanding of the fibrotic process.
The clinical importance of the ‘gray zone’, which has been hypothesized to be a region of heterogeneous tissue within the infarct periphery, has been previously demonstrated (Schmidt et al. 2007; Mewton et al. 2011). The characteristics of this zone have mainly been described using CMR and have been associated with the genesis of ventricular arrhythmias and post‐MI mortality (Schmidt et al. 2007; Roes et al. 2009; Mewton et al. 2011; Schuleri et al. 2012).
We have analyzed the pathology of areas corresponding to the ‘gray zone’ using histological samples from a highly controlled swine model. Moreover, our study provides the first‐in‐human information regarding the organization of collagen fibers in this territory using samples obtained from patients with a chronic infarct. The random arrangement of collagen in the endocardium, epicardium and peripheral area that was observed in swine and in patient samples (Fig. 7) may constitute the pathophysiological basis for the high arrhythmic risk and the propensity for LV remodeling and mortality observed in patients with large CMR‐derived gray areas (Schmidt et al. 2007; Mewton et al. 2011). A similar pattern of a disorganized distribution of collagen fibers has been detected in the atria of patients with atrial fibrillation (Tsai et al. 2010).
Figure 7.
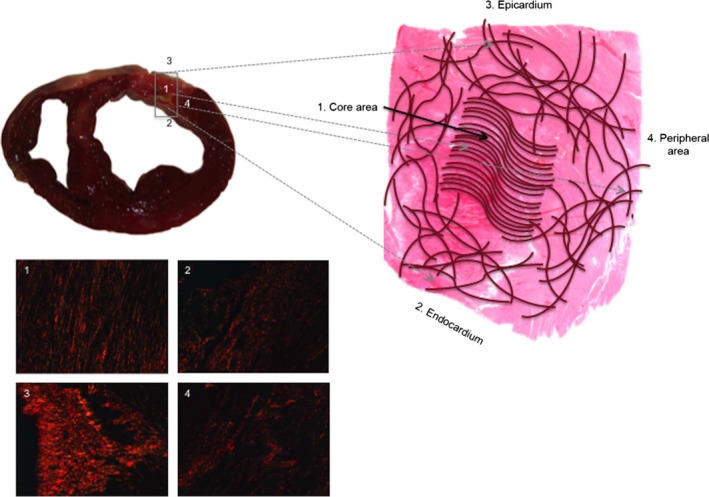
Inhomogeneity in collagen organization within the fibrotic scar. The scheme represents the organization of collagen fibers within the fibrotic scar. The fibers in the core area are arranged in an almost parallel manner. However, the collagen fibers are randomly organized in the outer areas. Images stained with picrosirius and photographed using a polarizer filter at 20× magnification represent collagen organization in the core area (1), endocardium (2), epicardium (3) and peripheral area (4).
The histological findings reported in the present study support current strategies applied in the invasive treatment of post‐infarction ventricular arrhythmias using catheter ablation. The fact that from a histological point of view the triggers of these potentially life‐threatening events are concentrated in the endocardium, epicardium and peripheral area implies that percutaneous ablative procedures (using intravascular or trans‐pericardial percutaneous ablation catheters) are feasible and the consequences in terms of myocardial loss are acceptable. Nevertheless, ablative treatment of the core area of the infarction would require a much more challenging procedure leading to the induction of severe transmural myocardial damage.
Beyond the potential implications in arrhythmias and for a better understanding of the ‘gray zone’, the different disposition of fibers in the myocardial areas could have potential effects on cardiac function and performance. Collagen deposition after MI plays has been described to play a key role in the mechanical properties of the scar (Holmes et al. 2005). Voorhees and Han have recently reported that not only collagen density but also collagen fiber orientation affects the scar tissue mechanics and therefore LV function. They observed, using a mathematical model, that longitudinal fiber alignment limits scar deformation and optimizes ejection fraction and stroke volume. In addition, they concluded that the better diastolic filling and systolic contraction is the result of increased compliance in the circumferential direction (Voorhees & Han, 2014). Thus, if the parallel alignment detected in the core of the infarct could be achieved in the whole infarcted area, beneficial effects in terms of systolic and diastolic performance could potentially be achieved after MI. However, this is only a hypothesis‐generating thought and further studies are needed to substantiate this idea as well as to develop the proper methods to obtain this objective.
Study limitations
The human samples analyzed in our study were obtained from autopsies. This could result in a bias in the results since this subset of patients may be representative of the more severe cases and thus may not reflect the usual process of scar formation.
As always in basic research, the translation to clinical practice should proceed with caution. The data obtained in the present work may lead to studies in humans which will replicate our results using non‐invasive imaging techniques.
Further studies that specifically address in‐depth the relationship between collagen disorganization within the fibrotic scar and post‐infarction ventricular arrhythmias or cardiac function are needed.
Concluding remarks
In chronic infarctions, collagen fibers are homogeneously organized in the core of the infarction and are randomly distributed in the endocardium, epicardium and peripheral area. Further studies are warranted to obtain a better understanding of the pathophysiological and clinical implications of these findings.
Conflict of interest
No conflict of interest exists in the present study.
Author contributions
Arantxa Hervas, Amparo Ruiz‐Sauri and Vicente Bodi have contributed to the conception and design of the study, acquisition of data, analysis and interpretation of data, the drafting of the manuscript and the final approval of the submitted manuscript. Elena de Dios, Maria Jose Forteza, Gema Minana, Julio Nunez, Cristina Gomez, Clara Bonanad, Nerea Perez‐Sole, Jose Gavara and Francisco Javier Chorro have contributed to acquisition of data, the critical revision of the manuscript for important intellectual content and the final approval of the submitted manuscript.
Supporting information
Fig. S1. Quantification of type I and type III collagen in myocardial samples of the swine model.
Acknowledgements
The present study was supported by the ‘Instituto de Salud Carlos III and FEDER’ (PI14/00271 grant) and the ‘Generalitat Valenciana’ (PROMETEO/2013/007 grant).
References
- Bodi V, Sanchis J, Mainar L, et al. (2010) Right ventricular involvement in anterior myocardial infarction: a translational approach. Cardiovasc Res 87, 601–608. [DOI] [PubMed] [Google Scholar]
- Bodi V, Sanchis J, Morales JM, et al. (2012) Metabolomic profile of human myocardial ischemia by nuclear magnetic resonance spectroscopy of peripheral blood serum: a translational study based on transient coronary occlusion models. J Am Coll Cardiol 59, 1629–1641. [DOI] [PubMed] [Google Scholar]
- van den Borne SW, Diez J, Blankesteijn WM, et al. (2010) Myocardial remodeling after infarction: the role of myofibroblasts. Nat Rev Cardiol 7, 30–37. [DOI] [PubMed] [Google Scholar]
- Fomovsky GM, Rouillard AD, Holmes JW (2012) Regional mechanics determine collagen fiber structure in healing myocardial infarcts. J Mol Cell Cardiol 52, 1083–1090. [DOI] [PMC free article] [PubMed] [Google Scholar]
- Gupta KB, Ratcliffe MB, Fallert MA, et al. (1994) Changes in passive mechanical stiffness of myocardial tissue with aneurysm formation. Circulation 89, 2315–2326. [DOI] [PubMed] [Google Scholar]
- Holmes JW, Borg TK, Covell JW (2005) Structure and mechanics of healing myocardial infarcts. Annu Rev Biomed Eng 7, 223–253. [DOI] [PubMed] [Google Scholar]
- Lerman RH, Apstein CS, Kagan HM, et al. (1983) Myocardial healing and repair after experimental infarction in the rabbit. Circ Res 53, 378–388. [DOI] [PubMed] [Google Scholar]
- Marcos‐Garcés V, Molina Aguilar P, Bea Serrano C, et al. (2014) Age‐related dermal collagen changes during development, maturation and ageing – a morphometric and comparative study. J Anat 225, 98–108. [DOI] [PMC free article] [PubMed] [Google Scholar]
- Mewton N, Liu CY, Croisille P, et al. (2011) Assessment of myocardial fibrosis with cardiovascular magnetic resonance. J Am Coll Cardiol 57, 891–903. [DOI] [PMC free article] [PubMed] [Google Scholar]
- Osman OS, Selway JL, Harikumar PE, et al. (2013) A novel method to assess collagen architecture in skin. BMC Bioinformatics 14, 260. [DOI] [PMC free article] [PubMed] [Google Scholar]
- Rich L, Whittaker P (2005) Collagen and Picrosirius red staining: a polarized light assessment of fibrillar hue and spatial distribution. Braz J Morphol Sci 22, 97–104. [Google Scholar]
- Roes SD, Borleffs CJ, van der Geest RJ, et al. (2009) Infarct tissue heterogeneity assessed with contrast‐enhanced MRI predicts spontaneous ventricular arrhythmia in patients with ischemic cardiomyopathy and implantable cardioverter‐defibrillator. Circ Cardiovasc Imaging 2, 183–190. [DOI] [PubMed] [Google Scholar]
- Schmidt A, Azevedo CF, Cheng A, et al. (2007) Infarct tissue heterogeneity by magnetic resonance imaging identifies enhanced cardiac arrhythmia susceptibility in patients with left ventricular dysfunction. Circulation 115, 2006–2014. [DOI] [PMC free article] [PubMed] [Google Scholar]
- Schuleri KH, Centola M, Evers KS, et al. (2012) Cardiovascular magnetic resonance characterization of peri‐infarct zone remodeling following myocardial infarction. J Cardiovasc Magn Reson 14, 24. [DOI] [PMC free article] [PubMed] [Google Scholar]
- Tsai MR, Chiu YW, Lo MT, et al. (2010) Second‐harmonic generation imaging of collagen fibers in myocardium for atrial fibrillation diagnosis. J Biomed Opt 15, 026002. [DOI] [PubMed] [Google Scholar]
- Voorhees AP, Han HC (2014) A model to determine the effect of collagen fiber alignment on heart function post myocardial infarction. Theor Biol Med Model 11, 6. [DOI] [PMC free article] [PubMed] [Google Scholar]
- Whittaker P, Boughner DR, Kloner RA (1989) Analysis of healing after myocardial infarction using polarized light microscopy. Am J Pathol 134, 879–893. [PMC free article] [PubMed] [Google Scholar]
- Whittaker P, Boughner DR, Kloner RA (1991) Role of collagen in acute myocardial infarct expansion. Circulation 84, 2123–2134. [DOI] [PubMed] [Google Scholar]
- Zhou X, Yun JL, Han ZQ, et al. (2011) Postinfarction healing dynamics in the mechanically unloaded rat left ventricle. Am J Physiol Heart Circ Physiol 300, 1863–1874. [DOI] [PMC free article] [PubMed] [Google Scholar]
- Zimmerman SD, Karlon WJ, Holmes JW, et al. (2000) Structural and mechanical factors influencing infarct scar collagen organization. Am J Physiol Heart Circ Physiol 278, 194–200. [DOI] [PubMed] [Google Scholar]
- Zipes DP, Camm AJ, Borggrefe M, et al. (2006) ACC/AHA/ESC 2006 guidelines for management of patients with ventricular arrhythmias and the prevention of sudden cardiac death: a report of the American College of Cardiology/American Heart Association Task Force and the European Society of Cardiology Committee for Practice Guidelines. Circulation 114, e385–e484. [DOI] [PubMed] [Google Scholar]
- van Zuijlen PP, de Vries HJ, Lamme EN, et al. (2002) Morphometry of dermal collagen orientation by Fourier analysis is superior to multi‐observer assessment. J Pathol 198, 284–291. [DOI] [PubMed] [Google Scholar]
Associated Data
This section collects any data citations, data availability statements, or supplementary materials included in this article.
Supplementary Materials
Fig. S1. Quantification of type I and type III collagen in myocardial samples of the swine model.


