

Abstract
Chronic renal disease is known to alter olfactory function, but the specific changes induced in olfactory organs during this process remain unclear. Of the uraemic toxins generated during renal disease, high levels of urea are known to induce hyposmic conditions. In this study, the effects of environmental exposure to elevated concentrations of urea (7, 13.5 and 20 g L−1) on the sensory mucosa of zebrafish in acute toxicity and chronic toxicity tests were described. It was observed that lamellae maintained structural integrity and epithelial thickness was slightly reduced, but only following exposure to the highest concentrations of urea. Pan‐neuronal labelling with anti‐Hu revealed a negative correlation with levels of urea, leading to investigation of whether distinct neuronal subtypes were equally sensitive. Using densitometric analysis of immunolabelled tissues, numbers of Gα olf‐, TRPC2‐ and TrkA‐expressing cells were compared, representing ciliated, microvillous and crypt neurons, respectively. The three neuronal subpopulations responded differently to increasing levels of urea. In particular, crypt cells were more severely affected than the other cell types, and Gα olf‐immunoreactivity was found to increase when fish were exposed to low doses of urea. It can be concluded that exposure to moderate levels of urea leads to sensory toxicity directly affecting olfactory organs, in accordance with the functional olfactometric measurements previously reported in the literature.
Keywords: Gα olf, neuroepithelium, PCNA, TrkA, TRPC2
Introduction
Olfaction is fundamental in mammals and vertebrates in general, in order to detect volatiles relevant to mating, food search and enemy avoidance. In humans, olfaction plays an important social and emotional role, and it is critical for the maintenance of good quality of life. In recent years, olfactory dysfunction has gained increasing attention, not only because it is a common age‐related disease, but also because it is correlated, as a secondary symptom, with a variety of pathologies. Olfactory impairments are not only caused by upper respiratory tract infections, inhaled vapours, sinonasal problems (Landis et al. 2004), brain lesions and neurodegenerative diseases, such as, for example, Alzheimer's disease (Nicola‐Antoniu, 2011), but also by general systemic pathologies, such as chronic kidney disease. Some studies have reported that in patients affected by end‐stage renal disease, the olfactory function was approximately 80% compared with healthy subjects (Landis et al. 2011); the reduced olfactory capacity, which contributes to uraemic anorexia, was limited to odour identification and discrimination (Griep et al. 1997; Frasnelli et al. 2002). It has been demonstrated that this dysfunction is reversible, as olfactory function improves after kidney transplantation (Griep et al. 1997). However, the effects of haemodialysis are contradictory: in some cases odour perception was either the same or worse immediately after artificial blood filtration (Griep et al. 1997), while more recent studies (Landis et al. 2011) reported that one haemodialysis session was sufficient to improve olfactory function. Therefore, it appears that high levels of some circulating uraemic toxins, which are reduced below a critical threshold after kidney transplantation or dialysis, are considered responsible for the hyposmic state in chronic renal failure. Potential uraemic toxins that affect olfaction have been proposed, and include urea, creatinine and/or serum phosphorus. Griep et al. (1997) found negative correlations between urea blood levels and smell perception, substantiating the potential toxicity of urea, even though other research did not confirm these data (Landis et al. 2011). To date, the exact origin of uraemia‐induced hyposmia remains unknown. With the exception of olfactometric analysis, no other examinations have been conducted, particularly histomorphological observations of the olfactory organ. Moreover, no studies to verify whether urea or other uraemic catabolites produce histopathological effects in the olfactory organ have been reported in the literature. The present study is the first to report the response of olfactory organ structure to urea exposure. Olfactory epithelium disruption and sensory neuron loss can be caused by direct exposure to a toxicant via inhalation (for a list of examples of olfactory toxicity in fish, see Tierney et al. 2010) and systemic inoculation: for example, intraperitoneal injections of the herbicide dichlobenil (Bergman et al. 2002; Franceschini et al. 2009, 2014) or the anti‐thyroid drug methimazole (Bergström et al. 2003) induce necrosis in the olfactory neuroepithelium. Even if hematic administration could better reproduce pathological conditions, as a first approach direct nasal exposure was opted for, to minimize potential systemic interference.
Among various vertebrates used as models for toxicity assessment, Danio rerio (zebrafish) possess numerous advantages (Hill et al. 2005), such as reduced housing costs and small size, which allows quantitative analysis on a limited number of slides. Danio rerio is considered a predictive model of mammalian toxicity as lethal concentrations of compounds directly administered into zebrafish water are comparable to those in the serum of experimental mammals (Kari et al. 2007). Moreover, the olfactory system of zebrafish, which is histologically similar to those of higher vertebrates, is largely described in the literature, and the composition of neuroepithelial sensory cells is immunologically well characterized (Germanà et al. 2007; Gayoso et al. 2011; Braubach et al. 2012). For these reasons, zebrafish was chosen as the model species in this research. The fish were treated with three doses of urea for three different time periods. Then, the effects of urea on the general morphology of the epithelium and possible alterations in the sensory cells subpopulations: ciliated, microvillar and crypt neurons, were evaluated.
Materials and methods
Animals
Fifty 6–8‐month‐old adult zebrafish, D. rerio (Hamilton, 1882), ~4 cm in length, were purchased locally from the Acquario Fossolo, Bologna, Italy. They were maintained in an aquarium for an acclimation period of 1 month at 25 °C in a 12/12 h light/dark cycle, and fed twice daily, 7 days per week, with commercial flake food.
Urea exposure
The fish were divided into a control group and nine treatment groups (n = 5 in each group). They were transferred to 8‐L tanks containing different concentrations of urea (Sigma Chemical, St Louis, MO, USA), dissolved in water taken from the aquarium. A static/renewal system was applied: every 48 h the fish were moved to new tanks containing freshly prepared solutions, and water parameters were monitored (see Table 1 for representative values). Urea olfactory toxicity was assessed after the standard periods of 48 and 96 h, commonly used in acute toxicity tests, and after 30 days of treatment to simulate chronic exposure. The US EPA ECOTOX database (http://cfpub.epa.gov/ecotox/) reported that the urea LC50 = 374 mmol L−1 (corresponding to ~22.5 g L−1) measured in zebrafish embryos exposed for 48 h; thus, in the present study, the sublethal doses of 7, 13.5 and 20 g L−1 were selected. The control group was killed after 30 days.
Table 1.
Water parameters of control tank before and after treatment with the highest urea concentration
| Water from | NO3 (mg L−1) | NO2 (mg L−1) | GH (dH) | KH (dH) | pH |
|---|---|---|---|---|---|
| Control tanks | < 30 | ~0.5 | 14–21° | 0–3° | 6.9–7.0 |
| 20 g L−1 tanks, before exposure | < 30 | < 5 | 14–21° | 3–6° | 7.4–7.5 |
| 20 g L−1 tanks, after 48 h of exposure | < 30 | < 5 | 14–21° | 6–10° | 7.3–7.4 |
These parameters were measured at water replacement and all measurements were included in these ranges.dH, degree of hardness; GH, general hardness; KH, carbonate hardness.
All procedures conformed to the guidelines of the European Communities Council Directive (86/609/CEE), current Italian legislation regarding the use and care of animals, and the guidelines of the US National Institute of Health. The Ethic‐Scientific Committee of the University of Bologna also approved this study (protocol no. 17‐79‐2014).
Tissue sampling
At the established endpoints, the fish were anaesthetized with 0.1% 3‐aminobenzoic acid ethyl ester (MS‐222; Sigma Chemical) and decapitated. After removal of the dorsal cranial vault, the heads were rapidly immersed in a modified Bouin solution (picric acid : formalin 3 : 1) for 24 h. The samples were washed in 0.1 m disodium phosphate buffer, pH 7.4, and then decalcified in 0.25 m ethylenediaminetetraacetic acid (EDTA; Fluka, Buchs, SG, Switzerland) in the same buffer for 7 days. The specimens were then embedded in Paraplast plus (Sherwood Medical, St Louis, MO, USA; mp 55–57 °C), horizontally sectioned (5 μm) with a Leitz 1516 microtome (Leica Microsystems Srl, Milan, Italy) and mounted on silanated slides.
Immunohistochemistry
For each antiserum, slides from control and treated specimens were processed at the same time to minimize differences in optical density (OD) caused by variable experimental conditions. A panel of six antibodies was used: monoclonal mouse anti‐PCNA (proliferating cell nuclear antigen; 1 : 500; P 8825, Clone PC10; Sigma Chemical), to detect dividing cells; monoclonal mouse anti‐HuC/D (human neuronal protein HuC/HuD; 1 : 100; A‐21271, Clone 16A11; Molecular Probes, Eugene, OR, USA), a nuclear marker of immature and mature neurons; polyclonal rabbit anti‐calretinin (1 : 1000; AB5054; Chemicon International, Temecula, CA, USA), detecting a heterogeneous population of ciliated and microvillous olfactory neurons; polyclonal rabbit anti‐Gα olf (1 : 500; sc‐385; Santa Cruz Biotechnology, Santa Cruz, CA, USA), a marker for ciliated olfactory neurons; polyclonal rabbit anti‐zTRPC2 (1 : 200; LS‐C95010; LifeSpan BioSciences, Seattle, WA, USA), a marker for microvillous olfactory neurons; polyclonal rabbit anti‐TrkA (1 : 100; sc‐118; Santa Cruz Biotechnology, TX, USA), a marker for crypt olfactory cells. One of 20 sections was processed for each antibody (four–five sections for each olfactory organ), except for PCNA and TrkA staining: in this case a pair of adjacent sections out of 20 was sampled to apply the physical disector technique. After deparaffinization and rehydration, the slides were immersed in 1% H2O2 (Sigma Chemical) for endogenous peroxidase saturation, and microwave treated (750 W for 10 min in citrate buffer at pH 6.0) for antigen retrieval. After blocking of non‐specific binding with 10% normal goat serum (NGS; Vector Laboratories, Burlingame, CA, USA) and 1% bovine serum agglutinin (BSA; Sigma Chemical), the sections were incubated in primary antibodies overnight at 4 °C. After washing, the samples were further incubated for 1 h 30 min in horseradish peroxidase (HRP)‐conjugated goat anti‐rabbit IgG (1 : 100) or HRP‐conjugated goat anti‐mouse IgG (1 : 100; Vector Laboratories). Finally, the antigenic sites were visualized with 0.1% 3,3‐diaminobenzidine substrate (DAB; Sigma Chemical). Light counterstaining with Gill's Haematoxylin was used to enhance the contrast, with the exception of anti‐PCNA‐incubated slides. Except for anti‐zTRPC2, specifically raised against zebrafish antigen, all other antibodies used in this work were previously tested by different authors on the zebrafish olfactory organ. Sections from the control group were used as positive controls. Negative controls were obtained by replacing the primary antibody with 10% NGS (data not shown).
Image acquisition, quantification and statistical analysis
An Olympus BH‐2 microscope (Olympus Italia, Segrate, Italy) and a BEL BlackL 5000 digital camera (BEL Engineering, Monza, Italy) were used to visualize and photograph sections. Adobe Photoshop (CS3; Adobe Systems, San Jose, CA, USA) was used to assemble the micrographs shown in the figures. They were resized, rotated and adjusted for brightness, contrast and colour balance, but the content was not altered. All images used for analysis were taken under the same illumination conditions and were not corrected.
All measurements were performed on semi‐serial sections using imagej 1.41o software, and were restricted to the sensory region of the lamellae (Fig. 1A), easily distinguished from non‐sensory regions by its staining patterns.
Figure 1.
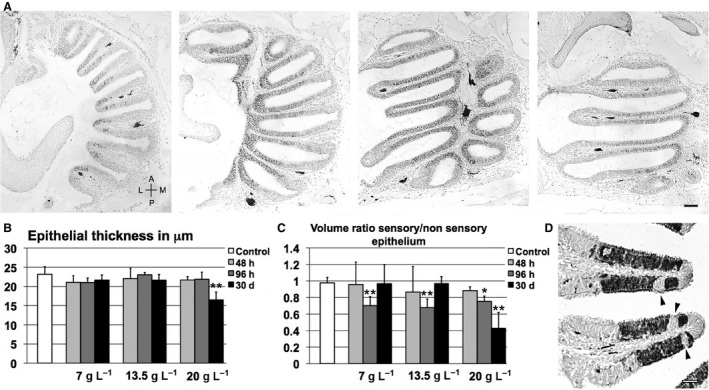
Morphological analysis of olfactory epithelium before and after treatment. (A) Semi‐serial horizontal Hu‐positive sections (separated by 100 μm) of untreated olfactory rosette at progressively more ventral planes. A, anterior; L, lateral; M, medial; P, posterior; scale bar: 50 μm. (B) Variations in epithelial thickness across treatments. (C) Comparison between volumes of sensory and non‐sensory regions in olfactory mucosa; significant differences are indicated by asterisks: *P < 0.05; **P < 0.01. (D) Calretinin‐positive lamellae in zebrafish treated with 7 g L−1 for 96 h; arrowheads: non‐sensory areas inserted in sensory epithelium; scale bar: 20 μm.
Epithelial thickness was measured from the basal lamina to the apical surface, excluding cilia. Sensory and non‐sensory epithelial areas were measured in calretinin‐immunolabelled sections because they were easily distinguishable (by virtue of both labelling and the presence of long cilia in the surface of non‐sensory areas); then, volumes were estimated using Cavalieri's principle (Severi et al. 2005). Three values for a lamella were obtained from three random lamellae in each section and averaged. TrkA‐positive and mitotic cells were counted using the Cell Counter plugin and following stereological analysis, as described in Bianchi et al. (2014). For quantification of HuC/D, Gα olf and TRPC2 immunostaining, because of the difficulty in counting positive cells (in particular, Gα olf and TRPC2 antigens are expressed in restricted cytoplasmic regions), immunostaining intensity was compared, which was used as an indirect index of the number of stained cells in a selected area. OD values were calculated using the method described by Iqbal & Byrd‐Jacobs (2010). Briefly, the Colour Deconvolution plugin was used for Haematoxylin and DAB separation; then, the micrographs were converted to eight‐bit grey‐scale and average grey values in the sensory region of three lamellae per section were obtained; background values were obtained from the non‐stained areas in the tissue. Finally, the following formula was applied:
OD = log (background grey value/ROI grey value) ROI, region of interest.
Mean values for each group were compared using anova and the LSD post hoc test. In the histograms, data were reported as mean values ± SD. OD values for negative controls = 0.013 ± 0.003.
Results
Following treatment with urea, macroscopic effects were not observed: no animals died before the end of the exposure period; the morphology of the olfactory organs was preserved, with no visible disruption of tissue integrity, metaplasia, hypertrophy of intra‐epithelial glands or other differences compared with control tissues.
Image analysis demonstrated that the olfactory epithelium thickness was unaltered, except in the case of fish exposed to the maximum dose of urea for 30 days (Fig. 1B), where epithelial depth was significantly reduced (−29%).
Even if the general structure of the sensory region was only minimally affected by urea, it was determined whether the population of olfactory cells underwent changes after treatment. A general alteration in the proportion between sensory and non‐sensory epithelium in the lamellae was pointed out by higher values of standard deviation in most groups of treated animals. In some cases the ratio between the volumes of the two adjacent epithelial regions sensibly decreased, especially in fish exposed to 20 g L−1 urea for 30 days (–55%; Fig. 1C). In some cases, calretinin labelling, strongly evident in soma and dendrites of various olfactory neurons, showed that sensory regions were fragmented by little immunonegative areas apparently devoid of olfactory cells (Fig. 1D). Furthermore, Hu‐labelling levels were slightly decreased when the dose of urea increased (Fig. 2), and the lowest values were noted for the groups exposed to 13.5 g L−1 for 48 h (−22%), 20 g L−1 for 48 h (−20%), 20 g L−1 for 96 h (−20%) and 20 g L−1 for 30 days (–40%). No significant changes were observed at 7 g L−1.
Figure 2.
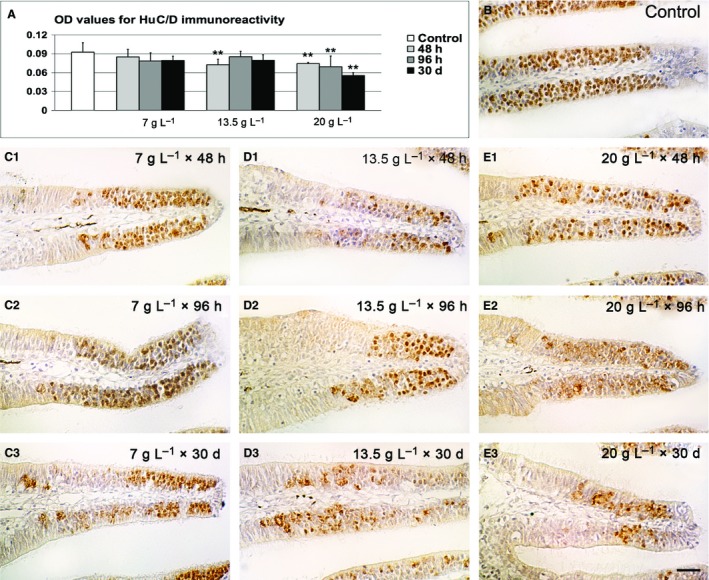
HuC/D immunohistochemistry. (A) Densitometric analysis and comparison between controls and treatments. (B) Representative micrograph of control tissue. (C1–3) Representative micrographs of lamellae exposed to 7 g L−1 of urea. (D1–3) Representative micrographs of lamellae exposed to 13.5 g L−1 of urea. (E1–3) Representative micrographs of lamellae exposed to 20 g L−1 of urea. Significant differences compared with controls are indicated by asterisks: **P < 0.01. Scale bar: 20 μm. OD, optical density.
The same digital image processing was adopted to investigate the responses of the three subpopulations of olfactory sensory cells. Gα olf labelling was mainly localized at the apical knobs, but also present in other cytoplasmic areas (Fig. 3B). Even when the values were not statistically different from the control, immunoreactivity appeared dishomogeneous among the different groups of zebrafish (Fig. 3). In particular, it varied significantly over time at all doses, at times increasing (+69% between 48 and 96 h at 7 g L−1, and +66% between 96 h and 30 days at 13.5 g L−1), and at times decreasing (between 96 h and 30 days at 20 g L−1). At the highest concentration, some non‐sensory cells, characterized by longer cilia, replaced olfactory neurons (Fig. 3F3).
Figure 3.
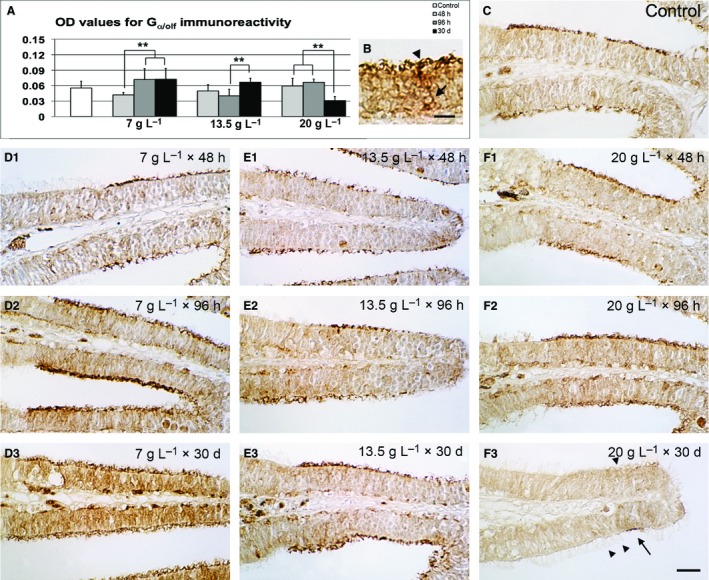
Gα olf immunohistochemistry. (A) Densitometric analysis and comparison between controls and treatments. (B) Detail of control epithelium at high magnification; arrow: labelled cell body in the basal layer; arrowhead: Gα olf‐positive olfactory knob. Scale bar: 10 μm. (C) Representative micrograph of control tissue. (D1–3) Representative micrographs of lamellae exposed to 7 g L−1 of urea. (E1–3) Representative micrographs of lamellae exposed to 13.5 g L−1 of urea. (F1–3) Representative micrographs of lamellae exposed to 20 g L−1 of urea. Arrowheads: ciliated non‐sensory cells; arrow: Gα olf‐positive cells. Significant differences are indicated by asterisks: **P < 0.01. Scale bar: 20 μm. OD, optical density.
TRPC2‐positive elements were strongly labelled by antiserum in the dendrite endings and apical knobs (Fig. 4B). In this case, fish treated with intermediate and highest doses of urea showed a significant reduction of labelling intensity, while 7 g L−1 of urea caused almost no changes (Fig. 4).
Figure 4.

TRPC2 immunohistochemistry. (A) Densitometric analysis and comparison between controls and treatments. (B) Detail of control epithelium at high magnification; arrows: labelled dendrites. Scale bar: 10 μm. (C) Representative micrograph of control tissue; arrowhead: non‐sensory epithelium. (D1–3) Representative micrographs of lamellae exposed to 7 g L−1 of urea. (E1–3) Representative micrographs of lamellae exposed to 13.5 g L−1 of urea. (F1–3) Representative micrographs of lamellae exposed to 20 g L−1 of urea. Significant differences compared with controls are indicated by asterisks: *P < 0.05; **P < 0.01. Scale bar: 20 μm. OD, optical density.
Finally, crypt cells, labelled with anti‐TrkA, were the subpopulation that changed more after urea exposure (Fig. 5). Crypt cells are dishomogeneously distributed, and their number is lower than those of ciliated and microvillar cells. For this reason, it was preferred to estimate their density through cell counting. In all treatments, comprising the exposure to 7 g L−1, a sensible cell decrement after 96 h (~22–55%) was registered, compared with the control group. Moreover, at the dose of 20 g L−1 the number of crypt cells was always less than 55% of control, with a negative peak of 28% after 30 days of exposure.
Figure 5.

TrkA immunohistochemistry. (A) Density of crypt cells and comparison between controls and treatments. (B) Detail of control epithelium at high magnification; arrowheads: TrkA‐positive crypt cells in the apical layer. Scale bar: 10 μm. (C) Representative micrograph of control tissue. (D1–3) Representative micrographs of lamellae exposed to 7 g L−1 of urea. (E1–3) Representative micrographs of lamellae exposed to 13.5 g L−1 of urea. (F1–3) Representative micrographs of lamellae exposed to 20 g L−1 of urea. Significant differences compared with controls are indicated by asterisks: *P < 0.05; **P < 0.01. Scale bar: 20 μm.
Following damage to the olfactory epithelium, recovery of the sensory cell population is commonly triggered by an upregulation of proliferative response. The number of mitotic elements after each treatment was examined by counting PCNA‐positive cells in the lamellar sensory regions (Fig. 6). Statistical analysis of the data revealed no significant differences between the control and treatment groups, even if a trend towards an increase in some groups was observed.
Figure 6.
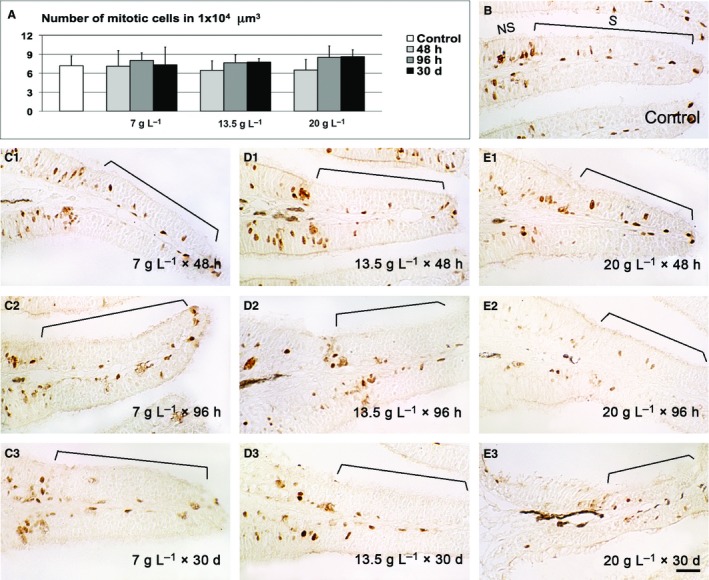
PCNA immunohistochemistry. (A) Density of dividing cells and comparison between controls and treatments. (B) Representative micrograph of control tissue. (C1–3) Representative micrographs of lamellae exposed to 7 g L−1 of urea. (D1–3) Representative micrographs of lamellae exposed to 13.5 g L−1 of urea. (E1–3) Representative micrographs of lamellae exposed to 20 g L−1 of urea. NS, non sensory epithelium; S, sensory epithelium. Scale bar: 20 μm.
Discussion
Of the nitric compounds, urea is considered to be non‐toxic (Ertell, 2006), based on the LC50 measured in mammals after different routes of administration (oral, intraperitoneal, subcutaneous and intravenous injections). No studies on inhaled urea in experimental animals have been identified. In addition, the LC50 reported for zebrafish fertilized eggs in the US EPA ECOTOX database is high compared with other nitric compounds, such as ammonia. The current experimental data confirm the low toxicity of urea, as a 100% survival rate was observed in all treatment groups, even at the highest concentration. The lethal effects of uraemic compounds appear to be associated with a fraction of the > 50‐kDa molecules, as observed in zebrafish embryos exposed to the serum of pre‐dialysis patients (Berman et al. 2013).
In the olfactory epithelial morphology of zebrafish treated with urea, no evident effects were observed, such as hyperplasia of mucous cells, cell death with loss of cytoplasmic connections, damage to the apical surface and basal lamina disruption, normally described after heavy metals (Bettini et al. 2006a,b; Roy et al. 2013; Ghosh & Mandal, 2014) and detergent (Iqbal & Byrd‐Jacobs, 2010) sublethal exposure. Also epithelial thickening, due to basal cell hyperplasia (Ghosh & Mandal, 2014), was not detected. On the contrary, in fish exposed to 20 g L−1 for 1 month the epithelium was thinner.
Various studies conducted in mice (Suzuki et al. 1998) and fish (Cancalon, 1983; Julliard et al. 1996; Bettini et al. 2006a,b) have reported that cytotoxic xenobiotics, when administered at marginally toxic concentrations, induce specific degeneration of mature and immature olfactory neurons, and the other cell types that constitute the epithelium remain intact.
However, all these studies provided only qualitative descriptions of ultrastructural phenotypes, histological and/or immunohistochemical alterations and visual comparison with control tissues. As minimal differences between urea‐treated and non‐treated zebrafish were observed, a quantification approach was necessary. Digital image analysis was opted for as it can be used in all types of immunohistochemical staining and is concordant with semiquantitative evaluation, but more sensitive in discriminating similar values (de Matos et al. 2006). The experimental procedure described by Iqbal & Byrd‐Jacobs (2010) was followed to quantitate the populations of olfactory neurons, even if it is known that immunohistochemistry does not give a direct measure of the number of olfactory cells. HuC/D exclusively characterizes neuronal cells from an early developmental stage, as it is expressed immediately after mitosis (Kim et al. 1996). It was observed that the immunoreactivity of Hu‐positive cells was not significantly influenced by urea at the lowest concentration, but at higher doses decreased labelling was observed. Because neurons appeared to be moderately sensitive to urea, it was investigated whether the three subpopulations of olfactory cells responded in the same way. Selected markers previously cited in the literature were used. Unlike the protocol followed by Iqbal & Byrd‐Jacobs (2010), TRPC2 was opted for as marker for microvillous cells, as it is more selective than calretinin (Sato et al. 2005). Although various studies refer to calretinin as a marker of microvillous olfactory neurons in zebrafish (Duggan et al. 2008; Koide et al. 2009; Iqbal & Byrd‐Jacobs, 2010), recent publications have demonstrated that calretinin is mostly expressed by ciliated cells (Castro et al. 2006, 2008; Gayoso et al. 2011). Recently, also the specificity of S100 has become controversial: even if it is commonly considered a highly specific marker for crypt cells, some authors showed that S100 antibody labelled, in zebrafish (Gayoso et al. 2011; Ahuja et al. 2013) and guppy (Bettini et al. 2009, 2012), some microvillous‐like cells, especially in fixed tissue. S100‐positive cells localized in the intermediate rather than the apical layer were shown also by Iqbal & Byrd‐Jacobs (2010), but the authors did not discuss their unusual position. For this reason, TrkA was opted for as marker for crypt cells, whose specificity was described by Catania et al. (2003) and Ahuja et al. (2013).
It was found that the three subpopulations responded differently during treatment, even when a common reduction in neurons was evident at the highest concentration of urea after exposure for 1 month. In particular, TrkA‐immunolabelling showed significant cell loss during acute exposure at urea minimal dose, suggesting that crypt neurons were more sensitive to urea, probably due to their more apical and exposed position. Also, microvillous cells appeared to decrease after prolonged‐ and high‐dose treatments. The significant decrement of epithelial thickness observed after 30 days of exposure to 20 g L−1 urea is certainly caused by cell loss, probably a combination of microvillous and crypt cells. Interestingly, at the lowest concentration of urea, Gα olf staining increased after 48 h. Olfactory tissue usually responds to induced lesions with a wave of new olfactory cells genesis (Bettini et al. 2006a,b; Iqbal & Byrd‐Jacobs, 2010), promoted by an increased rate of cell proliferation. However, in urea‐treated zebrafish the number of basal mitotic elements did not significantly change, as also indirectly indicated by the constant immunoreactivity levels of Hu‐positive neurons at the same dose. The possibility cannot be excluded that the recorded differences of Gα olf staining were independent of cell number, and may have been due to other morphological causes, for example variations in cell size. An intensified immunoreactivity for Gα olf was reported also in zebrafish embryos exposed to urea (Ferrando et al. 2014): the authors suggested that urea alters Gα olf synthesis or degradation. It is known that a basal rate of Gα olf degradation is normally present in the striatum of mammals (Hervè et al. 2001), and could be influenced by neurochemical environment or mutations. It is not surprising that distinct groups of olfactory neurons have different sensitivity to toxicants: the herbicide, dichlobenil, when administered at low doses (30 mg kg−1) is known to induce permanent loss of olfactory neurons exclusively localized in the dorsomedial sensory mucosa of mice (Bergman et al. 2002; Franceschini et al. 2009, 2014).
The number of dividing cells in the present study was statistically constant, without significant differences between treatments and control. It is possible that other cell types, perhaps ciliated non‐sensory cells, more resistant to urea, substituted olfactory neurons after prolonged treatment. This hypothesis is supported by the documented variation in the ratio between volumes of sensory and non‐sensory regions in some treated groups, and in particular in fish exposed to 20 g L−1 for 30 days. As a consequence, epithelial integrity was preserved, but the original cell composition was modified. A similar event was observed also after dichlobenil inoculation (Bergman et al. 2002), while the mitotic rate was unaltered in the damaged area (Franceschini et al. 2014). Perhaps some toxicants could affect neuronal differentiation more than basal cell proliferation, directing immature elements towards other non‐sensory types.
Interestingly, uraemic olfactory impairment measured in patients with chronic renal disease seems to be restricted to the ability to discriminate and identify odours, whereas odour thresholds are mainly unaffected (Frasnelli et al. 2002). It has been hypothesized that uraemic hyposmia has a central nervous system origin (Landis et al. 2011), because a critical number of bulbar granule cells is crucial only for odour discrimination (Gheusi et al. 2000). Another possible cause could be an alteration in the normal ratio of olfactory neuron subtypes, because the olfactory system is based on a combinatorial receptor coding scheme to identify odours (Malnic et al. 1999): if the number of cells expressing specific receptors decreases, the sensory patterns in which they are involved could be completely changed. Thus, with this perspective in mind, the current results appear pertinent.
Even if the experimental design provided for exposure to environmental urea only, it is necessary to consider urea uptake via gills and/or skin. Moreover, it was demonstrated that phloretin (an inhibitor of urea transporters that mimes high external urea concentration) exposure increases tissue levels of urea, even if a compensatory mechanism is activated (Braun et al. 2009). Both these possibilities may suggest that also a systemic exposure could have contributed to the results.
Conclusion
The current study indicated that the impact of urea on the histology of zebrafish olfactory organ was moderate. The toxic effects of short‐term exposure were minimal, and were mainly evident following chronic treatment at the highest concentration. The three examined subpopulations of olfactory neurons showed different responses and degrees of sensitivity. The current data are in line with the hypothesis that urea, exceeding physiological values for prolonged times, could alter olfactory function in uraemic patients. The authors are now interested in examining whether systemic inoculation of urea produces similar modifications in the olfactory epithelium.
Funding
This work was supported by grants from the Italian Ministry of University and Research (grant numbers RFO09FRANC, RFO10FRANC5).
Conflict of interest
The authors declare that they have no conflict of interest.
Author contributions
Simone Bettini: conception and design, collection and assembly of data, data analysis and interpretation, manuscript writing; Maurizio Lazzari: data analysis and interpretation; Sara Ferrando and Lorenzo Gallus: conception and design, data analysis and interpretation; Valeria Franceschini: conception and design, data analysis and interpretation, manuscript writing.
References
- Ahuja G, Ivandic I, Saltürk M, et al. (2013) Zebrafish crypt neurons project to a single, identified mediodorsal glomerulus. Sci Rep 3, 1–9. [DOI] [PMC free article] [PubMed] [Google Scholar]
- Bergman U, Ostergren A, Gustafson AL, et al. (2002) Differential effects of olfactory toxicants on olfactory regeneration. Arch Toxicol 76, 104–112. [DOI] [PubMed] [Google Scholar]
- Bergström U, Giovannetti A, Piras E, et al. (2003) Methimazole‐induced damage in the olfactory mucosa: effects on ultrastructure and glutathione levels. Toxicol Pathol 31, 379–387. [DOI] [PubMed] [Google Scholar]
- Berman N, Lectura M, Thurman JM, et al. (2013) A zebrafish model for uremic toxicity: role of the complement pathway. Blood Purif 35, 265–269. [DOI] [PMC free article] [PubMed] [Google Scholar]
- Bettini S, Ciani F, Franceschini V (2006a) Cell proliferation and growth‐associated protein 43 expression in the olfactory epithelium in Poecilia reticulata after copper solution exposure. Eur J Histochem 50, 141–146. [PubMed] [Google Scholar]
- Bettini S, Ciani F, Franceschini V (2006b) Recovery of the olfactory receptor neurons in the African Tilapia mariae following exposure to low copper level. Aquat Toxicol 76, 321–328. [DOI] [PubMed] [Google Scholar]
- Bettini S, Lazzari M, Ciani F, et al. (2009) Immunohistochemical and histochemical characteristics of the olfactory system of the guppy, Poecilia reticulata (Teleostei, Poecilidae). Anat Rec 292, 1569–1576. [DOI] [PubMed] [Google Scholar]
- Bettini S, Lazzari M, Franceschini V (2012) Quantitative analysis of crypt cell population during postnatal development of the olfactory organ of the guppy, Poecilia reticulata (Teleostei, Poecilidae), from birth to sexual maturity. J Exp Biol 215, 2711–2715. [DOI] [PubMed] [Google Scholar]
- Bianchi P, Bettini S, Guidi S, et al. (2014) Age‐related impairment of olfactory bulb neurogenesis in the Ts65Dn mouse model of Down syndrome. Exp Neurol 251, 1–11. [DOI] [PubMed] [Google Scholar]
- Braubach OR, Fine A, Croll RP (2012) Distribution and functional organization of glomeruli in the olfactory bulbs of zebrafish (Danio rerio). J Comp Neurol 520, 2317–2339. [DOI] [PubMed] [Google Scholar]
- Braun MH, Steele SL, Perry SF (2009) The responses of zebrafish (Danio rerio) to high external ammonia and urea transporter inhibition: nitrogen excretion and expression of rhesus glycoproteins and urea transporter proteins. J Exp Biol 212, 3846–3856. [DOI] [PubMed] [Google Scholar]
- Cancalon P (1983) Influence of a detergent on the catfish olfactory mucosa. Tissue Cell 15, 245–258. [DOI] [PubMed] [Google Scholar]
- Castro A, Becerra M, Manso MJ, et al. (2006) Calretinin immunoreactivity in the brain of the zebrafish, Danio rerio: distribution and comparison with some neuropeptides and neurotransmitter‐synthesizing enzymes. I. Olfactory organ and forebrain. J Comp Neurol 494, 435–459. [DOI] [PubMed] [Google Scholar]
- Castro A, Becerra M, Anadón R, et al. (2008) Distribution of calretinin during development of the olfactory system in the brown trout, Salmo trutta fario: comparison with other immunohistochemical markers. J Chem Neuroanat 35, 306–316. [DOI] [PubMed] [Google Scholar]
- Catania S, Germana A, Laura R, et al. (2003) The crypt neurons in the olfactory epithelium of the adult zebrafish express TrkA‐like immunoreactivity. Neurosci Lett 350, 5–8. [DOI] [PubMed] [Google Scholar]
- Duggan CD, DeMaria S, Baudhuin A, et al. (2008) Foxg1 is required for development of the vertebrate olfactory system. J Neurosci 28, 5229–5239. [DOI] [PMC free article] [PubMed] [Google Scholar]
- Ertell K (2006) A Review of Toxicity and Use and Handling Considerations for Guanidine, Guanidine Hydrochloride, and Urea. Springfield: Battelle Memorial Institute Pacific Northwest National Laboratory, US Department of Commerce. [Google Scholar]
- Ferrando S, Gallus L, Gambardella C, et al. (2014) Effects of urea on the molecules involved in the olfactory signal transduction: a preliminary study on Danio rerio . Fish Physiol Biochem 40, 1793–1800. [DOI] [PubMed] [Google Scholar]
- Franceschini V, Bettini S, Pifferi S, et al. (2009) Human cord blood CD133+ stem cells transplanted to Nod‐Scid mice provide conditions for regeneration of olfactory neuroepithelium after permanent damage induced by dichlobenil. Stem Cells 27, 825–835. [DOI] [PubMed] [Google Scholar]
- Franceschini V, Bettini S, Pifferi S, et al. (2014) Transplanted human adipose tissue derived stem cells engraft and induce regeneration in mice olfactory neuroepithelium in response to dichlobenil subministration. Chem Senses 39, 617–629. [DOI] [PubMed] [Google Scholar]
- Frasnelli JA, Temmel AF, Quint C, et al. (2002) Olfactory function in chronic renal failure. Am J Rhinol 16, 275–279. [PubMed] [Google Scholar]
- Gayoso JA, Castro A, Anadòn R, et al. (2011) Differential bulbar and extrabulbar projections of diverse olfactory receptor neuron populations in the adult zebrafish (Danio rerio). J Comp Neurol 519, 247–276. [DOI] [PubMed] [Google Scholar]
- Germanà A, Paruta S, Germanà GP, et al. (2007) Differential distribution of S100 protein and calretinin in mechanosensory and chemosensory cells of adult zebrafish (Danio rerio). Brain Res 1162, 48–55. [DOI] [PubMed] [Google Scholar]
- Gheusi G, Cremer H, McLean H, et al. (2000) Importance of newly generated neurons in the adult olfactory bulb for odor discrimination. Proc Natl Acad Sci USA 97, 1823–1828. [DOI] [PMC free article] [PubMed] [Google Scholar]
- Ghosh D, Mandal DK (2014) Mercuric chloride induced toxicity responses in the olfactory epithelium of Labeo rohita (Hamilton): a light and electron microscopy study. Fish Physiol Biochem 40, 83–92. [DOI] [PubMed] [Google Scholar]
- Griep MI, Van der Niepen P, Sennesael JJ, et al. (1997) Odour perception in chronic renal disease. Nephrol Dial Transplant 12, 2093–2098. [DOI] [PubMed] [Google Scholar]
- Hervè D, Le Moine C, Corvol JC, et al. (2001) Gαolf levels are regulated by receptor usage and control dopamine and adenosine action in the striatum. J Neurosci 21, 4390–4399. [DOI] [PMC free article] [PubMed] [Google Scholar]
- Hill AJ, Teraoka H, Heideman W, et al. (2005) Zebrafish as a model vertebrate for investigating chemical toxicity. Toxicol Sci 86, 6–19. [DOI] [PubMed] [Google Scholar]
- Iqbal T, Byrd‐Jacobs C (2010) Rapid degeneration and regeneration of the zebrafish olfactory epithelium after Triton X‐100 application. Chem Senses 35, 351–361. [DOI] [PMC free article] [PubMed] [Google Scholar]
- Julliard AK, Saucier D, Astic L (1996) Time‐course of apoptosis in the olfactory epithelium of rainbow trout exposed to a low copper level. Tissue Cell 28, 367–377. [DOI] [PubMed] [Google Scholar]
- Kari G, Rodeck U, Dicker AP (2007) Zebrafish: an emerging model system for human disease and drug discovery. Clin Pharmacol Ther 82, 70–80. [DOI] [PubMed] [Google Scholar]
- Kim CH, Ueshima E, Muraoka O, et al. (1996) Zebrafish elav/HuC homologue as a very early neuronal marker. Neurosci Lett 216, 109–112. [DOI] [PubMed] [Google Scholar]
- Koide T, Miyasaka N, Morimoto K, et al. (2009) Olfactory neural circuitry for attraction to amino acids revealed by transposon‐mediated gene trap approach in zebrafish. Proc Natl Acad Sci USA 106, 9884–9889. [DOI] [PMC free article] [PubMed] [Google Scholar]
- Landis BN, Konnerth CG, Kummel T (2004) A study on the frequency of olfactory dysfunction. Laryngoscope 114, 1764–1769. [DOI] [PubMed] [Google Scholar]
- Landis BN, Marangon N, Saudan P, et al. (2011) Olfactory function improves following hemodialysis. Kidney Int 80, 886–893. [DOI] [PubMed] [Google Scholar]
- Malnic B, Hirono J, Sato T, et al. (1999) Combinatorial receptor codes for odors. Cell 96, 713–723. [DOI] [PubMed] [Google Scholar]
- de Matos LL, Stabenow E, Tavares MR, et al. (2006) Immunohistochemistry quantification by a digital computer‐assisted method compared to semiquantitative analysis. Clinics 61, 417–424. [DOI] [PubMed] [Google Scholar]
- Nicola‐Antoniu I (2011) Olfactory dysfunctions in Alzheimer's disease In: The Clinical Spectrum of Alzheimer's Disease – The Charge Toward Comprehensive Diagnostic and Therapeutic Strategies. (ed. De La Monte S.), pp. 127–144. InTech. [Google Scholar]
- Roy D, Ghosh D, Mandal DK (2013) Cadmium induced histopathology in the olfactory epithelium of a snakehead fish, Channa punctatus (Bloch). Int J Aquat Biol 1, 221–227. [Google Scholar]
- Sato Y, Miyasaka N, Yoshihara Y (2005) Mutually exclusive glomerular innervation by two distinct types of olfactory sensory neurons revealed in transgenic zebrafish. J Neurosci 25, 4889–4897. [DOI] [PMC free article] [PubMed] [Google Scholar]
- Severi S, Guidi S, Ciani E, et al. (2005) Sex differences in the stereological parameters of the hippocampal dentate gyrus of the guinea‐pig before puberty. Neuroscience 132, 375–387. [DOI] [PubMed] [Google Scholar]
- Suzuki Y, Takeda M, Obara N, et al. (1998) Colchicine‐induced cell death and proliferation in the olfactory epithelium and vomeronasal organ of the mouse. Anat Embryol (Berl) 198, 43–51. [DOI] [PubMed] [Google Scholar]
- Tierney KB, Baldwin DH, Hara TJ, et al. (2010) Olfactory toxicity in fishes. Aquat Toxicol 96, 2–26. [DOI] [PubMed] [Google Scholar]