Abstract
Purpose: This meta-analysis aimed to evaluate the performance of diffusion-weighted magnetic resonance imaging (DWI) in identification of colorectal cancer. Methods: A systematic literature search was performed for studies that evaluated the diagnostic accuracy of DWI in identification of colorectal cancer. Methodological quality was assessed by Quality Assessment for Studies of Diagnostic Accuracy 2 (QUADAS 2) tool. After extracting data, we estimated the pooled sensitivity, specificity, likelihood ratios, and constructed summary receiver operating characteristics (SROC) curve. Results: Ten studies involving 367 malignant lesions and 178 benign lesions were considered eligible after full-text review. The pooled sensitivity and specificity were 0.95 (95% CI: 0.90-0.97) and 0.93 (95% CI: 0.85-0.97), respectively. Positive likelihood ratio and negative likelihood ratio were 12.8 (95% CI: 5.99-27.4) and 0.06 (95% CI: 0.03-0.11), respectively. The area under SROC curve was 0.98. Conclusions: Our meta-analysis indicates that DWI is a highly accurate diagnostic method in identification of colorectal cancer.
Keywords: MRI, diffusion magnetic resonance imaging, colorectal cancer, meta-analysis
Introduction
Colorectal cancer is the fourth leading cause of cancer-related death in both men and women all around the world [1]. It is most likely to occur amoung people over 40 years old and the prevalence of colorectal cancer is increasing steadily due to changes of lifestyles, especially in developing countries [2]. It is especially meaningful to detect lesions in the early stage, because early diagnosis of colorectal cancer associated with a much better prognosis for colorectal cancer therapy [3].
Various modalities, such as enteroscope biopsy, computed tomography (CT), and magnetic resonance imaging (MRI) have been used to detect colorectal lesions [4-6]. Although colonoscopy is an essential method for detecting colorectal cancer, it has many disadvantages. It is an invasive examination and need a long period of preparation before examination which may make patients receiving the examination uncomfortable. Besides, enteroscope biopsy also induces several complications, including bleeding, enterobrosis and tumor seeding. MRI seems to be a promising alternative for these investigations because there is no risk of radiation exposure, and no need for patient preparation as stated in ESGAR guidelines [7], and it is noninvasive. MRI has high resolution for soft tissues and can show the anatomic relationship clearly.
DWI was used to evaluate cerebral infarction in the acute stage initially. Recent years, DWI has emerged as a new diagnostic tool in different areas of radiology, particularly in the differentiation between malignant and benign diseases in the abdominal region. It is based on the principle of measuring the microscopic movements of water molecules in human tissues. Malignant tumors are composed of tumor cells that are randomly organized and form a dense mass. This structure characteristics prevents the free movement of water molecules and creates diffusion restriction. Signal changes occur with the increased or limited diffusion movements of water molecules. Apparent diffusion coefficient can be calculated using this method and is quantitative measurement of diffusion ability [8]. Studies show that malignant tumors have statistically significantly lower ADC values than benign tumors. It has been reported that DWI has a high accuracy in diagnosis of prostate cancer [9], lung cancer [10], and bone marrow infiltration [11]. It is useful in preoperative staging and predicting response to neoadjuvant therapy in colorectal cancer [12,13].
Some studies have shown that DWI could be an alternative imaging modality for initial detection of malignant tumors in the gastrointestinal region [14-18]. However, in the previous studies, the diagnostic performance of DWI in identification of colorectal cancer varied because of some factors such as field intensity, disease staging, lesion size, pathological type and so on. The sensitivity and specificity ranged from 82% to 100% and 65% to 100%, respectively. It still remains uncertain whether DWI is feasible for identification of colorectal cancer. Therefore, we performed this meta-analysis to systemically review the diagnostic value of DWI in identification of colorectal cancer.
Materials and methods
Search strategy
Our meta-analysis followed the Preferred Reporting Items for Systematic Reviews and Meta-Analyses (PRISMA) recommendations. A comprehensive literature search of studies on human subjects was performed by two reviewers to identify articles about the diagnostic performance of DWI in detection of patients with colorectal cancer. PubMed and Embase were searched with the terms “diffusion weighted imaging [MeSH] or DWI [MeSH]” and “colorectal neoplasms [MeSH] or colorectal cancer or colorectal lesions or colon [MeSH] or rectum [MeSH]”. The latest search date was May 11, 2015, and there was no publication year limitation.
Eligibility criteria and study selection
Two investigators who were blinded to the journal, author, author’s affiliations and date of publication independently reviewed abstracts of all search results. The full-texts of eligible articles were subsequently retrieved for detailed reading. Studies were included if they met the following criteria: (a). DWI was conducted to diagnose colorectal cancer; (b). lesions were confirmed by pathologic findings (surgery specimens or endoscopic biopsy); (c). sufficient informations were available for calculation of the true-positive (TP), false-positive (FP), false-negative (FN), and true-negative (TN) values on a per-lesion basis; (d). the study population was no less than 10 patients. Studies were excluded if results were combination of different imaging modalities and data about a single modality could not be extracted.
Data collection and quality assessment
To perform this meta-analysis, the following data were extracted from each study: examination results, author, year of publication, country of origin, number and age of subjects, b values, techniques, and MRI field strength. Disagreements between the two reviewers were resolved by majority opinion after a third reviewer assessed all involved items. For each study, the published values for TP, FP, TN, FN, sensitivity, specificity, PLR, NLR, and diagnostic odds ratios were extracted. Results of TP, FP, TN, FN for the detection of colorectal cancer were extracted on a per-lesion basis. Eligible data were used to construct 2×2 contingency tables directly, with TP, FP, TN, FN results. In addition, a new method to extract the eligible data mentioned previously is applied in the diagnostic meta-analysis to improve the quantity of included studies and the amount of samples [19]. If both kinds of data were not available, we would contact the corresponding authors to ask for the detailed data. The study would be excluded without authors’ reply.
The methodological quality of the included studies was assessed by two independent observers using the QUADAS 2 tool for systematic reviews of diagnostic test accuracy [20].
Statistical analysis
Data extracted from each individual studies were used to construct 2×2 contingency tables, with the TP, FP, TN, FN values. The pooled summary sensitivity and specificity were estimated. PLR and NLR were derived as functions of these summary estimates. To explore heterogeneity, the Q statistic and the inconsistency index (I2) were obtained [21,22]. If heterogeneity was not significant, the pooled analysis was performed using the fixed effects model. On the opposite condition, the random effects model was adopted [23]. The pooled sensitivity and specificity were calculated from individual studies with 95% CI. The SROC curve was constructed using the derived estimates of sensitivity and specificity. The area under the SROC curve (AUC) is used as evaluation of diagnostic ability of a test [24,25]. Spearman correlation coefficient between the log (sensitivity) and log (1-specificity) was used to measure the threshold effect. Besides, threshold effect could be detected by plotting sensitivity and specificity on a ROC plane, the curve would have a typical pattern of “should-arm” shape with the existing of it. If threshold effect existed, it is better to evaluate the accuracy of diagnostic test by fitting a SROC curve rather than pooling sensitivity and specificity. Subgroup analyses were also performed using single-factor meta-regression analysis. Publication bias was assessed visually by using Deeks’ funnel plot asymmetry tests, which is a scatter plot of the inverse of the square root of the effective sample size (1/ESS1/2) versus the diagnostic log odds ratio. The non-zero slope coefficient was indicative of publication bias [26]. P values of less than 0.05 were considered to be statistically significant. The statistical computations described above were performed using Stata/SE statistical software Version 12.0 (StataCorp LP, College Station, TX, USA).
Results
The preliminary literature research included 203 potential article citations (Figure 1). One-hundred and thirty five of these studies were immediately excluded based on non-relevant, not being clinical trials, or publication in languages other than English or Chinese. Full-text of the remaining 68 articles were downloaded for detailed reading. 58 articles were excluded after the full-text reading. Finally, 10 published studies were included according to the inclusion and exclusion criteria [14-18,27-31]. The study design characteristics were evaluated with the QUADAS 2 tool (Figure 2).
Figure 1.
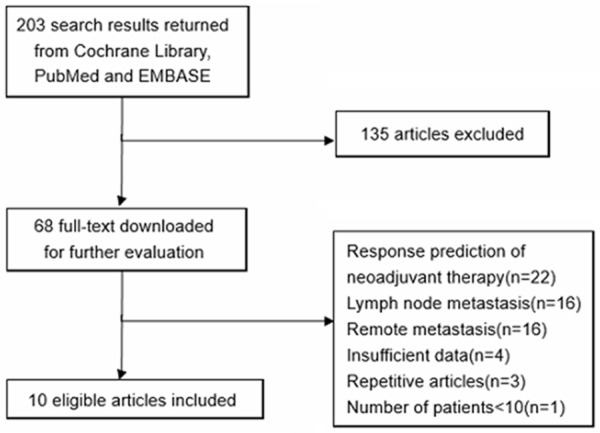
Literature research.
Figure 2.
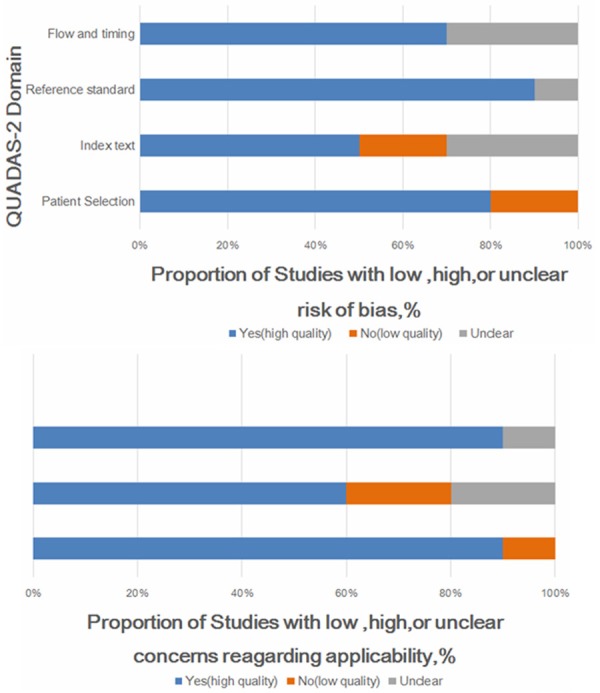
Quality assessment of included studies using QUADAS tool.
Of 203 studies, ten studies were included in the meta-analysis, involving 367 malignant lesions and 178 benign lesions. Among the ten studies, the anatomic location of lesions for six studies were rectum or colon, and three were rectum and one was colon. The mean age of patients in each individual studies ranged from 57 years old to 69 years old, and the median value was around 60 years old. The baseline characteristics of patients in these individual studies are summarized in Table 1. All images were obtained using the systems with 1.5 T magnetic field. Typical b-values for imaging were 0, 500, 800, and 1000 s/mm2. There were two ways to identify a malignant lesion, one was by the existence of a local high signal intensity (HSI) area on the images of maximum intensity projection, and the other way was by the ADC value which was calculated from the signal intensity of region of interest on images with high b-value and low b-value. In three of the ten studies, malignant lesions were identified by both HSI and ADC value, and five were by HSI alone, and the remaining two were only by ADC value. The ADC value of malignant lesion ranged from 0.97 s/mm2 to 1.19 s/mm2, and benign lesion ranged from 1.37 s/mm2 to 2.69 s/mm2. Malignant lesions had a much lower ADC value. The imaging feature of each individual studies are shown in Table 2.
Table 1.
Clinical characteristics of included studies
| Study (first author) | Year | Country | Cancer patients | Non-cancer patients | Benign/Malignant | Location | ||
|---|---|---|---|---|---|---|---|---|
|
| ||||||||
| Age | M/F | Age | M/F | |||||
| Hosonuma | 2006 | Japan | 64.2/31-81 | 11/4 | 64.9/51-81 | 14/4 | 20/15 | CR |
| Soyer | 2010 | France | 69/43-84 | 14/17 | 65/30-81 | 14/17 | 31/31 | R |
| Ichikawa | 2006 | Japan | 59/33-69 | 18/15 | - | - | 33/15 | CR |
| Rao | 2008 | China | 60.9/21-86 | 23/22 | - | - | 20/45 | R |
| Colosio | 2013 | France | 64/- | 17/10 | 69/- | 14/8 | 22/27 | CR |
| Lambregts | 2010 | Netherlands | 68/35-87 | 13/6 | 64/22-81 | 13/10 | 23/19 | R |
| Kilickesmez | 2009 | Turkey | 57/- | - | 45/-- | - | 39/14 | CR |
| Nural | 2013 | Turkey | 63/30-81 | 12/5 | 61/46-69 | 10/3 | 13/17 | CR |
| Solak | 2013 | Turkey | 57/31-77 | 32/0 | - | - | 15/26 | CR |
| Avcu | 2014 | Turkey | - | - | - | - | 31/27 | C |
M: male, F: female; CR: colorectal R: rectal C: colonic.
Table 2.
Imaging feature of each studies
| Study (first author) | Coil type | Company | Magnetic (T) | Methods | b value | ADC value (mm^2/s) | |
|---|---|---|---|---|---|---|---|
|
| |||||||
| Patients | Control | ||||||
| Hosonuma | body and spine matrix coil | SIEMENS AG | 1.50 | HSI; ADC | 50; 800 | 1.19 | 1.37 |
| Soyer | anterior torso phased-array coil | Siemens Healthcare | 1.50 | HSI; ADC | 0; 500; 100 | 1.04 | 1.39 |
| Ichikawa | Phased-array body coil | GE Healthcare | 1.50 | HSI | 0; 1000 | - | - |
| Rao | Phased-array body coil | Siemens AG | 1.50 | HSI | 0; 1000 | - | - |
| Colosio | abdominal phased-array coil | Siemens Healthcare | 1.50 | HSI | 0; 500; 1000 | - | - |
| Lambregts | Phased-array body coil | Philips Medical | 1.50 | HSI | 0; 500; 1000 | - | - |
| Kilickesmez | Phased-array body coil | Siemens Healthcare | 1.50 | ADC | 0; 500; 1000 | 0.97 | 1.37 |
| Nural | Phased-array body coil | Siemens Magnetom | 1.50 | HSI | 0; 800 | 1.07 | 1.91 |
| Solak | Phased-array body coil | Siemens-Espree | 1.50 | HSI; ADC | 0; 800 | 1.19 | 2.69 |
| Avcu | Phased-array body coil | Siemens Magnetom | 1.50 | ADC | 0; 800 | 1.02 | 1.53 |
HSI: Lesions were identified as malignant with the appearance of focal areas of high signal intensity. ADC: Lesions were identified as malignant with significant lower ADC value.
The sensitivity of DWI in identification of primary colorectal cancers ranged from 82% to 100% and specificity from 65% to 100%. The detailed data of sensitivity and specificity with 95% of CI for each individual study were given in Figure 3. To diagnose colorectal cancers, the pooled sensitivity and specificity were 0.95 (95% CI, 0.90-0.97) and 0.93 (95% CI: 0.85-0.97), respectively. Besides, the PLR and NLR ranged from 2.71 to 44.4 and 0.02 to 0.20, with pooled values of 12.8 (95% CI: 5.99, 27.4) and 0.06 (95% CI: 0.03, 0.11), respectively (Figure 4).
Figure 3.
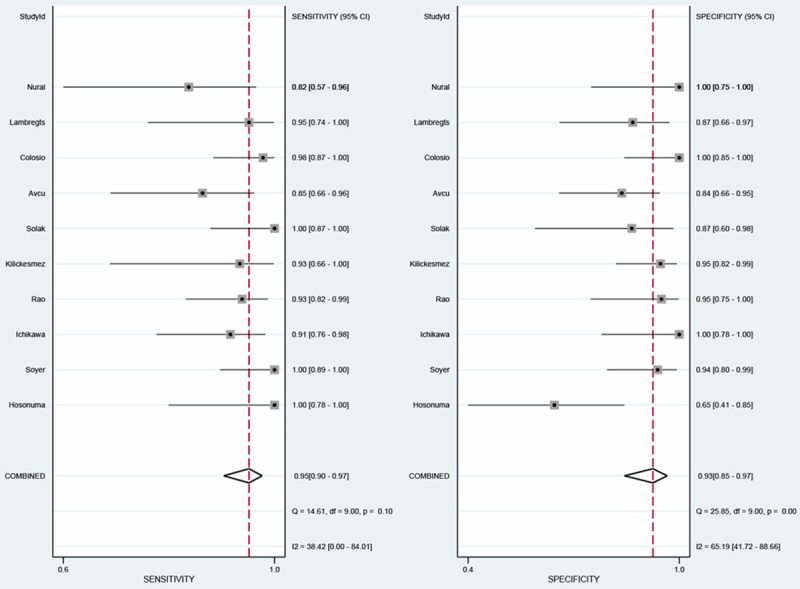
The sensitivity and specificity of DWI for the diagnosis of colorectal cancer.
Figure 4.
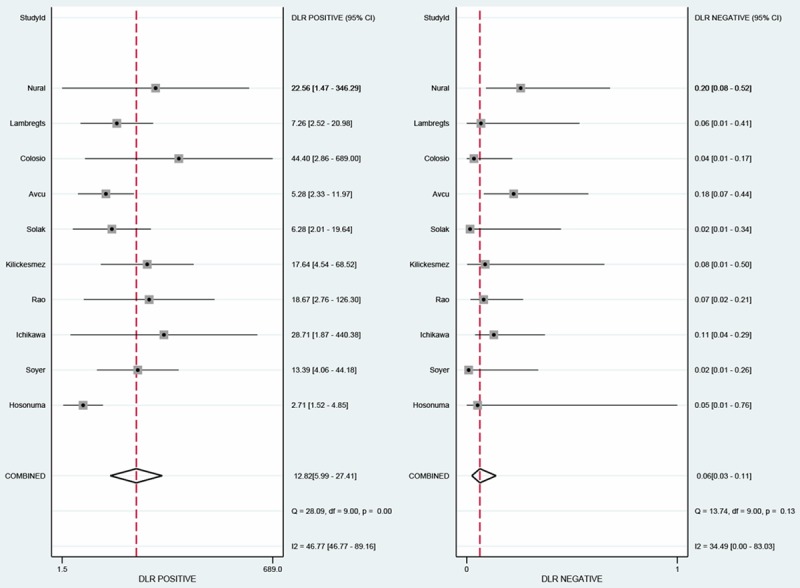
The positive and negative likelihood ratios (LR) evaluated in the meta-analysis.
The test for threshold effect shows a Spearman correlation coefficient of 0.24 (P=0.51). The shape of ROC curve also doesn’t have “should-arm” pattern (Figure 5). These results indicate no significant threshold effect. The summary ROC curve (Figure 6) was fitted using data of each individual study, and AUC was 0.98, indicating a fine diagnostic accuracy.
Figure 5.
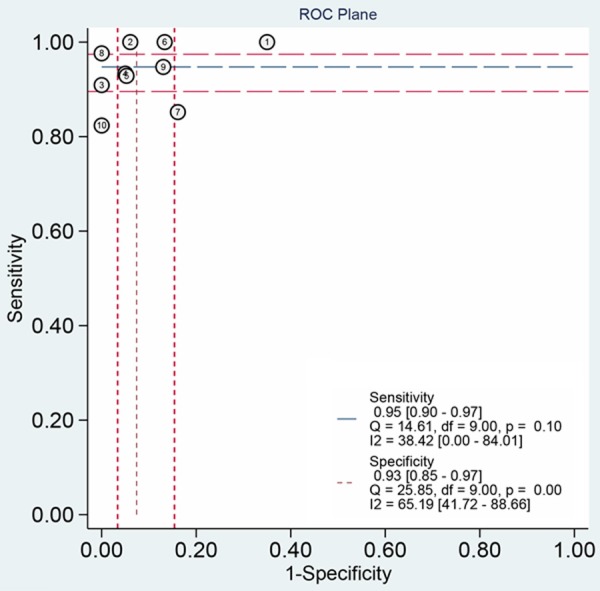
ROC plane.
Figure 6.
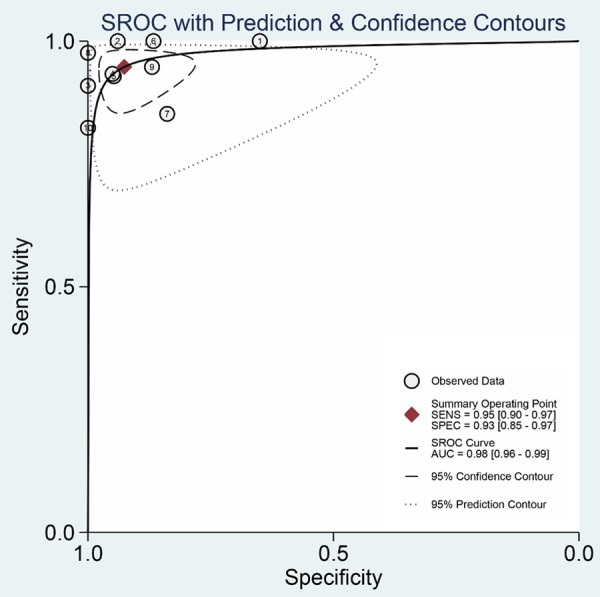
Summary receiver operating characteristic (SROC) curve of DWI for differentiation of colorectal cancer.
The heterogeneity test of sensitivity and specificity reveals that Q equals to 14.6 (P=0.10, I2=38.4%) and 25.9 (P=0.00, I2=65.2%), respectively. And the heterogeneity of the positive and negative likelihood ratios are Q=28.1 (P=0.00, I2=46.8%) and 13.7 (P=0.13, I2=34.5%), respectively. Thus except for sensitivity and negative likelihood ratio, other estimates exhibits some extent of heterogeneity. For homogeneous data, a fixed effects model was applied and the rest was analyzed using random effects model.
The nonsignificant slope of Deeks’ funnel plot asymmetry tests indicated that no significant bias was found (Bias =1.21, P=0.26), suggesting no major publication bias (Figure 7).
Figure 7.
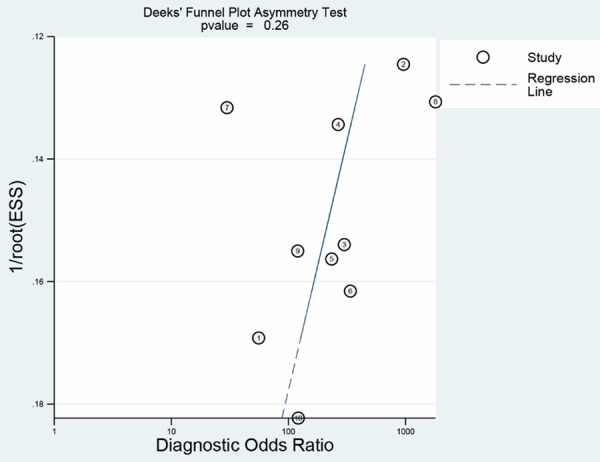
Publication bias.
Discussion
Colonoscopy plays a major role in the detection of colorectal cancer, and tissue samples for pathologic diagnosis could be obtained through endoscopic biospy. However, the invasive na-ture of colonoscopy and need for patients preparation limited its clinical application [32]. CT is a widely used imaging method in abdominal and pelvic region. Its disadvantage is potentially harmful due to radiation and plain soft tissue resolution. It has been reported to have a low detection rate, and only good sensitivity for already highly advanced cases [33]. MRI seems to be a promising alternative for the investigations mentioned above because of the advantages of no need for patient prepapration, no risk of radiation, noninvasive and excellent soft tissue resolution. High-spatial-resolution T2WI MRI is increasingly used as an optimal method in detection of colorecatal cancer. Signal intensity of T2WI MRI shows differences in the tumor, the mucosa and submucosal layers, the muscular layer, the perirectal fat, and the mesorectal fascia in rectum region. The tumor was usually identified as a region with signal intensity higher than the circular and longitudinal muscular layers and lower than the submucosa. Moreover, with the prolongation of examination time, more motion artifacts may be caused by excessive motion of the anterior abdominal wall and results in poor quality images [13].
DWI is a sensitive, functional imaging modality to detect the diffusion process of molecules, mainly water in tissue, in vivo and noninvasively [34]. It has been applied for early diagnosis of ischemic cerebral infartion over the last decade [35,36]. Recently, it has been used in other clinical departments, especially in abdominal examination due to the development of ultra fast sequences such as echo planar imaging sequences (EPI) [37,38]. It was reported that DWI could provide a desirable accuracy in the detection of prostate cancer [9], lung cancer [10], pancreatic cancer [39]. In colorectal cancer, it has been used in detection of lymphatic metastasis and predicting response to neoadjuvant therapy in colorectal cancer [11,40]. However, the ability to differentiate benign and malignant colorectal diseases of DWI remains unclear and reports concerning this aspect is rare. Therefore, we firstly performed this meta-analysis.
In this meta-analysis, we worked out the pooled sensitivity 95% (95% CI, 90 to 97%) and specificity 93% (95% CI, 85 to 97%) from the 10 included studies for the differentiation of benign and malignant colorectal lesions. In general, ranging between 0.50 and 1.00, AUC >0.80 indicates a good test. And the AUC we calculated by SROC was 0.97, significantly higher than the expected 0.80. Therefore, the result showed DWI had a great performance in identification malignant from benign colorectal lesions.
Some pooled estimates in this meta-analysis had heterogeneity. Threshold effect may be a major cause of it, however, the Spearman’s correlation test shows no significant threshold effect, and the shape of ROC is also not typical “shoulder arm” pattern. We considered the possibility of publication bias as the origin of heterogeneity. However, Deeks’ funnel tests indicated no publication bias (P=0.26). To further investigate the source of heterogeneity, we performed subgroup analysis. The result showed there were no considerable improvement of homogeneity in subgroups divided according to country, b-value, imaging techniques and so on. In the subgroup excluding the study of Hosonuma whose spectrum of patients wasn’t very proper shows a great improvement in homogeneity [27]. Hosonuma’s study has the disadvantage of having patients with colon cancer as control group when evaluate the diagnostic value of DWI in identification of rectal cancer. The subgroup analysis shows that sensitivity and specificity were 0.94 (Q=10.5, P=0.12, I2=37.5%) and 0.93 (Q=10.7, P=0.22, I2=25.2%), respectively. Therefore, heterogeneity decreases a lot than initial pooled estimates. In the subgroup analysis, although some factors such as histological type, quality of imaging system, professional ability of radiologist doctor may still cause slight heterogeneity, our meta-analysis has a relatively desirable homogeneity.
In summary, all currently available evidence indicates that DWI is an accurate, noninvasive, and non-radiative imaging technique for distinguishing malignant from benign colorectal lesions. In the future, however, large-scale randomized control trials are necessary to further validate the clinical value of DWI and establish standards of measurement, analysis, and cutoff values of diagnosis.
Disclosure of conflict of interest
None.
References
- 1.Meyer JE, Narang T, Schnoll-Sussman FH, Pochapin MB, Christos PJ, Sherr DL. Increasing incidence of rectal cancer in patients aged younger than 40 years: an analysis of the surveillance, epidemiology, and end results database. Cancer. 2010;116:4354–4359. doi: 10.1002/cncr.25432. [DOI] [PMC free article] [PubMed] [Google Scholar]
- 2.Bishehsari F, Mahdavinia M, Vacca M, Malekzadeh R, Mariani-Costantini R. Epidemiological transition of colorectal cancer in developing countries: environmental factors, molecular pathways, and opportunities for prevention. World J Gastroenterol. 2014;20:6055–6072. doi: 10.3748/wjg.v20.i20.6055. [DOI] [PMC free article] [PubMed] [Google Scholar]
- 3.Binefa G, Rodriguez-Moranta F, Teule A, Medina-Hayas M. Colorectal cancer: from prevention to personalized medicine. World J Gastroenterol. 2014;20:6786–6808. doi: 10.3748/wjg.v20.i22.6786. [DOI] [PMC free article] [PubMed] [Google Scholar]
- 4.Misra SP, Dwivedi M, Misra V, Gupta M, Kunwar BK. Endoscopic biopsies from normal-appearing terminal ileum and cecum in patients with suspected colonic tuberculosis. Endoscopy. 2004;36:612–616. doi: 10.1055/s-2004-814518. [DOI] [PubMed] [Google Scholar]
- 5.Kekelidze M, D’Errico L, Pansini M, Tyndall A, Hohmann J. Colorectal cancer: current imaging methods and future perspectives for the diagnosis, staging and therapeutic response evaluation. World J Gastroenterol. 2013;19:8502–8514. doi: 10.3748/wjg.v19.i46.8502. [DOI] [PMC free article] [PubMed] [Google Scholar]
- 6.Trevisani L, Zelante A, Sartori S. Colonoscopy, pain and fears: Is it an indissoluble trinomial? World J Gastrointest Endosc. 2014;6:227–233. doi: 10.4253/wjge.v6.i6.227. [DOI] [PMC free article] [PubMed] [Google Scholar]
- 7.Panes J, Bouhnik Y, Reinisch W, Stoker J, Taylor SA, Baumgart DC, Danese S, Halligan S, Marincek B, Matos C, Peyrin-Biroulet L, Rimola J, Rogler G, van Assche G, Ardizzone S, Ba-Ssalamah A, Bali MA, Bellini D, Biancone L, Castiglione F, Ehehalt R, Grassi R, Kucharzik T, Maccioni F, Maconi G, Magro F, Martin-Comin J, Morana G, Pendse D, Sebastian S, Signore A, Tolan D, Tielbeek JA, Weishaupt D, Wiarda B, Laghi A. Imaging techniques for assessment of inflammatory bowel disease: joint ECCO and ESGAR evidence-based consensus guidelines. J Crohns Colitis. 2013;7:556–585. doi: 10.1016/j.crohns.2013.02.020. [DOI] [PubMed] [Google Scholar]
- 8.Yamada I, Aung W, Himeno Y, Nakagawa T, Shibuya H. Diffusion coefficients in abdominal organs and hepatic lesions: evaluation with intravoxel incoherent motion echo-planar MR imaging. Radiology. 1999;210:617–623. doi: 10.1148/radiology.210.3.r99fe17617. [DOI] [PubMed] [Google Scholar]
- 9.Haghighi M, Shah S, Taneja SS, Rosenkrantz AB. Prostate cancer: diffusion-weighted imaging versus dynamic-contrast enhanced imaging for tumor localization-a meta-analysis. J Comput Assist Tomogr. 2013;37:980–988. doi: 10.1097/RCT.0b013e3182a3f9c7. [DOI] [PubMed] [Google Scholar]
- 10.Chen L, Zhang J, Bao J, Zhang L, Hu X, Xia Y, Wang J. Meta-analysis of diffusion-weighted MRI in the differential diagnosis of lung lesions. J Magn Reson Imaging. 2013;37:1351–1358. doi: 10.1002/jmri.23939. [DOI] [PubMed] [Google Scholar]
- 11.Jiang XX, Yan ZX, Song YY, Zhao WL. A pooled analysis of MRI in the detection of bone marrow infiltration in patients with malignant lymphoma. Clin Radiol. 2013;68:e143–153. doi: 10.1016/j.crad.2012.11.002. [DOI] [PubMed] [Google Scholar]
- 12.Song I, Kim SH, Lee SJ, Choi JY, Kim MJ, Rhim H. Value of diffusion-weighted imaging in the detection of viable tumour after neoadjuvant chemoradiation therapy in patients with locally advanced rectal cancer: comparison with T2 weighted and PET/CT imaging. Br J Radiol. 2012;85:577–586. doi: 10.1259/bjr/68424021. [DOI] [PMC free article] [PubMed] [Google Scholar]
- 13.Vliegen RF, Beets GL, von Meyenfeldt MF, Kessels AG, Lemaire EE, van Engelshoven JM, Beets-Tan RG. Rectal cancer: MR imaging in local staging--is gadolinium-based contrast material helpful? Radiology. 2005;234:179–188. doi: 10.1148/radiol.2341031403. [DOI] [PubMed] [Google Scholar]
- 14.Ichikawa T, Erturk SM, Motosugi U, Sou H, Iino H, Araki T, Fujii H. High-B-value diffusion-weighted MRI in colorectal cancer. AJR Am J Roentgenol. 2006;187:181–184. doi: 10.2214/AJR.05.1005. [DOI] [PubMed] [Google Scholar]
- 15.Rao SX, Zeng MS, Chen CZ, Li RC, Zhang SJ, Xu JM, Hou YY. The value of diffusion-weighted imaging in combination with T2-weighted imaging for rectal cancer detection. Eur J Radiol. 2008;65:299–303. doi: 10.1016/j.ejrad.2007.04.001. [DOI] [PubMed] [Google Scholar]
- 16.Soyer P, Lagadec M, Sirol M, Dray X, Duchat F, Vignaud A, Fargeaudou Y, Place V, Gault V, Hamzi L, Pocard M, Boudiaf M. Free-breathing diffusion-weighted single-shot echo-planar MR imaging using parallel imaging (GRAPPA 2) and high b value for the detection of primary rectal adenocarcinoma. Cancer Imaging. 2010;10:32–39. doi: 10.1102/1470-7330.2010.0011. [DOI] [PMC free article] [PubMed] [Google Scholar]
- 17.Solak A, Genc B, Solak I, Kalaycioglu S, Sahin N, Yalaz S, Sivrikoz ON. The value of diffusion-weighted magnetic resonance imaging in the differential diagnosis in diffuse bowel wall thickening. Turk J Gastroenterol. 2013;24:154–160. doi: 10.4318/tjg.2013.0660. [DOI] [PubMed] [Google Scholar]
- 18.Colosio A, Soyer P, Rousset P, Barbe C, Nguyen F, Bouche O, Hoeffel C. Value of diffusion-weighted and gadolinium-enhanced MRI for the diagnosis of pelvic recurrence from colorectal cancer. J Magn Reson Imaging. 2014;40:306–313. doi: 10.1002/jmri.24366. [DOI] [PubMed] [Google Scholar]
- 19.Ma X, Zhang J, Zhong W, Shu C, Wang F, Wen J, Zhou M, Sang Y, Jiang Y, Liu L. The diagnostic role of a short screening tool--the distress thermometer: a meta-analysis. Support Care Cancer. 2014;22:1741–1755. doi: 10.1007/s00520-014-2143-1. [DOI] [PubMed] [Google Scholar]
- 20.Whiting PF, Rutjes AW, Westwood ME, Mallett S, Deeks JJ, Reitsma JB, Leeflang MM, Sterne JA, Bossuyt PM. QUADAS-2: a revised tool for the quality assessment of diagnostic accuracy studies. Ann Intern Med. 2011;155:529–536. doi: 10.7326/0003-4819-155-8-201110180-00009. [DOI] [PubMed] [Google Scholar]
- 21.Higgins JP, Thompson SG, Deeks JJ, Altman DG. Measuring inconsistency in meta-analyses. BMJ. 2003;327:557–560. doi: 10.1136/bmj.327.7414.557. [DOI] [PMC free article] [PubMed] [Google Scholar]
- 22.Dinnes J, Deeks J, Kirby J, Roderick P. A methodological review of how heterogeneity has been examined in systematic reviews of diagnostic test accuracy. Health Technol Assess. 2005;9:1–113. iii. doi: 10.3310/hta9120. [DOI] [PubMed] [Google Scholar]
- 23.Moreno GG, Pantoja CT. Systematic reviews of studies of diagnostic test accuracy. Rev Med Chil. 2009;137:303–307. [PubMed] [Google Scholar]
- 24.Moses LE, Shapiro D, Littenberg B. Combining independent studies of a diagnostic test into a summary ROC curve: data-analytic approaches and some additional considerations. Stat Med. 1993;12:1293–1316. doi: 10.1002/sim.4780121403. [DOI] [PubMed] [Google Scholar]
- 25.Harbord RM, Deeks JJ, Egger M, Whiting P, Sterne JA. A unification of models for meta-analysis of diagnostic accuracy studies. Biostatistics. 2007;8:239–251. doi: 10.1093/biostatistics/kxl004. [DOI] [PubMed] [Google Scholar]
- 26.Deeks JJ, Macaskill P, Irwig L. The performance of tests of publication bias and other sample size effects in systematic reviews of diagnostic test accuracy was assessed. J Clin Epidemiol. 2005;58:882–893. doi: 10.1016/j.jclinepi.2005.01.016. [DOI] [PubMed] [Google Scholar]
- 27.Hosonuma T, Tozaki M, Ichiba N, Sakuma T, Hayashi D, Yanaga K, Fukuda K. Clinical usefulness of diffusion-weighted imaging using low and high b-values to detect rectal cancer. Magn Reson Med Sci. 2006;5:173–177. doi: 10.2463/mrms.5.173. [DOI] [PubMed] [Google Scholar]
- 28.Kilickesmez O, Atilla S, Soylu A, Tasdelen N, Bayramoglu S, Cimilli T, Gurmen N. Diffusion-weighted imaging of the rectosigmoid colon: preliminary findings. J Comput Assist Tomogr. 2009;33:863–866. doi: 10.1097/RCT.0b013e31819a60f3. [DOI] [PubMed] [Google Scholar]
- 29.Lambregts DM, Cappendijk VC, Maas M, Beets GL, Beets-Tan RG. Value of MRI and diffusion-weighted MRI for the diagnosis of locally recurrent rectal cancer. Eur Radiol. 2011;21:1250–1258. doi: 10.1007/s00330-010-2052-8. [DOI] [PMC free article] [PubMed] [Google Scholar]
- 30.Nural MS, Danaci M, Soyucok A, Okumus NO. Efficiency of apparent diffusion coefficients in differentiation of colorectal tumor recurrences and posttherapeutical soft-tissue changes. Eur J Radiol. 2013;82:1702–1709. doi: 10.1016/j.ejrad.2013.05.025. [DOI] [PubMed] [Google Scholar]
- 31.Avcu S, Bulut MD, Yavuz A, Bora A, Beyazal M. Value of DW-MRI ADC quantification of colonic wall lesions in differentiation of inflammatory bowel disease and colorectal carcinoma. Jpn J Radiol. 2014;32:6–13. doi: 10.1007/s11604-013-0260-2. [DOI] [PubMed] [Google Scholar]
- 32.BA C. Colorectal cancer. Which test is best. Adv Nurse Pract. 2005;13:71–74. [PubMed] [Google Scholar]
- 33.Balthazar EJ, Siegel SE, Megibow AJ, Scholes J, Gordon R. CT in patients with scirrhous carcinoma of the GI tract: imaging findings and value for tumor detection and staging. AJR Am J Roentgenol. 1995;165:839–845. doi: 10.2214/ajr.165.4.7676978. [DOI] [PubMed] [Google Scholar]
- 34.Turner R, Le Bihan D, Maier J, Vavrek R, Hedges LK, Pekar J. Echo-planar imaging of intravoxel incoherent motion. Radiology. 1990;177:407–414. doi: 10.1148/radiology.177.2.2217777. [DOI] [PubMed] [Google Scholar]
- 35.Gauvain KM, McKinstry RC, Mukherjee P, Perry A, Neil JJ, Kaufman BA, Hayashi RJ. Evaluating pediatric brain tumor cellularity with diffusion-tensor imaging. AJR Am J Roentgenol. 2001;177:449–454. doi: 10.2214/ajr.177.2.1770449. [DOI] [PubMed] [Google Scholar]
- 36.Thoeny HC. Diffusion-weighted MRI in head and neck radiology: applications in oncology. Cancer Imaging. 2011;10:209–214. doi: 10.1102/1470-7330.2010.0030. [DOI] [PMC free article] [PubMed] [Google Scholar]
- 37.Ichikawa T, Haradome H, Hachiya J, Nitatori T, Araki T. Diffusion-weighted MR imaging with a single-shot echoplanar sequence: detection and characterization of focal hepatic lesions. AJR Am J Roentgenol. 1998;170:397–402. doi: 10.2214/ajr.170.2.9456953. [DOI] [PubMed] [Google Scholar]
- 38.Ichikawa T, Haradome H, Hachiya J, Nitatori T, Araki T. Diffusion-weighted MR imaging with single-shot echo-planar imaging in the upper abdomen: preliminary clinical experience in 61 patients. Abdom Imaging. 1999;24:456–461. doi: 10.1007/s002619900539. [DOI] [PubMed] [Google Scholar]
- 39.Ma X, Zhao X, Ouyang H, Sun F, Zhang H, Zhou C. Quantified ADC histogram analysis: a new method for differentiating mass-forming focal pancreatitis from pancreatic cancer. Acta Radiol. 2014;55:785–792. doi: 10.1177/0284185113509264. [DOI] [PubMed] [Google Scholar]
- 40.Ono K, Ochiai R, Yoshida T, Kitagawa M, Omagari J, Kobayashi H, Yamashita Y. Comparison of diffusion-weighted MRI and 2-[fluorine-18] -fluoro-2-deoxy-D-glucose positron emission tomography (FDG-PET) for detecting primary colorectal cancer and regional lymph node metastases. J Magn Reson Imaging. 2009;29:336–340. doi: 10.1002/jmri.21638. [DOI] [PubMed] [Google Scholar]


