Abstract
The association between the rs4977756 single nucleotide polymorphism (SNP) and glioma risk has been studied, but these studies have yielded conflicting results. In order to explore this association, we performed a meta-analysis. A comprehensive literature search was performed using PubMed and EMBASE database. Six articles including 12 case-control studies in English with 12022 controls and 6871 cases were eligible for the meta-analysis. Subgroup analyses were conducted by ethnicity and source of controls. Our meta-analysis found that rs4977756 polymorphism was associated with glioma risks in homozygote, heterozygote, dominant, recessive and additive genetic models (GG versus AA: OR=1.55, 95% CI=1.42-1.69, Ph=0.996, I2=0.0%; AG versus AA: OR=1.20, 95% CI=1.12-1.28, Ph=0.934, I2=0.0%; recessive model: OR=1.39, 95% CI=1.28-1.50, Ph=0.995, I2=0.0%; dominant model: OR=1.29, 95% CI=1.21-1.37, Ph=0.923, I2=0.0%; additive model: OR=1.24, 95% CI=1.19-1.30, Ph=0.966, I2=0.0%). Moreover, our results suggested that CDKN2A-CDKN2B rs4977756 polymorphism was associated with a notable increased risk of glioma in Europeans. However, in Asians, we could not come to a conclusion because of lack of studies. Sensitivity analysis showed the omission of any study made no significant difference. No evidence of publication bias was produced. Our meta-analysis suggested that rs4977756 polymorphism was associated with increased risk of glioma. Moreover, additional studies should be further investigated to draw a more accurate conclusion.
Keywords: Glioma, CDKN2A-CDKN2B, rs4977756, polymorphism, meta-analysis
Introduction
Gliomas are the most common tumor of the central nervous system in adults accounting for more than 70% of all brain tumors, and of these, glioblastoma (GBM) is the most frequent and malignant histologic type [1]. On the basis of cellular lineage, they are classified as astrocytomas, oligodendrogliomas, oligoastrocytomas and glioblastoma, and they also can be classified into four clinical grades: World Health Organization (WHO) grade I (pilocytic astrocytomas), WHO grade II (diffuse low grade gliomas), WHO grade III (anaplastic gliomas) and WHO grade IV (GBM) [2]. The mechanisms of carcinogenesis of gliomas remain uncertain. More and more studies suggest that the number of genetic alterations play a pivotal role in glioma susceptibility [3,4].
The rs4977756 polymorphism is in mapped 59 kb telomeric to CDKN2B within a 122-kb region of LD at 9p21.3. This region encompasses the CDKN2A-CDKN2B tumor suppressor genes. CDKN2A encodes p16 (INK4A), a negative regulator of cyclin-dependent kinases and p14 (ARF1), an activator of p53 [5]. Previous genetic association studies, especially genome-wide association studies (GWAS), indicated that the rs4977756 polymorphism may contribute to the increased risk of glioma [6]. However, the results were inconclusive. To gain better insight into impact of rs4977756 polymorphic variants on the risk of glioma, we performed a meta-analysis from all eligible case-control studies to derive a more precise estimation of the association between the CDKN2A/B rs4977756 polymorphism and glioma risk.
Methods
Study identification and selection
A comprehensive literature search was performed through PubMed and EMBASE using the following search terms: (CDKN2A OR CDKN2B OR CDKN2A/B OR rs4977756) AND (variant OR polymorphism OR variation OR polymorphisms) AND (glioma or glioblastoma or astrocytoma). Additional studies were identified by hand searching references. The following criteria were used for our meta-analysis: (1) a case-control study evaluating the rs4977756 polymorphism in the CDKN2A/B gene; (2) studies with full-text articles; (3) sufficient data for estimating an odds ratio (OR) with 95% confidence interval (CI); (4) genotype distribution of control population must be in Hardy-Weinberg equilibrium (HWE); (5) no overlapping data. The exclusion criteria were as follows: (1) Reviews or case reports, case studies without control groups; (2) Studies that were not related to human cancer research; (3)Studies that do not provide sufficient data; (4) Overlapping data. If studies had the same or overlapping data, only the largest study should be included in the final analysis.
Data extraction
Three investigators independently extracted the data from all the eligible studies according to the selection criteria listed above. Any disagreement was resolved by discussion. The following data were collected from each study: first author, publication year, country, ethnicity (European or Asian), source of controls, numbers of cases and controls, genotype frequency of cases and controls, G allele frequency in controls, and P value for Hardy-Weinberg equilibrium.
Statistical analysis
A Chi-square test using a web-based program (http://ihg2.helmholtz-muenchen.de/cgi-bin/hw/hwa1.pl) was applied to determine if observed frequencies of genotypes in controls conformed to HWE (P<0.1 was considered significant). The crude ORs and 95% CIs in each case-control study were used to assess the strength of the associations between the CDKN2A/B rs4977756 polymorphisms and glioma risk. The pooled ORs were performed for homozygote model (GG vs. AA), a heterozygote (AG vs. AA), a dominant model (GG + AG vs. AA), a recessive model (GG vs. AG + AA) and an additive model (G vs. A). Subgroup analyses were performed based on the source of controls, ethnicity and country. Heterogeneity assumption was checked by a Q-test, and I2 (I2=100% × (Q-df)/Q) statistic was calculated to quantify the proportion of the total variation across studies due to heterogeneity. If P-value <0.05 for the Q-test indicated the existence of heterogeneity among studies, then the pooled OR estimate of each study was calculated by the random-effects model (the DerSimonian and Laird method [7]). Otherwise, the fixed-effects model (the Mantel-Haenszel method [8]) was used. An estimate of potential publication bias was carried out by the funnel plot, in which the standard error of log (OR) of each study was plotted against its log (OR). Sensitivity analyses were performed to evaluate the stability of the results by omitting each study to reflect the influence of the individual data to the summary ORs. Funnel plot asymmetry was further assessed by the method of Egger’s linear regression test (P<0.05 was considered a significant publication bias) [9]. All statistical analyses were performed using the STATA software (version 12; Stata Corporation, College Station, TX, USA).
Results
Extraction process and study characteristics
A total of 6 articles [6,10-14] including 12 case-control studies in English with 12022 controls and 6871 cases were eligible for the meta-analysis. The main results of this meta-analysis were listed in Table 1. Of all the eligible studies collected in this meta-analysis, eleven were conducted in European populations and one was in Asian. Nine studies were population-based and three were hospital-based studies. Figure 1 shows the study selection procedure.
Table 1.
Main characteristics of all studies included in the meta-analysis
| First author | Year | Country | Ethnicity | Controls source | Cases/Controls | Case | Control | A allele in controls (%) | HWE | ||||
|---|---|---|---|---|---|---|---|---|---|---|---|---|---|
|
| |||||||||||||
| GG | AG | AA | GG | AG | AA | ||||||||
| Shete (German) | 2009 | German | European | PB | 499/566 | 108 | 240 | 151 | 90 | 265 | 211 | 0.61 | 0.66 |
| Shete (Sweden) | 2009 | Sweden | European | PB | 632/770 | 157 | 325 | 150 | 168 | 379 | 223 | 0.54 | 0.77 |
| Shete (US) | 2009 | US | European | HB | 1247/2235 | 276 | 594 | 377 | 370 | 1083 | 782 | 0.59 | 0.88 |
| Shete (French) | 2009 | French | European | PB | 1352/1583 | 239 | 639 | 474 | 209 | 723 | 651 | 0.64 | 0.71 |
| Schoemaker (Denmark) | 2010 | Denmark | European | PB | 121/245 | 29 | 55 | 37 | 27 | 64 | 54 | 0.59 | 0.30 |
| Schoemaker (Sweden) | 2010 | Sweden | European | PB | 196/367 | 57 | 97 | 42 | 80 | 177 | 110 | 0.54 | 0.58 |
| Schoemaker (UK-North) | 2010 | UK | European | PB | 375/627 | 85 | 182 | 108 | 110 | 301 | 216 | 0.58 | 0.77 |
| Schoemaker (UK-South) | 2010 | UK | European | PB | 232/390 | 49 | 113 | 70 | 68 | 181 | 141 | 0.59 | 0.45 |
| Wang | 2011 | US | European | PB | 332/817 | 68 | 151 | 113 | 125 | 389 | 303 | 0.61 | 0.99 |
| Stefano | 2012 | US | European | HB | 849/1190 | 137 | 409 | 303 | 143 | 531 | 516 | 0.66 | 0.96 |
| Li | 2012 | China | Asian | PB | 226/251 | 15 | 72 | 139 | 15 | 84 | 152 | 0.77 | 0.46 |
| Safaeian | 2013 | US | European | HB | 810/3081 | 179 | 383 | 248 | 509 | 1460 | 1112 | 0.60 | 0.42 |
PB population-based, HB hospital-based, HWE P values for Hardy-Weinberg equilibrium for each study’s control group.
Figure 1.
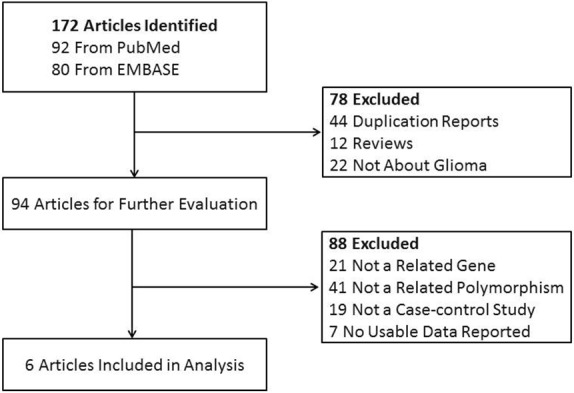
Flow chart showing study selection procedure.
Meta-analysis results
Table 2 listed the main results of the meta-analysis for the CDKN2A/B rs4977756 polymorphism. And a significant association between this polymorphism and glioma risk was observed when all eligible studies were pooled into meta-analysis in all genetic models (GG versus AA: OR=1.55, 95% CI=1.42-1.69, Ph=0.996, I2=0.0%; AG versus AA: OR=1.20, 95% CI=1.12-1.28, Ph=0.934, I2=0.0%; recessive model: OR=1.39, 95% CI=1.28-1.50, Ph=0.995, I2=0.0%; dominant model: OR=1.29, 95% CI=1.21-1.37, Ph=0.923, I2=0.0%; additive model: OR=1.24, 95% CI=1.19-1.30, Ph=0.966, I2=0.0%). Figure 2 shows the overall meta-analysis of CDKN2A/B rs4977756 polymorphism and glioma risk in homozygote model. When stratified by ethnicity, our results showed CDCC26 rs4295627 polymorphism was associated with increased risk of glioma among European population (GG versus AA: OR=1.56, 95% CI=1.43-1.70, Ph=0.999, I2=0.0%; AG versus AA: OR=1.21, 95% CI=1.13-1.30, Ph=0.972, I2=0.0%; recessive model: OR=1.39, 95% CI=1.29-1.51, Ph=0.994, I2=0.0%; dominant model: OR=1.30, 95% CI=1.21-1.38, Ph=0.988, I2=0.0%; additive model: OR=1.25, 95% CI=1.19-1.30, Ph=0.997, I2=0.0%), but not among Asians. Figure 3 shows the overall meta-analysis of CDKN2A/B rs4977756 polymorphism and the risk of glioma stratified by ethnicity in homozygote model. As for the control source, we found increased risk of glioma in hospital-based studies (GG versus AA: OR=1.58, 95% CI=1.38-1.79, Ph=0.954, I2=0.0%; AG versus AA: OR=1.20, 95% CI=1.12-1.28, Ph=0.934, I2=0.0%; recessive model: OR=1.39, 95% CI=1.28-1.50, Ph=0.993, I2=0.0%; dominant model: OR=1.29, 95% CI=1.21-1.37, Ph=0.923, I2=0.0%; additive model: OR=1.24, 95% CI=1.19-1.30, Ph=0.879, I2=0.0%). Studies with population-based controls also showed elevated glioma risk in all genetic models (GG versus AA: OR=1.53, 95% CI=1.35-1.73, Ph=0.973, I2=0.0%; AG versus AA: OR=1.20, 95% CI=1.10-1.32, Ph=0.890, I2=0.0%; recessive model: OR=1.36, 95% CI=1.22-1.51, Ph=0.976, I2=0.0%; dominant model: OR=1.28, 95% CI=1.17-1.42, Ph=0.823, I2=0.0%; additive model: OR=1.23, 95% CI=1.16-1.31, Ph=0.884, I2=0.0%). Figure 4 shows the overall meta-analysis of CDKN2A/B rs4977756 polymorphism and the risk of glioma stratified by source of controls in homozygote model.
Table 2.
Results of overall and stratified analyses for the association of rs4977756 polymorphism and risk of glioma
| Viarables | Number | Homozygote (GG vs. AA) | Heterozygote (AG vs. AA) | Recessive model (GG vs. AG+AA) | Dominant model (GG+AG vs. AA) | Additive model (G vs. A) | |||||
|---|---|---|---|---|---|---|---|---|---|---|---|
|
|
|
|
|
|
|||||||
| OR (95% CI) | Ph | OR (95% CI) | Ph | OR (95% CI) | Ph | OR (95% CI) | Ph | OR (95% CI) | Ph | ||
| Total | 12 (6871/12022) | 1.55 (1.42, 1.69) | 0.996 | 1.20 (1.12, 1.28) | 0.934 | 1.39 (1.28, 1.50) | 0.995 | 1.29 (1.21, 1.37) | 0.923 | 1.24 (1.19, 1.30) | 0.966 |
| Ethnicity | |||||||||||
| European | 11 (6645/11771) | 1.56 (1.43, 1.70) | 0.999 | 1.21 (1.13, 1.30) | 0.972 | 1.39 (1.29, 1.51) | 0.994 | 1.30 (1.21, 1.38) | 0.988 | 1.25 (1.19, 1.30) | 0.997 |
| Asian | 1 (226/251) | 1.09 (0.52, 2.32) | - | 1.20 (1.12, 1.28) | - | 1.12 (0.53, 2.34) | - | 0.96 (0.66, 1.39) | - | 0.99 (0.73, 1.34) | - |
| Source of controls | |||||||||||
| Population-based | 9 (3965/5516) | 1.53 (1.35, 1.73) | 0.973 | 1.20 (1.10, 1.32) | 0.890 | 1.36 (1.22, 1.51) | 0.976 | 1.28 (1.17, 1.42) | 0.823 | 1.23 (1.16, 1.31) | 0.884 |
| Hospital-based | 3 (2906/6506) | 1.58 (1.38, 1.79) | 0.954 | 1.20 (1.12, 1.28) | 0.934 | 1.39 (1.28, 1.50) | 0.993 | 1.29 (1.21, 1.37) | 0.923 | 1.24 (1.19, 1.30) | 0.879 |
Ph P-value of Q-test for heterogeneity test. Fix-effects model was used when P-value for heterogeneity test >0.05; otherwise, random-effects model was used.
Figure 2.
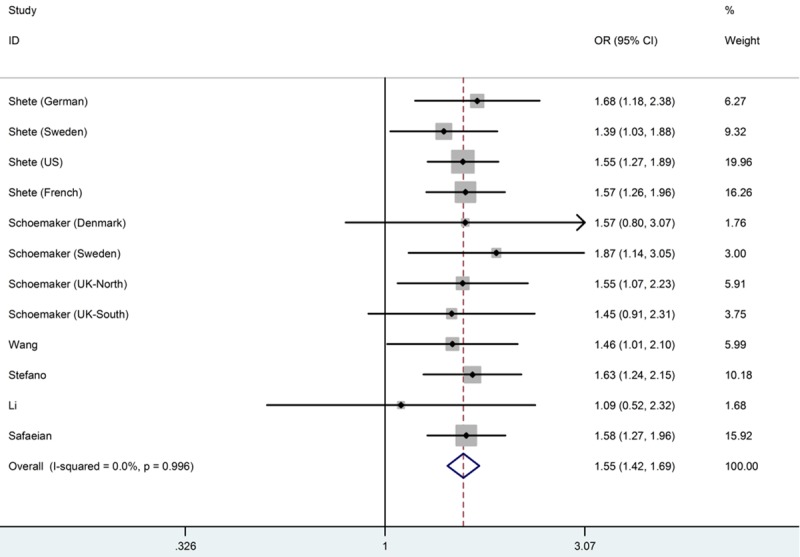
Meta-analysis of the association between CDKN2AB rs4977756 polymorphism and susceptibility to glioma (GG versus AA).
Figure 3.
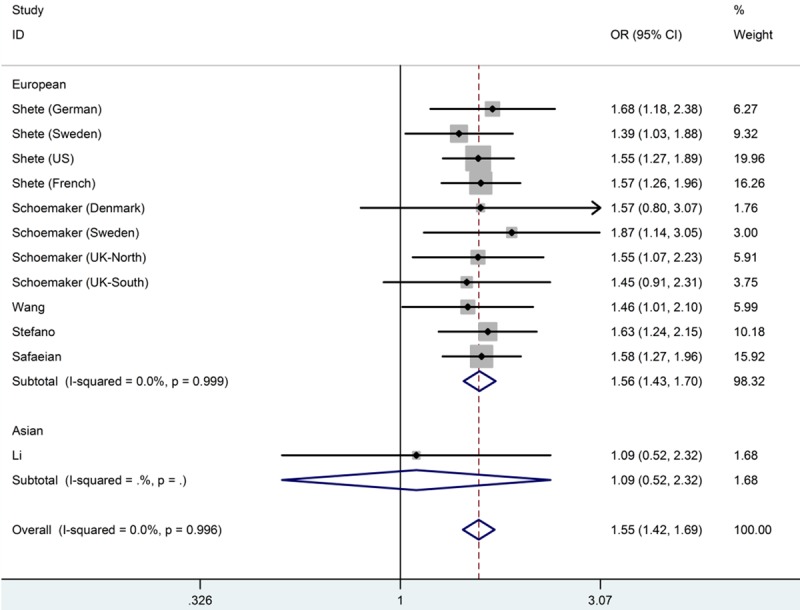
Forest plot from the meta-analysis of CDKN2AB rs4977756 polymorphism and the risk of glioma stratified by ethnicity using homozygote model (GG versus AA).
Figure 4.
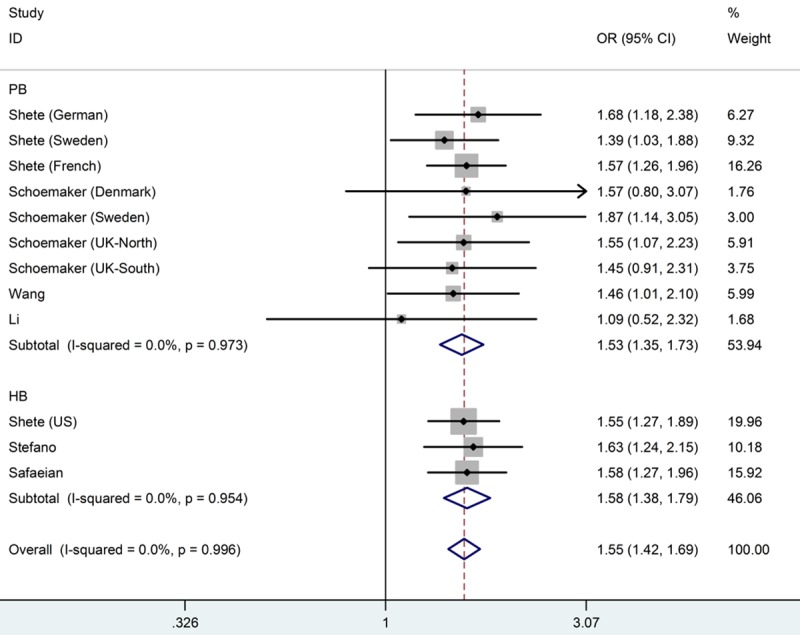
Forest plot from the meta-analysis of CDKN2AB rs4977756 polymorphism and the risk of glioma stratified by source of controls using homozygote model (GG versus AA).
Test of heterogeneity
The heterogeneity test showed that there was no significant between-study heterogeneity in terms of the rs4977756 polymorphisms in all genetic models (GG versus AA: P=0.996 for heterogeneity, I2=0.0%; AG versus AA: P=0.934 for heterogeneity, I2=0.0%; recessive model: P=0.995 for heterogeneity, I2=0.0%; dominant model; P=0.923 for heterogeneity, I2=0.0%; additive model: P=0.966 for heterogeneity, I2=0.0%).
Sensitivity analysis
In the sensitivity analysis, the influence of each study on the pooled OR was examined by repeating the meta-analysis while omitting one study each time, and the omission of any study made no significant difference. As shown in Figure 5, in this meta-analysis, the results of sensitive analysis showed that any single study did not influence the overall results qualitatively, indicating robustness and reliability of our results.
Figure 5.
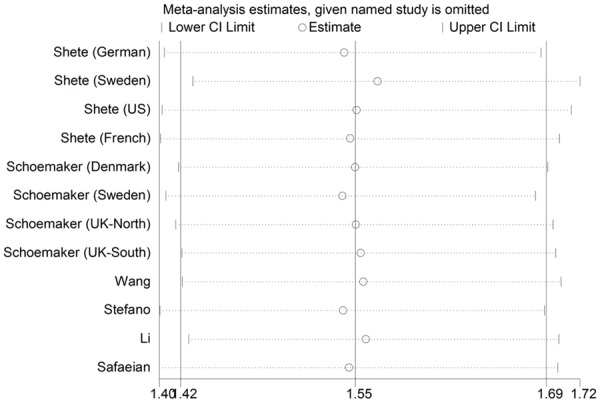
Sensitivity analysis of the summary OR coefficients on the association for the CDKN2AB rs4977756 polymorphism with glioma risk.
Publication bias
Both Begg’s funnel plot and Egger’s test were performed to assess the publication bias of literatures. The polymorphism showed consistent results, indicating no publication biases. The shapes of the funnel plot did not indicate any evidence of obvious asymmetry in homozygote model (Figure 6), and the Egger’s test suggested the absence of publication bias (GG versus AA: P=0.457; AG versus AA: P=0.913; recessive model: P=0.297; dominant model: P=0.940; additive model: P=0.495).
Figure 6.
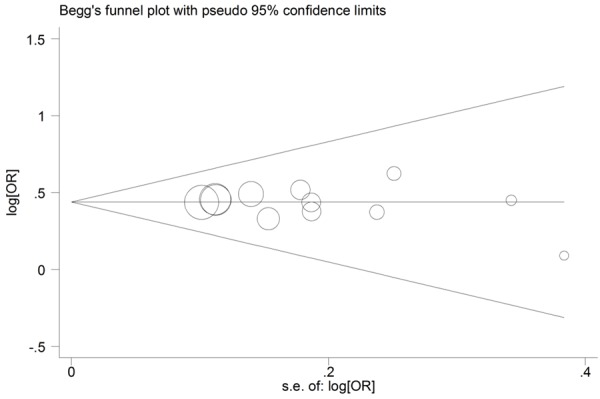
Begg’s funnel plots of rs4977756 polymorphism and glioma risk for publication bias test in the homozygote model (GG vs. AA).
Discussion
As we know, SNPs are associated with many diseases. Genome-wide association study (GWAS) is a powerful research strategy which uses SNPs as markers to identify susceptibility genes of many complex diseases [15]. Many meta-analyses have already been made to explore the association between SNP polymorphisms and the risk of glioma [16-18]. The rs4977756 is mapped 59 kb telomeric to CDKN2B within a 122-kb region of LD at 9p21.3. CDKN2B lies adjacent to the well-known tumor suppressor gene CDKN2A (encoding p16INK4A and p14ARF) in a region that is frequently mutated, deleted or hypermethylated in a wide variety of tumors, including high-grade glioma [19]. Researches show that germline mutation of CDKN2A-CDKN2B causes the familial melanoma and glioblastoma syndrome [20,21]. Furthermore, Regulation of p16/p14ARF is a vital factor for sensitivity to ionizing radiation, which is the only environmental factor strongly linked to gliomagenesis [22]. Many studies provide the evidence that mutations in CDKN2A-CDKN2B may contribute to glioma predisposition.
In this meta-analysis, including a total of 12022 controls and 6871 cases from 12 studies (6 articles), we ascertained that the CDKN2A-CDKN2B rs4977756 polymorphism was significantly associated with increased glioma risk. To our knowledge, this is the first study to investigate the association between the CDKN2A/B rs4977756 polymorphism and glioma risk. In total, we found rs4977756 polymorphism was associated with increased risk of glioma in all genetic models especially in homozygote models. As for ethnicity, rs4977756 polymorphism was associated with increased risk of glioma among Europeans. However, among Asians, there was only one study in Asians, so we could not come to a conclusion. Moreover, people should pay more attention to the risk of glioma among Asians. Ethnicity would influence tumor susceptibility by different background and environmental exposures [23]. When concerning source of controls, significantly increased risk was observed in all the genetic models in both population-based group and hospital-based group. The population-based controls might be better to reduce biases due to the fact that the controls may be representative of the general population [16].
Some possible limitations in this meta-analysis should be discussed. First, the number of researched studies was not sufficiently large for a comprehensive analysis, especially for analyses of subgroup. Only one study in Asians was included in this meta-analysis. More studies need to be done to evaluate whether this polymorphism affects the risk of glioma in different ethnicities. Second, our results were based on unadjusted estimates, while a more accurate OR should be corrected for age, sex, drinking, smoking, and other factors that are associated with cancer risk [24]. Third, since more detailed individual information of gene-gene and gene-environment interaction was unavailable, we were not able to conduct further evaluation. Nevertheless, our meta-analysis has some advantages. First, well-designed selection methods increased the statistical power of our meta-analysis. Second, there was no evidence of between-study heterogeneity, suggesting the homogeneity of the study populations. Third, the results did not show any evidence of publication bias. Fourth, all genotypes of controls were consistent with HWE (P>0.1).
In conclusion, this meta-analysis suggests that CDKN2A-CDKN2B rs4977756 polymorphism was significantly associated with increased glioma risk. There was an increased risk in Europeans. But in Asians, we could not come to a conclusion. And additional studies should be further investigated to draw a more accurate conclusion.
Acknowledgements
This work was supported in part by the National Natural Science Foundation of China (NSFC) 81272806 (Yiquan Ke) and 81302199 (Xinlin Sun), Natural Science Foundation of Guangdong Province, China S2012010009088 (Yiquan Ke), Medical Scientific Research Foundation of Guangdong Province, China B2013246 (Xinlin Sun) and the Guangdong Provincial Clinical Medical Centre for Neurosurgery, No. 2013B020400005. The study sponsors have no roles in the study design and data collection, analysis and interpretation or presentation.
Disclosure of conflict of interest
None.
References
- 1.Ohgaki H. Epidemiology of brain tumors. Methods Mol Biol. 2009;472:323–342. doi: 10.1007/978-1-60327-492-0_14. [DOI] [PubMed] [Google Scholar]
- 2.Louis DN, Ohgaki H, Wiestler OD, Cavenee WK, Burger PC, Jouvet A, Scheithauer BW, Kleihues P. The 2007 WHO Classification of Tumours of the Central Nervous System. Acta Neuropathol. 2007;114:97–109. doi: 10.1007/s00401-007-0243-4. [DOI] [PMC free article] [PubMed] [Google Scholar]
- 3.Liu Y, Shete S, Hosking FJ, Robertson LB, Bondy ML, Houlston RS. New insights into susceptibility to glioma. Arch Neurol. 2010;67:275–278. doi: 10.1001/archneurol.2010.4. [DOI] [PMC free article] [PubMed] [Google Scholar]
- 4.Duncan CG, Yan H. Genomic alterations and the pathogenesis of glioblastoma. Cell Cycle. 2011;10:1174–1175. doi: 10.4161/cc.10.8.15225. [DOI] [PubMed] [Google Scholar]
- 5.Cancer Genome Atlas Research Network. Comprehensive genomic characterization defines human glioblastoma genes and core pathways. Nature. 2008;455:1061–1068. doi: 10.1038/nature07385. [DOI] [PMC free article] [PubMed] [Google Scholar]
- 6.Shete S, Hosking FJ, Robertson LB, Dobbins SE, Sanson M, Malmer B, Simon M, Marie Y, Boisselier B, Delattre JY, Hoang-Xuan K, El Hallani S, Idbaih A, Zelenika D, Andersson U, Henriksson R, Bergenheim AT, Feychting M, Lönn S, Ahlbom A, Schramm J, Linnebank M, Hemminki K, Kumar R, Hepworth SJ, Price A, Armstrong G, Liu Y, Gu X, Yu R, Lau C, Schoemaker M, Muir K, Swerdlow A, Lathrop M, Bondy M, Houlston RS. Genome-wide association study identifies five susceptibility loci for glioma. Nat Genet. 2009;41:899–904. doi: 10.1038/ng.407. [DOI] [PMC free article] [PubMed] [Google Scholar]
- 7.DerSimonian R, Laird N. Meta-analysis in clinical trials. Control Clin Trials. 1986;7:177–188. doi: 10.1016/0197-2456(86)90046-2. [DOI] [PubMed] [Google Scholar]
- 8.Mantel N, Haenszel W. Statistical aspects of the analysis of data from retrospective studies of disease. J Natl Cancer Inst. 1959;22:719–748. [PubMed] [Google Scholar]
- 9.Egger M, Davey SG, Schneider M, Minder C. Bias in meta-analysis detected by a simple, graphical test. BMJ. 1997;315:629–634. doi: 10.1136/bmj.315.7109.629. [DOI] [PMC free article] [PubMed] [Google Scholar]
- 10.Schoemaker MJ, Robertson L, Wigertz A, Jones ME, Hosking FJ, Feychting M, Lönn S, McKinney PA, Hepworth SJ, Muir KR, Auvinen A, Salminen T, Kiuru A, Johansen C, Houlston RS, Swerdlow AJ. Interaction between 5 genetic variants and allergy in glioma risk. Am J Epidemiol. 2010;171:1165–1173. doi: 10.1093/aje/kwq075. [DOI] [PubMed] [Google Scholar]
- 11.Wang SS, Hartge P, Yeager M, Carreón T, Ruder AM, Linet M, Inskip PD, Black A, Hsing AW, Alavanja M, Beane-Freeman L, Safaiean M, Chanock SJ, Rajaraman P. Joint associations between genetic variants and reproductive factors in glioma risk among women. Am J Epidemiol. 2011;174:901–908. doi: 10.1093/aje/kwr184. [DOI] [PMC free article] [PubMed] [Google Scholar]
- 12.Di Stefano AL, Enciso-Mora V, Marie Y, Desestret V, Labussière M, Boisselier B, Mokhtari K, Idbaih A, Hoang-Xuan K, Delattre JY, Houlston RS, Sanson M. The associations between glioma susceptibility loci and pathological parameters define specific molecular etiologies. Neuro Oncol. 2013;15:542–7. doi: 10.1093/neuonc/nos284. [DOI] [PMC free article] [PubMed] [Google Scholar]
- 13.Li S, Jin T, Zhang J, Lou H, Yang B, Li Y, Chen C, Zhang Y. Polymorphisms of TREH, IL4R and CCDC26 genes associated with risk of glioma. Cancer Epidemiol. 2012;36:283–287. doi: 10.1016/j.canep.2011.12.011. [DOI] [PubMed] [Google Scholar]
- 14.Safaeian M, Rajaraman P, Hartge P, Yeager M, Linet M, Butler MA, Ruder AM, Purdue MP, Hsing A, Beane-Freeman L, Hoppin JA, Albanes D, Weinstein SJ, Inskip PD, Brenner A, Rothman N, Chatterjee N, Gillanders EM, Chanock SJ, Wang SS. Joint effects between five identified risk variants, allergy, and autoimmune conditions on glioma risk. Cancer Causes Control. 2013;24:1885–1891. doi: 10.1007/s10552-013-0244-7. [DOI] [PMC free article] [PubMed] [Google Scholar]
- 15.Porcu E, Sanna S, Fuchsberger C, Fritsche LG. Genotype imputation in genome-wide association studies. Curr Protoc Hum Genet. 2013;Chapter 1:1–25. doi: 10.1002/0471142905.hg0125s78. [DOI] [PubMed] [Google Scholar]
- 16.Gao X, Mi Y, Yan A, Sha B, Guo N, Hu Z, Zhang N, Jiang F, Gou X. The PHLDB1 rs498872 (11q23.3) polymorphism and glioma risk: A meta-analysis. Asia Pac J Clin Oncol. 2015;11:e13–21. doi: 10.1111/ajco.12211. [DOI] [PubMed] [Google Scholar]
- 17.Huang LM, Shi X, Yan DF, Zheng M, Deng YJ, Zeng WC, Liu C, Lin XD. Association Between ERCC2 Polymorphisms and Glioma Risk: a Meta-analysis. Asian Pac J Cancer Prev. 2014;15:4417–4422. doi: 10.7314/apjcp.2014.15.11.4417. [DOI] [PubMed] [Google Scholar]
- 18.Zhao W, Bian Y, Zhu W, Zou P, Tang G. Regulator of telomere elongation helicase 1 (RTEL1) rs6010620 polymorphism contribute to increased risk of glioma. Tumour Biol. 2014;35:5259–5266. doi: 10.1007/s13277-014-1684-8. [DOI] [PubMed] [Google Scholar]
- 19.Wrensch M, Jenkins RB, Chang JS, Yeh RF, Xiao Y, Decker PA, Ballman KV, Berger M, Buckner JC, Chang S, Giannini C, Halder C, Kollmeyer TM, Kosel ML, LaChance DH, McCoy L, O’Neill BP, Patoka J, Pico AR, Prados M, Quesenberry C, Rice T, Rynearson AL, Smirnov I, Tihan T, Wiemels J, Yang P, Wiencke JK. Variants in the CDKN2B and RTEL1 regions are associated with high-grade glioma susceptibility. Nat Genet. 2009;41:905–908. doi: 10.1038/ng.408. [DOI] [PMC free article] [PubMed] [Google Scholar]
- 20.Bahuau M, Vidaud D, Jenkins RB, Bièche I, Kimmel DW, Assouline B, Smith JS, Alderete B, Cayuela JM, Harpey JP, Caille B, Vidaud M. Germ-line deletion involving the INK4 locus in familial proneness to melanoma and nervous system tumors. Cancer Res. 1998;58:2298–2303. [PubMed] [Google Scholar]
- 21.Randerson-Moor JA, Harland M, Williams S, Cuthbert-Heavens D, Sheridan E, Aveyard J, Sibley K, Whitaker L, Knowles M, Bishop JN, Bishop DT. A germline deletion of p14(ARF) but not CDKN2A in a melanoma-neural system tumour syndrome family. Hum Mol Genet. 2001;10:55–62. doi: 10.1093/hmg/10.1.55. [DOI] [PubMed] [Google Scholar]
- 22.Simon M, Voss D, Park-Simon TW, Mahlberg R, Köster G. Role of p16 and p14ARF in radio- and chemosensitivity of malignant gliomas. Oncol Rep. 2006;16:127–132. [PubMed] [Google Scholar]
- 23.Srivastava K, Srivastava A. Comprehensive review of genetic association studies and meta-analyses on miRNA polymorphisms and cancer risk. PLoS One. 2012;7:e50966. doi: 10.1371/journal.pone.0050966. [DOI] [PMC free article] [PubMed] [Google Scholar]
- 24.Jiang L, Fang X, Bao Y, Zhou JY, Shen XY, Ding MH, Chen Y, Hu GH, Lu YC. Association between the XRCC1 Polymorphisms and Glioma Risk: A Meta-Analysis of Case-Control Studies. PLoS One. 2013;8:e55597. doi: 10.1371/journal.pone.0055597. [DOI] [PMC free article] [PubMed] [Google Scholar]


