

Abstract
The perinatal outcomes of pregnancies with nuchal cord (NC) are uncertain and reports disagree about the incidence of cesarean section due to NC. Variable tightness of the NC may be a contributor to this controversy. The study was to examine whether the tightness of NC affect fetal intrauterine distress by determining valuable ultrasonic indicators. Total 149 singleton pregnancies between 36 and 41 weeks without pregnancy complications were recruited. The pregnant women, whose fetuses have NC, formed the study group and the others made up the control group. The ratio of peak systolic velocity and end diastolic velocity (S/D), pulsatility index (PI) of fetal umbilical artery (UA), middle cerebral artery (MCA) and renal artery (RA) were examed by ultrasound. We found that mean levels of S/D and PI of RA and the incidence of fetal distress and intervention rate during delivery were higher in the study group than those in control group (p<0.05). In contrast, the levels of RI of RA and flow spectrum parameters of UA and MCA showed no difference between the two groups (p>0.05). In addition, as compared with the control group, the mean levels of S/D and PI of RA, S/D of UA were higher in the tight subgroup (p<0.05). The S/D of UA and S/D, PI of RA were increased with D and A1/A, but there were no significant correlations between D or A1/A and fetal distress in study group. In summary, NC affects the level of flow spectrum parameters of RA and UA, especially in tight NC cases, which increases the rate of fetal intrauterine distress. A1/A% and D are valuable ultrasonographic indicator to describe the tightness of NC and predict the fetal hemodynamics, but they could not predict the fetal distress in our study.
Keywords: Nuchal cord, tightness, ultrasonography, fetal intrauterine distress, renal artery, umbilical artery, middle cerebral artery
Introduction
Umbilical cord entanglement around the fetal neck is called nuchal cord (NC), which can be easily detected during prenatal ultrasound examination [1-3]. The perinatal outcomes of pregnancies with NC are uncertain and reports disagree about the incidence of cesarean section due to NC. Although it does not influence the perinatal outcome in most cases [4-7], some reports were opposite [8-10]. Variable tightness of the NC may be a contributor to this controversy. As the tightness of NC was usually judged by midwife or Obstetrician during delivery [3,4], so we need a quantitative indicator of tightness of NC to make the prenatal diagnosis. We believe that identification of tightness of nuchal cord prenatally may alert the obstetrician to potential problems. Therefore, we designed a prospective, comparative study to find some useful ultrasonic indicators to quantitatively analyze the tightness of NC and to examine if the fetus with NC has a greater risk for fetal distress and operative interventions during labor and delivery and whether the outcome is affected by the tightness of NC.
Material and methods
Study design
In this prospective and comparative study, we performed serial ultrasounds on 149 women with a singleton pregnancy attending the department of Obstetrics at Obstetrics and Gynecology Hospital of Fudan University, Shanghai, China from April to November 2012. The study was approved by the Ethics Committee of the institution and all the subjects were given oral informed consent.
The 149 singletons pregnancies between 36 and 41 weeks’ gestation, calculated from the date of the last menstrual period without pregnancy complications were enrolled in the study and were analyzed for the presence and the tightness of NC, the ratio of peak systolic velocity and end diastolic velocity (S/D), resistance index (RI) and pulsatility index (PI) of fetal umbilical artery (UA), middle cerebral artery (MCA) and renal artery (RA) by ultrasonography before delivery and intrapartum complications and perinatal outcome (Figure 1).
Figure 1.
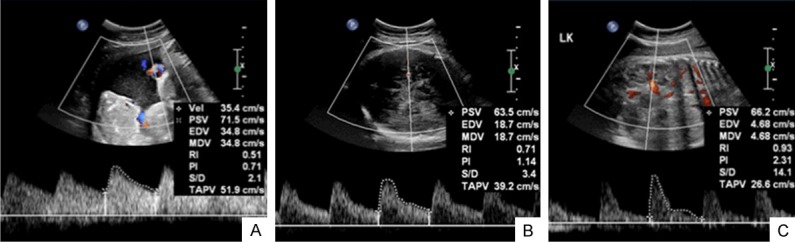
The flow spectrum of the UA (A), MCA (B) and RA (C) of a 38 gestational weeks fetus.
The patients were examined with gray scale 2D image and color Doppler (VOLUSON E8 or 730 Expert GE, USA; IU22, Philips, USA) for the diagnosis of a nuchal cord. Specially trained doctors of ultrasonographer, not engaged in the care of the patients, performed the examinations. Longitudinal and transverse sonographic sections of the fetal neck were obtained and the presence of a single NC was noted. Nuchal cord was definitely displaced if umbilical coils were visible around at least three quarters of the fetal neck in longitudinal imaging. Eighty-two cases with nuchal cord before delivery were taken as study group and 67 cases without nuchal cord served as control group. Observed the loop of the umbilical cord around the fetal neck, chose the cross-section of the cord at the deepest impression of NC, made a connecting line between the two sides of skin edges around cord. Measured the depth from the line to the deepest edge of the impression (D) and measured the area of the cord under the line as A1 and the area of the impression as A, calculated the proportion of A1 in A (Figure 2). According to the median of D or A1/A, study group was divided into two subgroups: tight group and the loose group. The sonographic variables before delivery and outcome variables between the two groups were compared. Outcome variables used were fetal intrauterine distress (judged by meconium staining of liquor, intrapartum fetal heart rate (FHR) irregularities, abnormal fetal movement and Apgar score <7 at 1 minute) and rate of instrumental and caesarean delivery.
Figure 2.
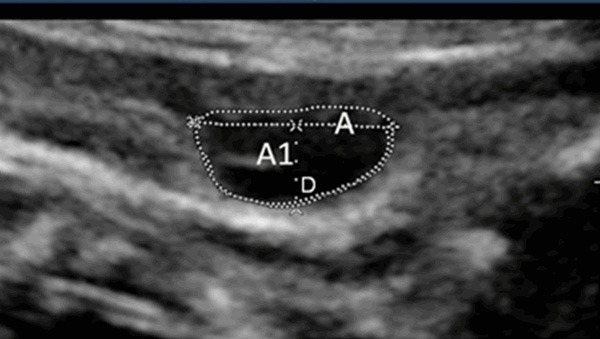
Cross-section of the cord at the impression of fetal neck (D: Depth from the line to the deepest edge of the impression; A1: The area of the cord under the line; A: The area cross-section of the cord).
Statistical analysis
Statistical analysis was performed with SPSS version 17.0 software for Windows (SPSS Inc, Chicago, IL, USA). Descriptive statistics were given as mean, standard deviation, frequency and percentage. Statistical analysis was performed with the unpaired Student t test or LSD and SNK methods of analysis of variance for continuous variables and the chi-square test for categorical variables. Statistical significance was defined as P<0.05.
Results
The general characteristics, ultrasonographic flow spectrums and outcomes of two groups
Data from 149 patients, of whom 82 were in the study group (with one loop of nuchal cord) and 67 in the control group (without nuchal cord), were analyzed. There were no significant differences between the two groups in relation to age, gestational weeks (P>0.05) (Table 1).
Table 1.
The general characteristics, ultrasonographic flow spectrums and outcomes of two groups
| Study group (n=82) | Control group (n=67) | P | ||
|---|---|---|---|---|
| Age (year) | 29.06±3.42 | 28.83±3.10 | 0.675 | |
| Gestational weeks | 38.47±1.12 | 38.36±1.10 | 0.473 | |
| UA | PI | 0.816±0.171 | 0.796±0.163 | 0.46 |
| RI | 0.548±0.074 | 0.534±0.065 | 0.23 | |
| S/D | 2.26±0.36 | 2.172±0.29 | 0.09 | |
| MCA | PI | 1.44±0.315 | 1.40±0.325 | 0.486 |
| RI | 0.74±0.086 | 0.73±0.086 | 0.405 | |
| S/D | 4.14±1.68 | 4.06±1.61 | 0.767 | |
| RA | PI | 1.921±0.440 | 1.826±0.332 | 0.049* |
| RI | 0.81±0.182 | 0.80±0.064 | 0.564 | |
| S/D | 6.43±3.24 | 5.62±2.14 | 0.036* | |
| Fetal distress | (+) | 26 | 11 | 0.032* |
| (-) | 56 | 56 | ||
| Intervention | (+) | 16 | 5 | 0.035* |
| (-) | 66 | 62 | ||
| Caesarean delivery | (+) | 35 | 32 | 0.535 |
| (-) | 47 | 35 | ||
Data are presented as mean ± SD.
P<0.05 statistically significant.
The PI and S/D of RA was 1.921±0.440 and 6.43±3.24, respectively, in the study group, while these values for the control group were 1.826±0.332 and 5.62±2.14, respectively (P<0.05). The RI of RA and flow spectrum parameters of UA and MCA showed no difference between the two groups (P>0.05) (Table 1).
Although there were significant differences in the fetal distress and intervention rate during the delivery between the two groups (P<0.05), there was no significant difference between the groups in the rate of caesarean delivery (P>0.05) (Table 1).
The effect of tightness of NC on the flow spectrum parameters of UA, MCA and RA
The median of the D was 6.5 mm. According to the median, study group was divided into two subgroups: tight group and the loose group. There were significant differences in the PI, RI and S/D of UA, PI and S/D of RA between tight group and control group, as shown in Table 2 (P<0.05). The correlation between those variables and D was studied by scatter plot and regression analysis (Figure 3).
Table 2.
The ultrasonographic flow spectrums of three groups according to the median of D
| Study group (n=82) | Control group (n=67) | P | |||||
|---|---|---|---|---|---|---|---|
|
|
|
||||||
| Tight (n=41) | Loose (n=41) | P1 (T Vs C) | P2 (L Vs C) | P3 (T Vs L) | |||
| UA | PI | 0.872±0.159 | 0.761±0.165 | 0.796±0.163 | 0.0195* | 0.282 | 0.00268* |
| RI | 0.576±0.064 | 0.520±0.073 | 0.534±0.065 | 0.00165* | 0.302 | 0.000471* | |
| S/D | 2.341±0.315 | 2.121±0.338 | 2.172±0.29 | 0.000145* | 0.409 | 0.00015* | |
| MCA | PI | 1.398±0.273 | 1.480±0.350 | 1.40±0.325 | 0.943 | 0.457 | 0.247 |
| RI | 0.736±0.092 | 0.744±0.081 | 0.73±0.086 | 0.650 | 0.351 | 0.694 | |
| S/D | 3.835±1.336 | 4.440±1.926 | 4.06±1.61 | 0.460 | 0.268 | 0.103 | |
| RA | PI | 1.997±0.496 | 1.834±0.352 | 1.826±0.332 | 0.0029* | 0.829 | 0.00461* |
| RI | 0.808±0.115 | 0.824±0.216 | 0.80±0.064 | 0.555 | 0.246 | 0.354 | |
| S/D | 6.850±3.468 | 5.710±2.345 | 5.62±2.14 | 0.00174* | 0.785 | 0.00420* | |
Data are presented as mean ± SD.
P<0.05 statistically significant.
Figure 3.

The scatter plot and regression linear of flow spectrum variables along with D. The median of the A1/A was 53.77%. According to the median, study group was divided into two subgroups: tight’ group and the loose’ group. There were significant differences in the S/D of UA, PI and S/D of RA between tight group and control group as shown in Table 3 (P<0.05). The correlation between those variables and A1/A was studied by scatter plot and regression analysis (Figure 4).
The median of the A1/A was 53.77%. According to the median, study group was divided into two subgroups: tight’ group and the loose’ group. The S/D of UA between tight’ group and control group, PI and S/D of RA between tight’ group and control group, tight’ group and loose’ group showed significant differences in Table 3 (P<0.05). The correlation between those variables and A1/A was studied by scatter plot and regression analysis (Figure 4).
Table 3.
The ultrasonographic flow spectrums of three groups according to the median of A1/A
| Study group (n=82) | Control group (n=67) | P | |||||
|---|---|---|---|---|---|---|---|
|
|
|
||||||
| Tight’ (n=41) | Loose’ (n=41) | p1 (T’ Vs C) | p2 (L’ Vs C) | p3 (T’ Vs L) | |||
| UA | PI | 0.841±0.189 | 0.792±0.149 | 0.796±0.163 | 0.196 | 0.901 | 0.199 |
| RI | 0.552±0.078 | 0.543±0.069 | 0.534±0.065 | 0.195 | 0.488 | 0.584 | |
| S/D | 2.310±0.374 | 2.22±0.334 | 2.172±0.29 | 0.0363* | 0.440 | 0.255 | |
| MCA | PI | 1.412±0.294 | 1.466±0.336 | 1.40±0.325 | 0.878 | 0.332 | 0.445 |
| RI | 0.737±0.097 | 0.743±0.075 | 0.73±0.086 | 0.624 | 0.364 | 0.757 | |
| S/D | 3.929±1.601 | 4.346±1.741 | 4.06±1.61 | 0.687 | 0.381 | 0.262 | |
| RA | PI | 1.998±0.509 | 1.836±0.336 | 1.826±0.332 | 0.003* | 0.814 | 0.0189* |
| RI | 0.813±0.107 | 0.819±0.219 | 0.80±0.064 | 0.286 | 0.377 | 0.843 | |
| S/D | 6.931±3.477 | 5.646±2.311 | 5.62±2.14 | 0.0009* | 0.946 | 0.00677* | |
Data are presented as mean ± SD.
P< 0.05 statistically significant.
Figure 4.

The scatter plot and regression linear of flow spectrum variables along with A1/A.
From Figures 3 and 4, it was shown that the S/D of UA and S/D, PI of RA were increased with D and A1/A. These flow spectrum variables were severed as state variables, D and A1/A were made as test variables to make a receiver operating characteristic (ROC). The area under the green line is 0.784 cm2. When D is 5.485 mm, the sensitivity and the specifity of predicting the changes of fetal hemodynamics were 76.0%, 73.0%, respectively. The area under the blue line is 0.760 cm2. When A1/A is 27.22%, the sensitivity of predicting the changes of fetal hemodynamics is 86.8% and the specifity of it is 64.9% (Figure 5).
Figure 5.
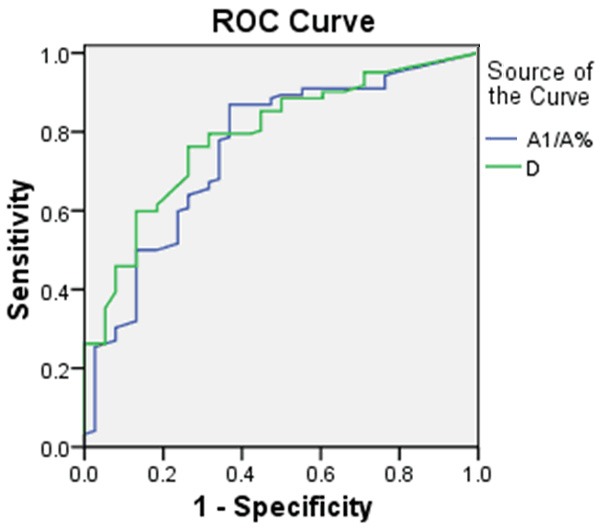
The ROC of A1/A and D of umbilical cord impression.
The effect of tightness of NC on the fetal distress in study group
According to the fetal distress, the pregnancies in study group were divided into two groups: fetal distress group and non-fetal distress group. The D and A1/A% showed no significant differences between the two groups (P>0.05) (Table 4). The fetal distress was severed as state variables, D and A1/A% were made as test variables to make a ROC. The area under the green line is 0.465 cm2. When D is 5.485 mm, the sensitivity of predicting fetal distress is 38.5% and the specifity of it is 67.9%.The area under the blue line is 0.528 cm2. When A1/A% is 27.22%, the sensitivity of predicting the fetal distress is 55.95% and the specifity of it is 58.9% (Figure 6).
Table 4.
The D and A1/A% of study group according to the fetal distress
| Distress group (n=26) | Non-distress group (n=56) | P | |
|---|---|---|---|
| D | 6.067±2.358 | 6.154±3.034 | 0.9021 |
| A1/A% | 47.380±26.519 | 45.774±24.366 | 0.7910 |
Data are presented as mean ± SD and number.
Figure 6.
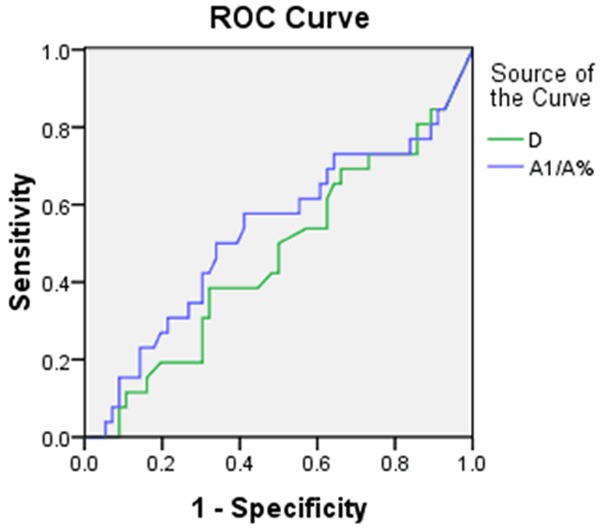
The ROC of A1/A% and D of umbilical cord impression.
Discussion
The association of nuchal cords with adverse perinatal events is controversial. Although nuchal cord during delivery has been associated with increased risk of adverse perinatal outcome, the magnitude of the risk seems small and most of the babies born with nuchal cord are not affected [4,6,10-12]. The results of our prospective study clearly demonstrated higher mean PI and S/D of RA and incidence of fetal distress and intervention in the nuchal cord group as compared with controls without nuchal cord. In addition, there was no difference in MCA or UA Doppler flow velocimetry and caesarean delivery of two groups, which was in concordance with a previous study [12].
At present there is no consensus on the management of fetuses with a sonographic diagnosis of a nuchal cord. In a few cases, sonographic demonstration of a nuchal cord in association with other abnormal tests of fetal well-being has been considered to be an indication for intervention. The controversy may be associated with tight or loose NC. Dhar et al [11] reported that the incidences of fetal distress, a prolonged second stage of labor, non-toxemic accidental hemorrhage, and operative delivery were more common in cases of tight NC entanglement than those in loose cases or absent NC, and loose NC entanglement is not associated with adverse effects. In previous studies, nuchal cords were usually subjectively classified as tight or loose before or during delivery [3,4,11], which can be affected by personal preference. To define the tightness of NC objectively in this study, we chose two sonographic parameters, D and A1/A, to describe NC, which made a prenatal quantitative evaluation of tightness of the nuchal cord by the sonography Moreover, as compared with the previous reports, our study was distinguished by its objective quantitative indicators of tightness of nuchal cord. We found that the S/D of UA and S/D, PI of RA were increased with D and A1/A. In tight group, there were significant increased PI and/ or S/D of the UA and RA. After the control group was divided into tight group and loose group, more differences in spectral Doppler were found between three groups, which means that the D and A1/A was associated with the tightness of NC. When D is 5.485 mm or A1/A is 27.22%, the sensitivity and specificity of predicting the changes of fetal hemodynamics is good. The spectral Doppler findings may appear before the onset of adverse and potentially irreversible effects on the fetus. The D and A1/A might have somewhat improved predictive potential.
However, we found no significant correlations between D or A1/A and fetal distress in study group. Even in non-distress cases, the D was a little higher than in distress cases. The A1/A was a little lower in non-distress cases than in distress cases, but there was no significance. The sensitivity and specificity of D and A1/A to predicting the fetal distress is not good. Why? It is noteworthy to point out that the present study has some limitations. First, the tightness of the nuchal cord may change with time, especially if the fetal head is not fully engaged in the pelvis at the time of examination. Rotation during labor may also further change the tightness and thus reduce the importance of that finding. Secondly, sample size might have been too small to detect a true difference between the groups, especially when compared in the study group according to the fetal distress. These results need to be confirmed in lager sample size to detect significant differences. Moreover, detection of nuchal cord by ultrasound might lead to anxiety and frustration in both parturient and caregiver, which may affect the sonographic findings and pregnancy outcome.
In conclusion, the presence of nuchal cord increased PI and S/D of RA and fetal distress and intervention rate, but did not increase caesarean delivery rate. The D and A/A1 were valuable objective quantitative ultrasonographic indicators to predict the fetal hemodynamics, but they could not predict the fetal distress in our study. Since the number of patients in our study is limited and there is no previous study about quantitative ultrasonographic indicator to describe the nuchal cord, it is necessary to confirm the results in larger series.
Disclosure of conflict of interest
None.
References
- 1.Nkwabong E, Kenla A, Fomulu JN. Two-dimensional ultrasonography in the assessment of nuchal cord. J Obstet Gynaecol India. 2013;63:120–122. doi: 10.1007/s13224-012-0273-2. [DOI] [PMC free article] [PubMed] [Google Scholar]
- 2.Hanaoka U, Yanagihara T, Tanaka H, Hata T. Comparison of three-dimensional, two-dimensional and color Doppler ultrasound in predicting the presence of a nuchal cord at birth. Ultrasound Obstet Gynecol. 2002;19:471–474. doi: 10.1046/j.1469-0705.2002.00670.x. [DOI] [PubMed] [Google Scholar]
- 3.Qin Y, Wang CC, Lau TK, Rogers MS. Color ultrasonography: a useful technique in the identification of nuchal cord during labor. Ultrasound Obstet Gynecol. 2000;15:413–417. doi: 10.1046/j.1469-0705.2000.00113.x. [DOI] [PubMed] [Google Scholar]
- 4.Henry E, Andres RL, Christensen RD. Neonatal outcomes following a tight nuchal cord. J Perinatol. 2013;33:231–234. doi: 10.1038/jp.2012.79. [DOI] [PubMed] [Google Scholar]
- 5.Shrestha NS, Singh N. Nuchal cord and perinatal outcome. Kathmandu Univ Med J (KUMJ) 2007;5:360–363. [PubMed] [Google Scholar]
- 6.Sheiner E, Abramowicz JS, Levy A, Silberstein T, Mazor M, Hershkovitz R. Nuchal cord is not associated with adverse perinatal outcome. Arch Gynecol Obstet. 2006;274:81–83. doi: 10.1007/s00404-005-0110-2. [DOI] [PubMed] [Google Scholar]
- 7.Kong CW, Chan LW, To WW. Neonatal outcome and mode of delivery in the presence of nuchal cord loops: implications on patient counselling and the mode of delivery. Arch Gynecol Obstet. 2015;292:283–9. doi: 10.1007/s00404-015-3630-4. [DOI] [PubMed] [Google Scholar]
- 8.Bernad ES, Craina M, Tudor A, Bernad SI. Perinatal outcome associated with nuchal umbilical cord. Clin Exp Obstet Gynecol. 2012;39:494–497. [PubMed] [Google Scholar]
- 9.Narang Y, Vaid NB, Jain S, Suneja A, Guleria K, Faridi MM, Gupta B. Is nuchal cord justified as a cause of obstetrician anxiety? Arch Gynecol Obstet. 2014;289:795–801. doi: 10.1007/s00404-013-3072-9. [DOI] [PubMed] [Google Scholar]
- 10.Assimakopoulos E, Zafrakas M, Garmiris P, Goulis DG, Athanasiadis AP, Dragoumis K, Bontis J. Nuchal cord detected by ultrasound at term is associated with mode of delivery and perinatal outcome. Eur J Obstet Gynecol Reprod Biol. 2005;123:188–192. doi: 10.1016/j.ejogrb.2005.02.026. [DOI] [PubMed] [Google Scholar]
- 11.Dhar KK, Ray SN, Dhall GI. Significance of nuchal cord. J Indian Med Assoc. 1995;93:451–453. [PubMed] [Google Scholar]
- 12.Aksoy U. Prenatal color Doppler sonographic evaluation of nuchal encirclement by the umbilical cord. J Clin Ultrasound. 2003;31:473–477. doi: 10.1002/jcu.10211. [DOI] [PubMed] [Google Scholar]