

Abstract
To investigate the brain delivery in rat by nasal Quetiapine fumarate (QF) loaded with solid lipid nanoparticles in situ gel (QF-SLN-gel). QF-SLN-gel was prepared through micro-emulsion technique. The rat model of schizophrenia was established by intraperitoneal injection of (+)-MK-801, evaluated by stereotypic behavior, Mori’s Water Maze (MWM) test and hematoxylin and eosin (HE) staining of hippocampus. The animals were administrated with QF via oral, nasal or tail vein approach and the concentration of QF in blood and brain was determined using high performance liquid chromatography (HPLC). The QF-SLN-gel was even and transparent, having size of 117.8±2.67 d.nm, potential of 57.2±0.24 mV and EF of 97.6±0.58%. After administration of QF-SLN-gel, the concentration of QF in blood and brain of rats in nasal QF-SLN-gel group was similar with that of rats in tail vein QF group, but significantly higher than that of rats in oral QF group. The hippocampal morphology changes induced by (+)-MK-801 were ameliorated by QF, with advantage of nasal QF-SLN-gel over tail vein QF. The nasal QF-SLN-gel had stable and good brain delivery and could ameliorate the damages in rat model of schizophrenia induced by (+)-MK-801.
Keywords: Quetiapine fumarate, solid lipid nanoparticles, in situ gel, schizophrenia, brain targeting
Introduction
Quetiapine fumarate (QF), a new non-classic antipsychotic, is proved by many studies to be safe and effective in clinic. QF interacts with multiple neurotransmitters such as 5-HT2, D1, D2 and D4 [1]. Because of its fast action, low side effects of parapyramidal system and weak physical discomfort, QF has become the first-line medication for schizophrenia and bipolar disorder [2,3]. However, QF is usually delivered by oral administration in clinic, which at least in a certain extent reduces its bioavailability due to the first-pass effect. Recently, solid lipid nanoparticle in situ gel (SLN-gel) is developed as a carrier for nasal delivery of medication [4-6]. This new approach can increase the adhesion duration of medications in nasal mucosa, directly deliver medications to the brain bypassing the blood-brain-barrier, and therefore can reduce the first-pass effect and increase the concentration of medications in the brain. These features can reduce the dosage and side effect of medications. In order to achieve nasal delivery of QF, reduce the dosage while maintain high effect, stable concentration and brain targeting, we prepared nasal QF-SLN-gel and examined its brain delivery in rat model of schizophrenia.
Establishment of animal model is an important strategy for study of schizophrenia and antipsychotics; amongst, drug induction is one of the promising methods. By using (+)-MK-801, Si et al developed glutamate-deficiency model in primate and verified its reliability for schizophrenia study [7]. In the present study, we employed the model in rats by intraperitoneal injection (0.6 mg/kg, daily for 4 consecutive days) of (+)-MK-801 and assessed its reliability using stereotypic behavior and Morris water maze (MWM) test. We examined the morphology change of rats through Hematoxylin and eosin (HE) staining of the hippocampus and studied the brain delivery of nasal QF-SLN-gel in rat model of schizophrenia.
Materials and methods
Apparatus and chemicals
The equipments used in the present study included high pressure liquid chromatography (HPLC, LC-15AC, Shimadzu, Japan), high pressure homogenizer (JN-02HC, Guangzhou JNBio, China), Zetasizer (Nano-ZS9, Malvern Instruments Limited, UK), Water purifying system (Milli-Q Advantage A10, Molecular Device (Shanghai), China), low temperature centrifuge (AllegraTM X-22R, Germany); MWM AV system (Huaibei Zhenghua Biological Equipment Co. Ltd., China). The major chemicals used in the present study included: (+)-MK-801 hydrogen maleate (Sigma, USA), QF (Wuhan Dawei Medical & Chemical Industry Co. Ltd, China). Other chemicals included carboxymethylcellulose sodium, sodium chloride, glycerol monostearate, span-80, butanol, poloxamer-407 (P407), poloxamer-188 (P188), methanol, methyl cyanide, trimethylamine, glacial acetic acid.
Preparation and optimization of SLN-gel
The SLN prescription was optimized through the ternary phase diagram [8]. The nano emulsion was prepared by mixing the heat-melting glycerol monostearate, span-80, butanol and purified water at different proportions of span-80/butanol (K m, at 1:9, 2:8, 3:7, 4:6, 5:5, 6:4, 7:3, 8:2 and 9:1) to choose 3 good prescriptions, according to which to make SLN suspension with repetitive cycling under 1200bar and cooling. The particle diameter was measured with Zetasizer to further optimize the prescription which was verified with methylthionine chloride and magdala red [9].
Preparation and identification of QF-SLN-gel
According to the optimized prescription, 1 g QF was mixed with glycerol monostearate, span-80, butanol and purified water. Mild stirring for 30 s would form transparent and clear W/O emulsion which was treated with homogenizer repetitively under 1200bar and then cooled to harvest QF-SLN suspension.
The thermosensitive in situ gel was prepared with cold dissolving method [4]. In brief, a variety of quantity of P407 and P188 were put into suitable volume of purified water and maintained in 4°C for over 24 h, then slightly vortexed to obtain transparent homogenous blank gel. Some blank gel was transferred to a glass tube and warmed in thermostat water bath for 10 min, followed by heating the water bath with speed of 0.5°C/min. Then the tube was tilted 45° every 5 s till the gel was immobile, of which the temperature was phase-transition temperature [10]. Each sample was repeated 3 times to get the mean of phase-transition temperature. The phase-transition temperature was measured at different volume of P407 and P188 to determine the best prescription suitable for nasal drug delivery according to the central composite design-response surface methodology.
Based on preliminary data, the concentrations of P407 and P188 (X1 and X2 respectively, %, w/w) were determined as 2 factors having significant influence on the temperature of gel and ranging as X1: 20~26, X2: 0~10. According to the central composite design-response surface methodology [11], 10 g gel was prepared to design the factor-level table (Table 1) and experiment table (Table 2).
Table 1.
Factor levels of central composite design
| Level of factor | -1.414 | -1 | 0 | 1 | 1.414 |
|---|---|---|---|---|---|
| P407 (X1, %) | 20 | 20.88 | 23 | 25.12 | 26 |
| P188 (X2, %) | 0 | 1.47 | 5 | 8.54 | 10 |
Table 2.
Experimental result of central composite design
| Group# | X1 | X2 | X1 (g) | X2 (g) | T (°C) |
|---|---|---|---|---|---|
| 1 | +1 | +1 | 2.512 | 0.854 | 25.2±0.42 |
| 2 | +1 | -1 | 2.512 | 0.147 | 20.4±0.21 |
| 3 | -1 | +1 | 2.088 | 0.854 | 35.9±0.47 |
| 4 | -1 | -1 | 2.088 | 0.147 | 30±0.78 |
| 5 | 1.414 | 0 | 2.6 | 0.5 | 20.5±0.35 |
| 6 | -1.414 | 0 | 2.0 | 0.5 | 36.3±0.06 |
| 7 | 0 | 1.414 | 2.3 | 1.0 | 33.6±0.11 |
| 8 | 0 | -1.414 | 2.3 | 0 | 23.5±0.51 |
| 9~13 | 0 | 0 | 2.3 | 0.5 | 27.8±0.25 |
The QF-SLN-gel was obtained by stirring the mixture of QF-SLN and blank gel till complete dissolution. A drop of diluted QF-SLN suspension and QF-SLN-gel with purified water was added to a copper mesh covered with carbon membrane. Then phosphate-tungstic acid was added for staining at room temperature. The morphology of QF-SLN and QF-SLN-gel was observed after dry with high resolution transmission electron microscopy. The optimized QF-SLN and QF-SLN-gel were diluted (1:20) with purified water and then was measured the size and potential with Zetasizer.
Encapsulation of QF-SLN
Under chromatograph [12], the specificity, precision, recycle rate and standard curve of the strategy were verified. The linear range of QF concentration was 2.07~198.8 μg/ml, and the quantity was set as 2.07 μg/mL.
Nanoparticle suspension (40 μL) was put in a super-centrifuge tube with addition of 4 mL methanol in bottom for centrifugation at 4000 r/min for 30 min. Then the supernatant was taken out for measurement of peak area which was substituted in the regression equation to calculate the concentration of free drug. Then, the encapsulation efficiency (EE, %) of nanoparticles was calculated according to the equation: EE = [(W total - W measured)/W total] ×100%, where Wmeasured was the quantity of nanoparticles in supernatant and W total was the total quantity of nanoparticles.
Rat model of schizophrenia induced by (+)-MK-801
Adult SD rats (200±20 g) were randomly divided into normal group (n = 20) and schizophrenia group (n = 54). According to literatures [13-15], rats in schizophrenia group received 0.6 mg/kg (+)-MK-801 through intraperitoneal injection (ip) daily for consecutively 4 days while rats in normal group received same volume saline (ip).
The rat model was assessed with stereotypic behavior and MWM test. According to the criteria of literatures [15,16], the stereotypic behaviors of animals were monitored every 10 min for 60 min to get the mean value. The stereotypic behavior score ≥2 with length of ≥15 min was considered as success of animal model. The assessment was performed by 2 trained persons who were not aware of the animal grouping. The MWM was used to test the capability of place navigation and spatial probe of animals. At the morning and afternoon of experiment days, the rat was put facing the water wall into the pool from 4 different spots of different quadrants. The time from water-entry to finding the hidden platform under water was recorded as escape latency (EL), and the rat was allowed to stay on the platform for 10 s. If the rat failed to find the platform, the EL was recorded as 60 s and the rat was manually put on the platform for staying of 10 s. The interval between 2 trials was 30 min and the trial was performed for 4 consecutive days. At day 5, the platform was removed and the rat was put into water from the opposite spot to the target quadrant where the platform was originally located. The swimming path, number of platform position crossing, time spent in target quadrant, rate of animals crossing platform position and latency for first time reaching the platform position were recorded.
Brain delivery of nasal QF-SLN-gel
After behavior experiments, the rats in schizophrenia group were further divided into oral QF group receiving oral administration of QF (n = 18), tail vein QF group receiving QF via tail vein administration (n = 18) and nasal QF-SLN-gel group receiving QF-SLN-gel via nasal deliver (n = 18). The dosage was 40 mg/kg body weight, which was based on previous study showing that the t max of QF was 40.00±8.66 min [12]. Blood samples were taken before (+)-MK-801 injection (0h), 15 min, 45 min and 75 min after administration of QF or QG-SLN-gel. The blood samples were transferred to heparin pre-treated 1.5 ml EP centrifuge tubes and centrifuged at 4000 r/min for 15 min. The plasma layer was taken out and stored in -20°C for future experiments. The prefrontal cortex, cerebellum, hippocampus and pituitary were homogenized, stored in 4°C for 0.5 h and centrifuged at 4°C, 4000 r/min for 15 min. The supernatant was transferred and stored at -20°C for future experiments.
After rinse with saline on ice and dry with filter paper, the brain tissues/blood samples were homogenized with 9-fold volume of saline in ice bath. The homogenate was centrifuged at 4°C and 4000 r/min for 15 min. Then 1.25 mg raw QF was completely dissolved in methanol with final volume of 25 ml to make 9.7 μg/ml control solution which was stored in 4°C for future experiments. Then, 200 μl homogenate was transferred to a centrifuge tube which was added 20 μl internal standard solution (7.851 μg/ml) and dried with nitrogen. After 30 s vortex, 400 μl methyl cyanide was added and the mixture was vortexed 3 min again followed by centrifuge at 4000 r/min for 10 min. The supernatant was extracted to calculate the concentration of QF, using the internal standard method. The samples including blank brain homogenate, blank brain homogenate + blank control solution, blank control solution + internal standard solution, brain homogenate + internal standard solution were measured with HPLC. Different concentrations of QF at 0.259, 1.035, 2.071, 4.142, 16.567 and 49.7 μg/ml were made by adding 200 μl blank brain homogenate to blank control solution and measured with HPLC. The concentration of QF was used as x axis and the rate of peak area of QF/peak area of internal standard solution was used as y axis to make standard curve and regression equation. The procedure was repeated daily for 3 days to measure the concentration and quantity of QF in brain.
Different concentrations of QF at 0.518, 8.283 and 33.133 μg/mL were made by adding 200 μl blank brain homogenate to control solution and measured with HPLC to calculate the methodological and extraction recovers, according to internal standard method. The measurement was repeated 6 times in a day to assess the intra-daily precision and consecutively 3 days to assess the inter-daily precision.
Brain tissues containing QF at 0.518 and 33.133 μg/mL made by adding 200 μl blank brain homogenate to control solution were incubated at room temperature for 8 h, in automatic sampler for 12 h, 4°C for 30 h, repetitive freeze/thawing for 3 times, and -20°C for 9 and 21 d to assess the stability of brain samples.
HE staining of hippocampus
At day 4, the hippocampi of some rats were taken out after administration of saline, oral QF-SLN or nasal QF-SLN-gel and stained with HE. Under microscopy, the tissues were observed under microscopy for cellular arrange, hierarchical structure, soma, nuclei, and nucleoli morphology [14].
Statistical analysis
The data were expressed as mean ± SD and the statistical analysis was performed with t-test using SSPS17.0. In central composite design, statistical analysis was performed using the software of Design expert and T was selected as a factor to perform binominal regression of other factors. The equation was:
T = 95.09227-3.86601X1 + 1.54719X2 - 0.036695X1X2 + 0.033375X1 2 + 0.018005X2 2, where X1 represented P407 where X2 represents P188.
Results
Preparation of SLN and SLN-gel
According to the ternary phase diagrams, the nanoparticles were formed at different Km and had maximal arrange when Km = 1:9 (Figure 1), from which 3 prescriptions were chosen for further experiments. The nanoparticle size was 307.1±17.7 d.nm for prescription 1, 117.8±2.666 d.nm for prescription 2 and 424.7±22.24 d.nm for prescription 3, respectively. After further optimization and verification, prescription 2 resulting in the most even and smallest particle diameter was selected for future experiments (Table 3).
Figure 1.
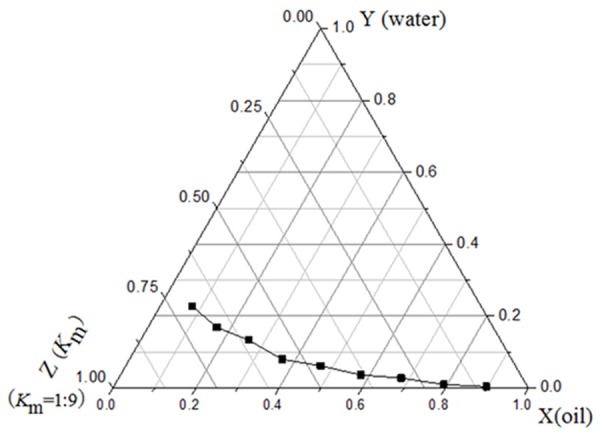
Ternary phase diagrams when K m = 1:9.
Table 3.
Morphology and staining of nanoparticles with methylthionine chloride and magdala red
| Prescription 1 | Prescription 2 | Prescription 3 | |
|---|---|---|---|
| Span-80 | 7.32% | 6.64% | 6.16% |
| n-butyl alcohol | 65.9% | 59.82% | 55.47% |
| Glycerol monostearate | 8.13% | 16.62% | 26.41% |
| Water | 18.6% | 16.92% | 11.96% |
| Morphology | Transparent clear solution with water-drop | Transparent clear solution, immediately sinked after addition of Y and diffused after addition of X and shaking | Transparent clear solution, quickly diffused after addition Y or X |
| Result | × | √ | × |
Note: X, magdala red; Y, methylthionine chloride.
The result showed that P188 and P407 had large effect on the phase transition temperature; the more the P188 was added, the higher the phase transition temperature. The fit goodness R2 and confidence level p of quadratic polynomial indicated that the fit of T was good (R2 = 0.9908, P<0.0001). So we further optimized the gel with central composite design-response surface methodology. By combining the value ranges of factor and after optimization with software Design-Expert, the best prescription was determined as P407 of 2.10 g, P188 of 0.56 g, and T prediction = 3.39°C. The actual results indicated T actual = 33.4±0.32°C which met the requirement for nasal drugs deliver (~33°C). Therefore, the optional prescription was selected as P407 of 21% and P188 of 5.6%.
Identification of QF-SLN-gel
Under room temperature and electron microscopy, the QF-SLN nanoparticles appeared as global oil-droplet with even diameter while the QF-SLN-gel nanoparticles appeared as globe-like with round regular morphology (Figure 2), suggesting there was no significant morphology change of lipid nanoparticle after preparation in situ gel. The measurement with Zetasizer showed that there was no significant difference in particle size and potential (Figure 3).
Figure 2.
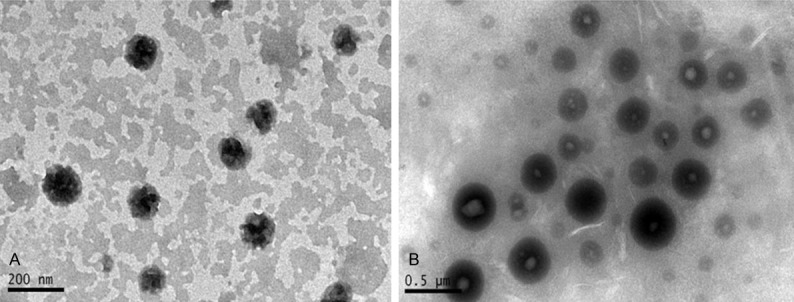
Images of nanoparticles under electron microscopy. A. QF-SLN; B. QF-SLN-gel.
Figure 3.
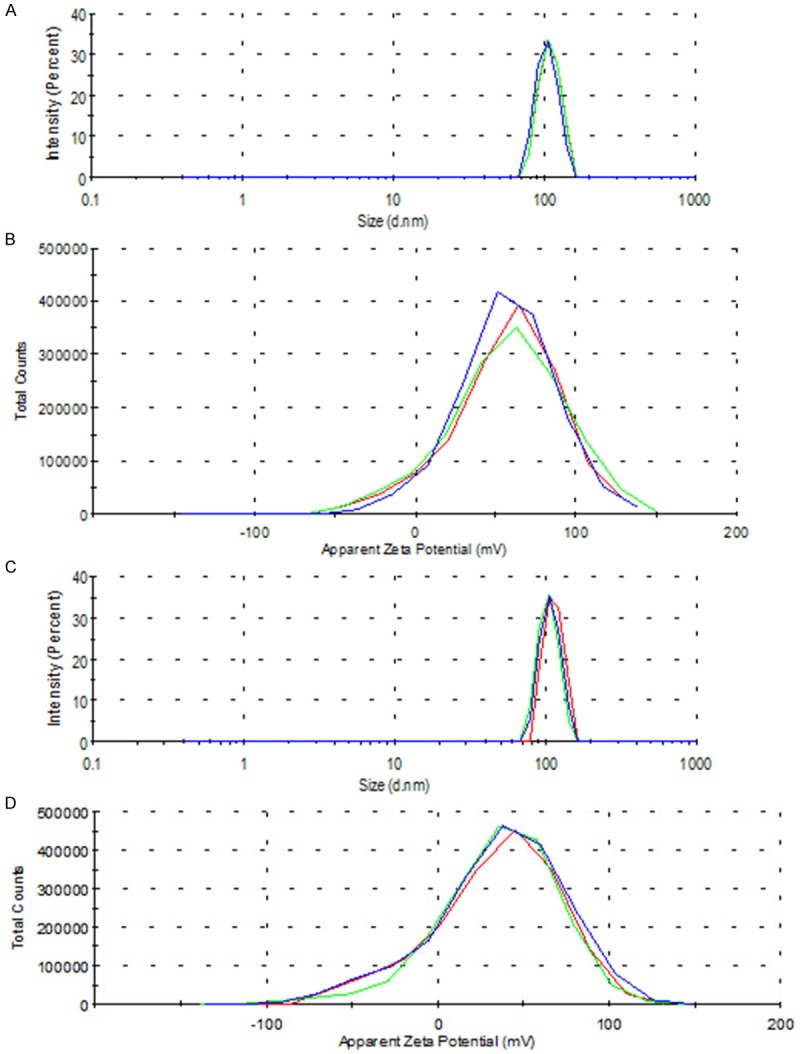
Distribution of nanoparticle size and potential. A. QF-SLN size; B. QF-SLN potential; C. QF-SLN-gel size; D. QF-SLN-gel potential.
The HPLC results indicated that the EF in 3 batches of QF-SLN-gel was 97.22%, 97.44% and 98.14%, respectively, producing mean EF of 97.60%. The results indicated that the specificity, precision, recover met the requirement to encapsulate QF-SLN-gel (Figure 4). According to the results, the regression equation was: y = 7193x - 490.16 (r = 0.9999) for the first day, y = 7237.7x - 1142.9 (r = 0.9999) for the second day and y = 7080.5x - 229.07 (r = 0.9999) for the third day. And according to these equations, the linear range of QF was 0.259~49.7 μg/ml and the quantity in brain was 259 μg/ml. According to the results of HPLC, the precision and recover were 80-120% (Tables 4 and 5) which produced RSD <15% and met the methodological requirement. Furthermore, the HPLC results of different samples (blank brain homogenate, blank brain homogenate + blank control solution, blank control solution + internal standard solution, brain homogenate + internal standard solution) indicated that the chromatograph peak of QF was isolated well from that of internal standard and the endogenous compounds had no significant effect on the QF and internal standard (data not shown).
Figure 4.
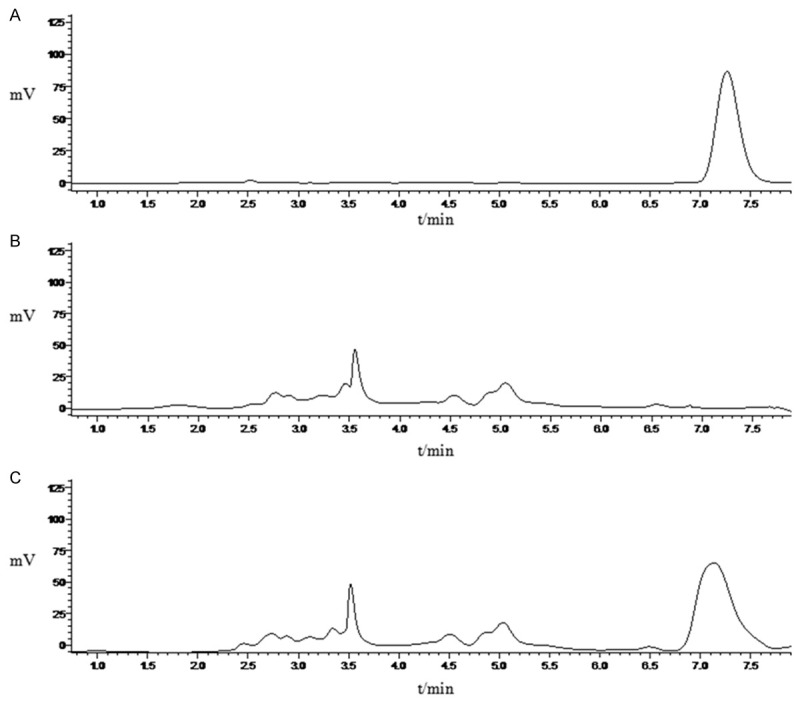
Measurement of linear range of QF using HLPC. A. Control; B. Blank-SLN; C. QF-SLN.
Table 4.
Recover at different conditions (n = 3)
| Added quantity (μg/ml) | Methodological recover (%) | RSD (%) | Extraction recover (%) | RSD (%) |
|---|---|---|---|---|
| 0.518 | 106.489 | 12.922 | 106.985 | 13.818 |
| 8.283 | 101.132 | 0.940 | 101.137 | 0.944 |
| 33.133 | 112.644 | 0.587 | 112.657 | 0.588 |
Table 5.
Precision at different condition (n = 6)
| Concentration (μg/ml) | RSD, % | |
|---|---|---|
|
| ||
| Intra-daily | Inter-daily | |
| 0.518 | 1.853 | 1.950 |
| 8.283 | 1.149 | 1.256 |
| 33.133 | 1.415 | 2.075 |
For the stability of the method, the results indicated that the RSD for brain tissue containing 0.518 and 33.133 μg/ml QF was 3.562% and 0.329% at room temperature for 8 h, 1.014% and 2.927% at room temperature for 12 h, 3.407% and 1.366% at 4°C for 30 h, 1.448% and 0.740% for 3 times of repetitive freeze/thawing, 2.715% and 1.481% under frozen for 9 d, 1.965%and 1.119% under frozen for 21 d. These results indicated that the stability of brain samples was good.
The HPLC results of samples of were measured with HPLC.
Rat model of schizophrenia and brain delivery of QF-SLN-gel
The animal stereotypic behavior study indicated that the rats in schizophrenia group had significant higher score (3.933±0.413) when compared to that of rats in normal group (1.127±0.315, P<0.05). In the MWM test, the rats in schizophrenia group also showed significant longer EL (50.03±9.26 s) than rats in normal group (28.99±7.28 s, P<0.05). Furthermore, the rats in schizophrenia group also showed significant lower capability of spatial probe (P<0.05; Table 6). These results indicated the success of rat model of schizophrenia.
Table 6.
Spatial probe of rats in different groups at day 5 (n = 20)
| Group | Number platform position crossing | Time spent in quadrant of platform (s) | Animal rate crossing platform position | Time first reaching platform position (s) |
|---|---|---|---|---|
| Normal | 2±1.69 | 14.26±3.99 | 75% | 20.89±10.52 |
| Schizophrenia | 1±0.95* | 12.81±13.64* | 42.1%* | 29.45±22.22* |
P<0.05 vs. normal group.
The results indicated that the QF concentrations in prefrontal cortex, cerebellum, hippocampus and pituitary from nasal QF-SLN gel group and QF tail vein group were significantly higher that from oral QF group at all timepoints (all P<0.05), while there was no significant different between nasal QF-SLN gel group and QF tail vein group at 75 min (P>0.05; Table 7).
Table 7.
QF concentration in different tissues at different time points after different delivery methods (n = 6)
| Timepoints (min) | Tissue | Delivery method | ||
|---|---|---|---|---|
|
| ||||
| Oral (μg/mL) | Tail vein (μg/mL) | Nasal (μg/mL) | ||
| 15 | Plasma | 0.188±0.077 | 3.749±0.302* | 3.307±1.559* |
| Prefrontal cortex | 0.046±0.005 | 0.335±0.006* | 0.288±0.048* | |
| Cerebellum | 0.046±0.009 | 0.344±0.007* | 0.481±0.285* | |
| Hippocampus | 0.049±0.008 | 0.345±0.007* | 0.295±0.131* | |
| Pituitary | 0.049±0.008 | 0.363±0.178* | 0.349±0.178* | |
| 45 | Plasma | 0.469±0.353 | 6.426±0.906* | 3.477±0.749* |
| Prefrontal cortex | 0.068±0.031 | 1.060±0.181* | 0.426±0.105* | |
| Cerebellum | 0.066±0.029 | 0.897±0.244* | 0.464±0.111* | |
| Hippocampus | 0.063±0.035 | 0.786±0.230* | 0.489±0.129* | |
| Pituitary | 0.059±0.027 | 1.152±0.082* | 0.548±0.237* | |
| 75 | Plasma | 0.114±0.021 | 2.679±0.679* | 3.003±0.522* |
| Prefrontal cortex | 0.041±0.003 | 0.302±0.062* | 0.454±0.203* | |
| Cerebellum | 0.041±0.004 | 0.297±0.113* | 0.436±0.192* | |
| Hippocampus | 0.041±0.003 | 0.404±0.139* | 0.392±0.098* | |
| Pituitary | 0.042±0.009 | 0.344±0.142* | 0.329±0.073* | |
P<0.05 vs. oral group.
Morphological change of hippocampus
The morphology of hippocampus stained with HE showed that the cells in normal group had compact and regular array, clear hierarchy, round or oval cell body, round and large nuclei, clear nucleoli. In schizophrenia group, the cells showed spare array, unclear hierarchy, thin and long cell body, pyknotic nuclei, unclear or disappeared nucleoli; and some cells even developed into degenerated cells. The treatment ameliorated the morphology changes of hippocampus and nasal administration showed better effect than oral administration (Figure 5). The statistical analysis indicated that the morphology in schizophrenia group was significant difference from normal group, while oral QF and nasal QF-SLN-gel significantly ameliorated the change in schizophrenia group. Furthermore, morphology in nasal QF-SLN-gel group was significantly better than that in oral QF group (Table 8).
Figure 5.

Hippocampal morphology of rats in different groups stained with HE under microscopy (400×). A. Normal group; B. Schizophrenia group; C. Schizophrenia + oral QF group; D. Schizophrenia + nasal QF-SLN-gel group.
Table 8.
Morphology of rats in different groups (n = 6)
| Group | Dosage (40 mg/kg) | Cell array | Hierarchy | Cell body | Nuclei | Nucleoli | Score |
|---|---|---|---|---|---|---|---|
| Normal | - | - | - | - | - | - | -1 |
| Schizophrenia | - | 2+ | 3+ | 3+ | 3+ | 3+ | 14+ |
| Oral | 40 | 1+ | 2+ | 3+ | 2+ | 3+ | 11+1 |
| Nasal | 40 | 1+ | 1+ | 1+ | 1+ | 1+ | 5+1,2 |
Note: Higher + represents severer pathological change, vice versa; - represents no pathological change.
P<0.05 vs schizophrenia group;
P>0.05 vs oral group.
Discussion
In the present study, we prepared nasal QF-SLN-gel using central composite design-response surface methodology and tested its brain delivery in rat model of schizophrenia. The results indicated that the nasal QF-SLN-gel was successfully produced and had good brain delivery in rat model of schizophrenia, suggesting a great clinical value of nasal QF-SLN-gel in treating diseases in brain.
QF is recently considered as the first class medication in treating schizophrenia and bipolar disorder [2,3]. However, the first-pass effect greatly limits its values in acute and emergent conditions of diseases in brain and increases its side effect due to higher dosage. Therefore, seeking more effective administration pathway is important to improve its clinical application. Nasal application is a good pathway for drugs taking effects in brain due to the direct action on brain without the first-pass effect. In the present study, we tried to produce nasal QF-SLN-gel, using the microemulsion method which is simple and can produce even nanoparticles with the help of high pressure homogenizer. The solid lipid materials for preparation of LN include glycerin trilaurate, partial glyceride, fatty acid, steroid, and some esters. Yu et al studied the ibuprofen-SLN-gel and found that the nanoparticles made from glyceryl behenate were muddy, large diameter and easy aggregative while the nanoparticles made from glycerol monostearate were much clearer [7]. Therefore, in the present study, we used glycerol monostearate as lipid material to produce QF-SLN-gel which was even, transparent and stable. However, the glycerol monostearate must be pre-dissolved by heating due to its low solubility and then mixed with emulsifier and auxiliary emulsifier; the aqueous phase solution must be pre-heated to the same temperature as oil phase in order to prevent incomplete emulsification.
Thermosensitive in situ gel can be made from multiple high-molecular materials [17]. Although these high molecular materials have obvious advantages, the intrinsic stimulatory and toxic properties limit their application in nasal preparations. Based on literature [18], the present study prepared thermosensitive in situ gel using P407 and P188 because they have the features such as transition of thermosensitive reversible gel, intoxic and non-irritant. Recently, central composite design-response surface methodology is frequently used to optimize prescription of in situ gel because of its features in high precision, few experiment times and easy application [19]. In the present study, we used the central composite design-response surface methodology to optimize the prescription to prepare the nasal QF-SLN-gel. The optimized prescription produced even, transparent and stable QF-SLN-gel meeting the requirement for nasal application, suggesting that it is practicable to produce nasal QF-SLN-gel using central composite design-response surface methodology and P407 and P188 as materials.
Conclusion
In the present study, we successfully established the rat model of schizophrenia induced by (+)-MK801 (ip) and tested the brain delivery of nasal QF-SLN-gel in the rat model. These rats showed stereotypic behaviors of schizophrenia, impaired place navigation and spatial probe, and morphology change in hippocampus. The concentration of QF in rat brains of nasal QF-SLN-gel group was significantly higher than that of oral QF group and similar with tail vein group, suggesting that nasal QF-SLN-gel had good brain targeting and escaped the first-pass effect, which is better for treatment of diseases of brain. Furthermore, nasal QF-SLN-gel showed better effect in improving morphology change of hippocampus induced by (+)-MK-801 than either oral QF or tail vein QF. These results indicated that the nasal QF-SLN-gel had better effect in treating schizophrenia than oral QF-SLN and suggested that the nasal QF-SLN-gel preparation has good development future and clinical significances.
Acknowledgements
This study was funded by Preparation and Brain Targeting Property of Nasal Solid Lipid Nanoparticles of Quetiapine Fumarate in situ Gel in Rat Model of Schizophrenia, Preparation and Brain Targeting Property of Nasal in situ Gel and Preparation and Quality of Quetiapine Fumarate Orally Disintegrating Tablets. Grant numbers are BYKY1409ZD, Byycxz1320 and Byycxz1419.
Disclosure of conflict of interest
None.
References
- 1.Zhang JQ, Liu ML, Zhou HT, Ren M, Su ZH. Comparative study of quetiapine and chlorpromazine in the treatment of schizophrenia patient. China Pharmacist. 2013;1:99–101. [Google Scholar]
- 2.Altamura AC, Moliterno D, Paletta S, Buoli M, Dell'osso B, Mauri MC, Bareggi SR. Effect of quetiapine and norquetiapine on anxiety and depression in major psychoses using a pharmacokinetic approach: a prospective observational study. Clin Drug Investig. 2012;32:213–219. doi: 10.2165/11597330-000000000-00000. [DOI] [PubMed] [Google Scholar]
- 3.Nikisch G, Baumann P, Liu T, Mathe AA. Quetiapine affects neuropeptide Y and corticotropin-releasing hormone in cerebrospinal fluid from schizophrenia patients: relationship to depression and anxiety symptoms and to treatment response. Int J Neuropsychopharmacol. 2012;15:1051–1061. doi: 10.1017/S1461145711001556. [DOI] [PubMed] [Google Scholar]
- 4.Yu KF. Study of ibuprofen solid lipid nanoparticle in situ gel. In: Pang XJ, editor. Pharmaceutics. 2009. [Google Scholar]
- 5.Qian JJ, Shi SL. Factors affecting drug absorption and improvement measures for nasal in situ gel delivery system. Chinese Journal of New Drugs. 2012;8:884–889. [Google Scholar]
- 6.Niu MM. Study of ciclosporin A solid lipid nanoparticle in situ gel in ocular drugs. In: Cui FD, editor. Pharmaceutics. 2008. [Google Scholar]
- 7.Si TM, Shu L. Dizocilpine maleate in model study of animal behavior. Chinese Journal of Psychiatry. 2000;3:158–160. [Google Scholar]
- 8.Zhan SM, Hou DZ, Ping QN, Xu Y. Preparation and efficiency determination of solid nanoparticles loaded levodopa. Chinese Journal of Hospital Pharmacy. 2010;14:1171–1175. [Google Scholar]
- 9.Du CY. Screening of preparation methods and optimization of prescription for nanoparticles. In: Wang HG, editor. Pharmaceutics. 2013. [Google Scholar]
- 10.Hao JF, Zhao XM, Wang JZ, Guo FG, Xiao JH, Kong ZF. Optimization of theromosensitive in situ gel system containing berberine hydrochloride for ocular use. Chinese Traditional and Herbal Drugs. 2010;4:550–555. [Google Scholar]
- 11.Sun SY, Ma T, Wang QQ. The preparation of thermosensitive in situ gel system containing antofloxacin for ocular use by the optimization of central composite design-response surface methodology. Journal of Bengbu Medical College. 2013;7:869–872. [Google Scholar]
- 12.Zhang WJ, Li JC, Wang X, Zhang J. Pharmacokinetic Study of Quetiapine Fumarate in Rats. China Pharmacy. 2014;37:3478–3480. [Google Scholar]
- 13.Wu JH. Establishment of schizophrenic animal model and drug screening platform. In: Jin ML, editor. Biochemistry and Molecular Biology. 2003. [Google Scholar]
- 14.Yang CP, Cai CC, Yang XJ, Wang HJ, Xiao C. Effects of Wendan Decoction on receptors of glutamic acid and n-methyl-D-asporartate in rats with schizophrenia. China Journal of Experimental Traditional Medical Formulae. 2011;9:152–155. [Google Scholar]
- 15.Li X, Li CD, Wang XF. Effects of septai nucleus lesioning on behaviors and learning and memory abilities in methamphetamine-treated rats. Chinese Journal of Minimally Invasive Neurosurgery. 2008;13:176–178. [Google Scholar]
- 16.Liu JX, Wang XY, Wang XF, Li CD, Zhou YC, Zhang YB, Zhang HB. The effect of cingulum bundle lesion on dopamine receptor 2 in cortex of temporal lobe in methamphetamine rats. Journal of International Neurology and Neurosurgery. 2006;3:211–213. [Google Scholar]
- 17.Qiu HZ, Li J. Development and application of in situ gel in pharmaceutics. Medical Information. 2010;5:1524–1526. [Google Scholar]
- 18.Chen L, Jiang SP, Cao QR, Cui JH. Preparation of zanamivir-loaded solid lipid nanoparticles and determination of encapsulation efficiency. Suzhou University Journal of Medical Science. 2012;3:369–372. [Google Scholar]
- 19.Qiu Y, Zhu L, Sun XY. Comparison between central composite design-response surface optimization and orthogonal design and uniform design and application in pharmaceutics. Strait Pharmaceutical Journal. 2011;2:18–20. [Google Scholar]