Abstract
Nuciferine has shown remarkable biological activities and been considered as a promising drug. In this study, a sensitive and selective ultra performance liquid chromatography-tandem mass spectrometry (UPLC-MS/MS) method was developed and validated for determination of nuciferine in tissue and plasma. An electrospray ionization source was applied and operated in positive ion mode; multiple reactions monitoring (MRM) mode was used for quantification using target fragment ions m/z 296.0→265.1 for nuciferine, and m/z 322.0→307.0 for berberrubine internal standard (IS). Based on the UPLC-MS/MS method, the tissue distribution profile of nuciferine in mice and plasma pharmacokinetics in rat were studied. The results showed nuciferine was absorbed through intestinal tract and distributed into tissues rapidly. The bioavailability of nuciferine was identified at 17.9%. It can across through blood brain barrier, the concentrations in liver and kidney are highest, then followed by spleen, lung heart and brain. Nuciferine is eliminated quickly in the tissues and plasma, the t1/2 within 5 hour. The concentrations in these tissues are correlated to each other, and can be predicted by a back-propagation artificial neural network model.
Keywords: Nuciferine, UPLC-MS/MS, pharmacokinetics, tissue distribution
Introduction
Medicinal plants have served as an important source of drugs for treating diseases since ancient times. Although the remarkable progress in synthetic organic chemistry of the twentieth century, over 25% of prescribed medicines in industrialized countries derive directly or indirectly from plants. Nuciferine ((R)-1,2-dimethoxyaporphine) is an alkaloid initially isolated from lotus leaf, which is the leaves of Nelumbo nucifera Gaertn [1].
Nuciferine has been reported to show remarkable biological activities, including antioxidant [2], antimicrobial [3] anti-HIV [4], anti-obesity [5,6], anti-hyperlipidemic [7] and hypotensive [8] properties. It was also found to stimulate insulin secretion by increasing intracellular calcium and stimulating cAMP responsive pathway [9], reduce the development of atherosclerosis by inhibiting vascular smooth muscle cell proliferation and migration [10], inhibit nicotine-induced non-small cell lung cancer progression by reducing the activity of Wnt/β-catenin signaling [11], restore potassium oxonate-induced hyperuricemia and kidney inflammation [12]. Given these pharmacological properties and salutary effects, nuciferine is a promising drug candidate. Therefore, detecting nuciferine’s concentration and characteristics of tissue distribution are necessary and will contribute to the understanding of the action mechanism in vivo.
So far, high-performance liquid chromatography [13] and high-performance liquid chromatography-mass spectrometry (HPLC-MS) [14,15] methods have been reported for determination of nuciferine. However, no UPLC-MS/MS method developed for the determination of nuciferine in plasma and few study investigated the tissue distribution. Although, Gu et al reported the tissue concentration of nuciferine in rat, they only determined it at four different times during 30 min to 12 h [15]. In this study, the more efficient UPLC-MS/MS method for determination of nuciferine in rat plasma and tissue distribution is developed and the complete tissue distribution including brain, kidney, lung, spleen, liver and heart were investigated. According to the tissue distribution and pharmacokinetics, a regression model was developed by combined the multiple linear regression and artificial neural network.
Experimental
Chemicals and reagents
Nuciferine (purity > 98%) and berberrubine (IS, purity > 98%) were purchased from the Chengdu Mansite Pharmaceutical CO. LTD. (Chengdu, China). LC-grade acetonitrile and methanol were purchased from Merck Company (Darmstadt, Germany). Ultra-pure water was prepared by Millipore Milli-Q purification system (Bedford, MA, USA). Rat blank plasma samples were supplied from drug-free rats.
Animal
Forty male Swiss hanschka (ICR) mice and twelve male Sprague-Dawley rats (200-220 g) were obtained from the Laboratory Animal Center of Wenzhou Medical University (Wenzhou, China) to study the pharmacokinetics of nuciferine. All experimental procedures and protocols were reviewed and approved by the Animal Care and Use Committee of Wenzhou Medical University. Diet was prohibited for 12 h before the experiment but water was freely available.
Instrumentation and conditions
A UPLC-MS/MS system with ACQUITY I-Class UPLC and a XEVO TQD triple quadrupole mass spectrometer (Waters Corp., Milford, MA, USA), equipped with an electrospray ionization interface, was used to analyze the compounds. The UPLC system was comprised of a Binary Solvent Manager and a Sample Manager with Flow-Through Needle. Masslynx 4.1 software (Waters Corp., Milford, MA, USA) was used for data acquisition and instrument control.
Nuciferine and berberrubine (IS) were separated on an UPLC BEH C18 column (2.1 mm × 100 mm, 1.7 μm) maintained at 40°C. The initial mobile phase consisted of 0.1% formic acid and acetonitrile with gradient elution at a flow rate of 0.4 mL/min and an injection volume of 2 μL. Elution was in a linear gradient, where the acetonitrile increased from 30% to 60% between 0 and 1.5 min, then increased to 95% within 0.5 min, maintained at 95% for 0.5 min, then decreased to 30% within 0.1 min, then maintained at 30% for 0.4 min. The total run time of the analytes was 3 min. After each injection, the sample manager underwent a needle wash process, including both a strong wash (methanol-water, 50/50, v/v) and a weak wash (methanol-water, 10/90, v/v).
Nitrogen was used as the desolvation gas (1000 L/h) and cone gas (50 L/h). Ion monitoring conditions were defined as capillary voltage of 2.5 kV, source temperature of 150°C, and desolvation temperature of 500°C. MRM modes of ions m/z 296.0→265.1 for nuciferine, and m/z 322.0→307.0 for IS were utilized to conduct quantitative analysis (Figure 1).
Figure 1.
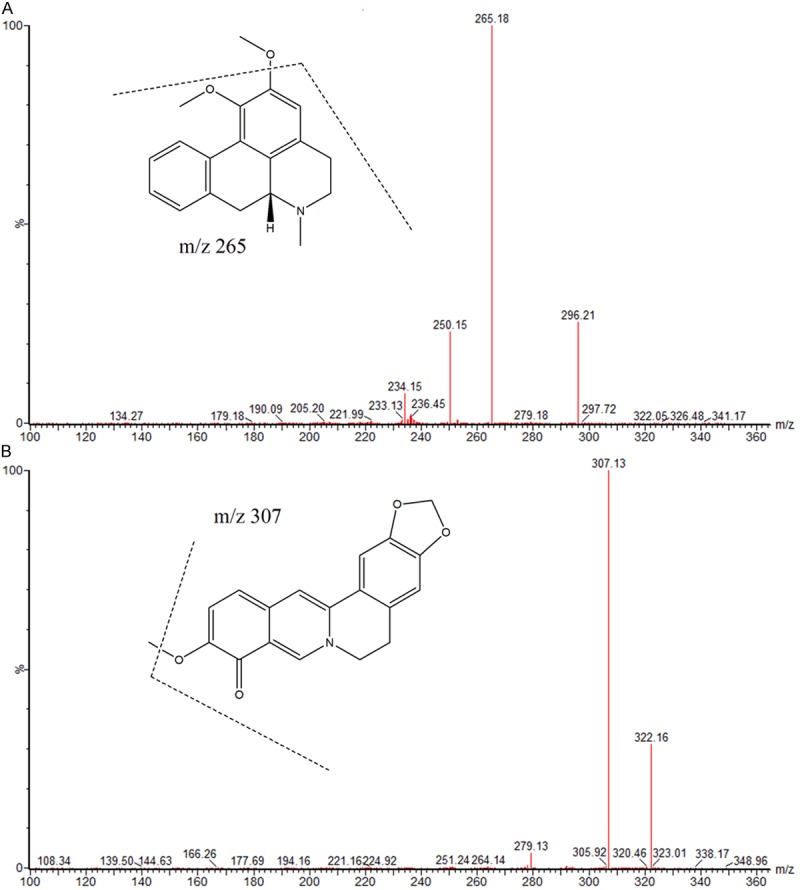
Chemical structure and Mass spectrum of nuciferine (A) and berberrubine (IS, B).
Development of UPLC-MS/MS determining method
Calibration standards and quality control samples
The stock solutions of nuciferine (1.0 mg/mL) and berberrubine (IS) (100 µg/mL) were prepared in methanol-water (50:50, v/v). The 0.25 µg/mL working standard solution of the IS was prepared from the IS stock solution by dilution with methanol; working solutions for calibration and controls were prepared from stock solutions in the same manner. All of the solutions were stored at 4°C and were brought to room temperature before use.
Nuciferine calibration standards were prepared by spiking blank rat plasma with appropriate amounts of the working solutions. Calibration plots were offset to range between 2-1000 ng/mL for nuciferine in rat plasma (2, 5, 10, 20, 50, 100, 200, 500 and 1000 ng/mL), tissue (5, 10, 20, 50, 100, 200, 500, 1000 and 2000 ng/mL). Quality-control (QC) samples were prepared in the same manner as the calibration standards, in three different plasma concentrations (4, 400, and 800 ng/mL). The analytical standards and QC samples were stored at -20°C.
Sample preparation
Before analysis, the plasma sample was thawed to room temperature. An aliquot of 10 µL of the IS working solution (0.25 µg/mL) was added to 50 µL of the collected plasma sample in a 1.5 mL centrifuge tube, followed by the addition of 150 µL of acetonitrile-methanol (9:1, v/v). The tubes were vortex mixed for 1.0 min. After centrifugation at 14900 × g for 10 min in Allegra 64R High-speed Centrifuge (Beckman Coulter, Inc., Los Angeles, California USA), the supernatant (2 µL) was injected into the UPLC-MS/MS system for analysis.
When nuciferine was extracted from the tissues, 50 mg of brain, kidney, lung, spleen, liver and heart were weighed accurately and placed in 1.5 ml polypropylene tubes, then 200 µL acetonitrile-methanol (v/v, 9:1) including IS of 50 ng/mL was added. The mixture was stored at -80°C for 20 min then grinded for 2 min by a SCIENTZ-48 Tissue Grinder, which the grinding parameter was 64 Hz and 1800 r/s. After centrifugation at 14900 g for 15 min at 4°C, the supernatant (2 µL) was injected into the UPLC-MS/MS system for analysis.
Method validation
Rigorous tests for selectivity, linearity, accuracy, precision, recovery, and stability, according to the guidelines set by the United States Food and Drug Administration (FDA) and European Medicines Agency (EMA), were conducted in order to thoroughly validate the proposed bioanalytical method. Validation runs were conducted on three consecutive days. Each validation run consisted of one set of calibration standards and six replicates of QC plasma samples.
To evaluate the matrix effect, blank rat plasma was extracted and spiked with the analyte at 4, 400, and 800 ng/mL concentrations. The corresponding peak areas were then compared to those of neat standard solutions at equivalent concentrations, this peak area ratio is defined as the matrix effect. The matrix effect of the IS was evaluated at a concentration of 50 ng/mL in a similar manner.
Accuracy and precision were assessed by the determination of QC samples at three concentration levels in six replicates (4, 400, and 800 ng/mL) over three days of validation testing. The recovery of nuciferine was evaluated by comparing the peak area of extracted QC samples with those of reference QC solutions reconstituted in blank plasma extracts (n = 6).
Sample stability exposed at room temperature for 2 h, 24 h, freeze/thaw stability from -20 to 25°C, long-term stability stored at -20°C for 20 days were evaluated by analyzing three replicates of plasma samples at concentrations of 4 or 800 ng/mL which were all exposed to different conditions. The stability of the IS (50 ng/mL) was evaluated similarly.
Tissue distribution
Forty ICR mice were randomly divided into eight different groups (n = 5) and received nuciferine 15 mg/kg by intragastric (ig) administration for tissue distribution study. The tissue samples, brain, heart, liver, spleen, lung and kidney were collected at 0.0833, 0.5, 1, 2, 3, 4, 6, 8, 12 h by sacrificing 5 mice at each time point. After the mice were anesthetized by 4% chloral hydrate, these tissues were immediately removed, washed in normal saline. After that, the tissues were prepared according to 2.4.2 Sample preparation, and the concentrations of nuciferine were determined by developed method.
Plasma pharmacokinetics
Twelve SD rats were randomly divided into two different groups (n = 6) giving ig administration 15 mg/kg or intravenous (iv) administration 2 mg/kg of nuciferine for pharmacokinetic study. Blood samples (0.2 mL) were collected from the tail vein into heparinized 1.5 mL polythene tubes at 0.0833, 0.25, 0.5, 1, 1.5, 2, 4, 6, 8, and 12 h. The samples were immediately centrifuged at 3000 × g for 10 min and determined by developed method.
Data analysis
The nuciferine concentration in tissues and plasma versus time data for each rat was analyzed by DAS (Drug and Statistics) software (Version 2.0, Wenzhou Medical University, China). The relationships between brain, heart, liver, spleen, lung and kidney were analyzed by bivariate correlation.
The concentration data of brain, heart, liver, spleen, lung and kidney were employed into the back-propagation artificial neural network (BP-ANN). The input layer consist of five factors, the output data is one factor, such as the concentrations of heart, liver, spleen, lung and kidney were selected as the input data, then the output data were concentrations of brain. The node numbers of hidden layer were based on the formula of m = √(n + 1) +a, where m is the number of the nodes in the hidden layer, and n is the number of nodes in the input layer, l is the number of nodes in the output layer, a is a constant from 1 to 10, for more details refer to [16]. The BP-ANN model was performed at Matlab R2011a.
Results
Development of nuciferine by UPLC-MS/MS
Selectivity and matrix effect
There were no interfering endogenous substances observed at the retention time of nuciferine and IS. Figure 2 shows typical chromatograms of a blank plasma sample, a blank plasma sample spiked with nuciferine and IS, and a plasma sample. The matrix effect for nuciferine at concentrations of 4, 400, and 800 ng/mL were measured to be 93.4%, 91.3% and 88.5% (n = 6). The matrix effect for IS (50 ng/mL) was 96.6% (n = 6). As a result, matrix effect from plasma was considered negligible in this method.
Figure 2.
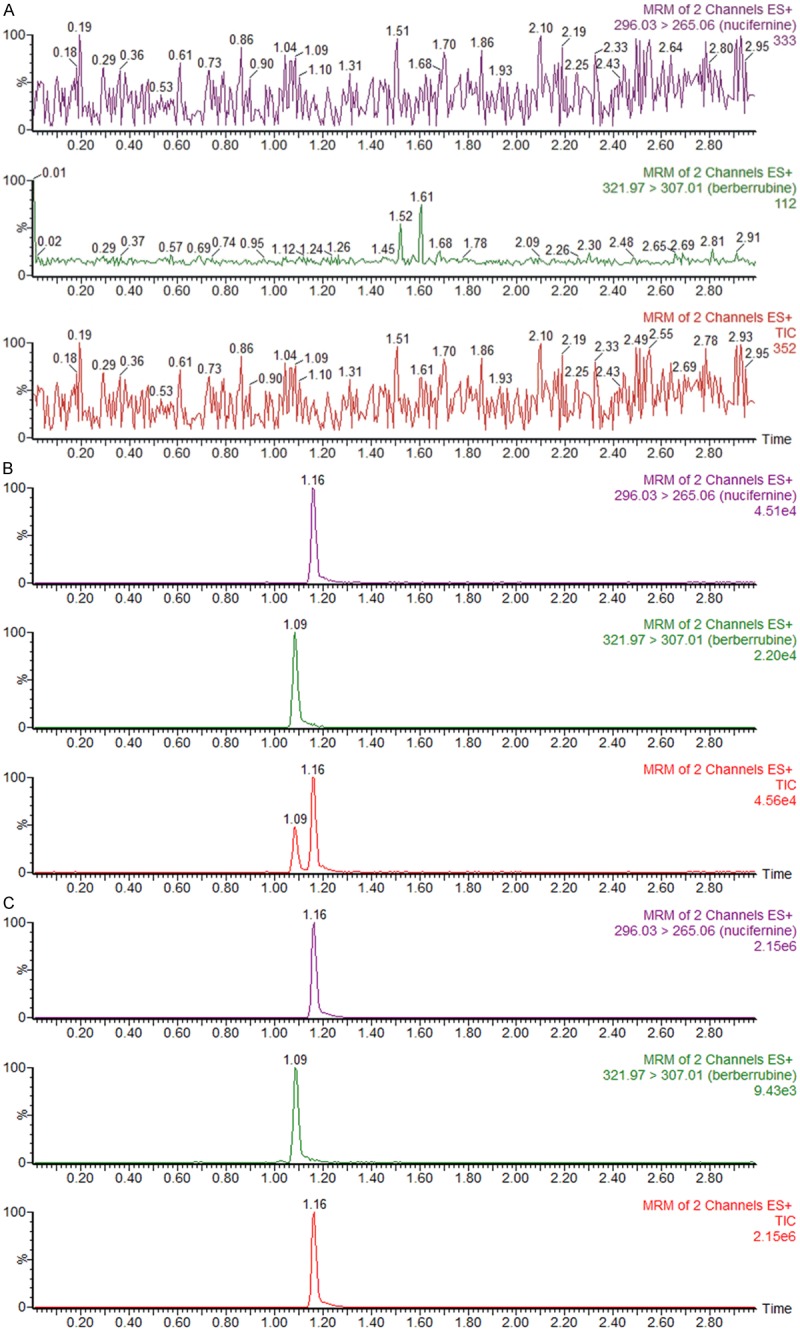
Representative UPLC-MS/MS chromatograms of nuciferine and berberrubine (IS), A: Blank plasma; B: Blank plasma spiked with nuciferine (50 ng/mL) and IS (50 ng/mL); C: A rat plasma sample 6 h after oral administration of single dosage 15 mg/kg nuciferine.
Calibration curve and sensitivity
Linear regressions of the peak area ratios versus concentrations were fitted over the concentration range 2-1000 ng/mL for nuciferine in rat plasma and tissues, the equations were plasma: Y = 0.0142971*X + 0.0440159, R = 0.9969, brain: Y = 0.0119387*X + 0.106676, R = 0.9961, kidney: Y = 0.0105114*X + 0.00728954, R = 0.9992, lung: Y = 0.0142026*X + 0.00484171, R = 0.9992, spleen: Y = 0.00993605*X + 0.0447044, R = 0.9986, liver: Y = 0.0118506*X + 0.0204734, R = 0.9985, heart: Y = 0.0116049*X + 0.0628655 0, R = 9979. The LLOQ for the determination of nuciferine in plasma was 2 ng/mL. The precision and accuracy at LLOQ were 15.4% and 86.8%, respectively. The precision at LLOQ were between 8.6% and 17.8%, and accuracy was between 84.6% and 112.6%, respectively.
Precision, accuracy and recovery
The precision of the method was determined by calculating RSD for QCs at three concentration levels over three days of validation tests. Intra-day precision RSD was 9.3, 7.5, 4.8, and inter-day precision RSD was 9.0, 10.3, 3.3 % at each QC level (4, 400, 800 ng/mL). The accuracy of the method ranged from 95.3% and 109.4% at each QC level. Mean recoveries of nuciferine were higher than 84.9%. The recovery of the IS (50 ng/mL) was 90.2%.
Stability
Results from the auto-sampler showed that the nuciferine was stable under room temperature, freeze-thaw, and long-term (20 days) conditions, confirmed because the bias in concentrations were within 88.9% and 107.6% of their nominal values. To this effect, the established method was suitable for pharmacokinetics and tissue distribution.
Tissue distribution profile and predicting model
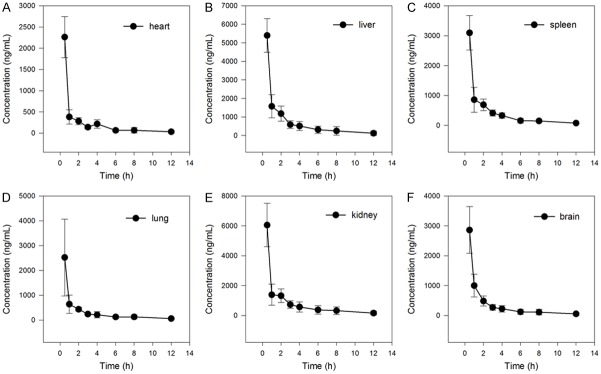
The mean concentration-time curves of nuciferine in brain, kidney, lung, spleen, liver and heart when ig administrated 15 mg/kg were shown in Figure 3. The results showed that nuciferine was absorbed through intestinal tract and distributed into tissues rapidly, it reached the highest concentration within 0.5 h in every tissues. The level of nuciferine in liver and kidney is highest, then followed by spleen, lung heart and brain. The brain has almost equal level with heart, which indicated nuciferine can across through blood brain barrier.
Figure 3.
Mean concentration of nuciferine in brain, kidney, lung, spleen, liver and heart from 30 min to 12 h after an ig administration of nuciferine 15 mg/kg (n = 5, mean ± SD).
The results of univariate analysis indicated there was high relationship between liver, kidney, spleen, lung, heart and brain (P < 0.01), the correlation coefficient was listed in Table 1. The BP-ANN model were trained within 100 epochs, the performance parameters of model were indicated by mean square error (MSE), magnitude of the gradient, the number of validation checks, correlation coefficient (Table 2). The results of predicted and measured times-concentrations profiles of nuciferine showed that the BP-ANN model of tissues distribution achieved a highly prediction accuracy in brain, heart, liver, spleen, lung and kidney (Figure 4).
Table 1.
The Pearson Correlation coefficient between different tissues of mice (n = 40)
| Brain | Kidney | Lung | Spleen | Liver | Heart | |
|---|---|---|---|---|---|---|
| Brain | 1.000 | 0.951** | 0.860** | 0.982** | 0.964** | 0.976** |
| Kidney | 0.951** | 1.000 | 0.869** | 0.946** | 0.939** | 0.967** |
| Lung | 0.860** | 0.869** | 1.000 | 0.794** | 0.757** | 0.835** |
| Spleen | 0.982** | 0.946** | 0.794** | 1.000 | 0.971** | 0.978** |
| Liver | 0.964** | 0.939** | 0.757** | 0.971** | 1.000 | 0.965** |
| Heart | 0.976** | 0.967** | 0.835** | 0.978** | 0.965** | 1.000 |
P < 0.01.
Table 2.
The fitness index of BP-ANN model performed in six tissues
| Index | Heart | Liver | Spleen | Kidney | Lung | Brain |
|---|---|---|---|---|---|---|
| Mean Squared Error | 8.84 × 10⁻¹² | 2.17 × 10⁻¹¹ | 1.41 × 10⁻⁵ | 8.79 × 10⁻⁷ | 1,39 × 10⁻⁹ | 1.37 × 10⁻⁵ |
| The Magnitude Of The Gradient | 2.68 × 10⁻⁵ | 2.95 × 10⁻⁵ | 8.80 × 10⁻⁴ | 3.96 × 10⁻³ | 1.70 × 10⁻⁴ | 4.21 × 10⁻³ |
| Validation Checks | 0 | 0 | 0 | 0 | 0 | 0 |
| Correlation Coefficient (R) | 1 | 1 | 0.9999 | 1 | 1 | 0.9999 |
Figure 4.
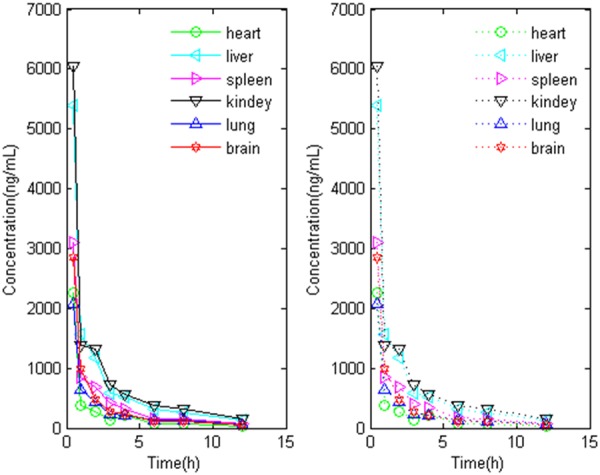
The measured (solid line) and predicted (dash line) tissues concentrations profiles of nuciferine generated by BP-ANN model in Matlab.
Plasma pharmacokinetics and bioavailability
The plasma concentration-time curves of nuciferine at two different administration method in rats were best fitted with two-compartment model, and the pharmacokinetic parameters were summarized in Table 3. The mean plasma concentration-time curves of nuciferine when iv 2 mg/kg and ig 15 mg/kg in two groups rats were shown in Figure 5. The absolute bioavailablity of nuciferine was 17.9% according to the formula: F = AUCpo Div/AUCiv Dpo × 100%.
Table 3.
Tissue and plasma pharmacokinetic parameters after administration of nuciferine
| Parameters | Plasma | Brain | Kidney | Lung | Spleen | Liver | Heart | |
|---|---|---|---|---|---|---|---|---|
|
| ||||||||
| iv 2 mg/kg | ig 15 mg/kg | ig 15 mg/kg | ||||||
| AUC(0-t) (ng/mL*h) | 144.8 ± 31.9 | 769.8 ± 299.7 | 4978.8 ± 480.1 | 10621.9 ± 928.7 | 3776.3 ± 968.4 | 5504.6 ± 571.0 | 9577.4 ± 1341.6 | 3186.9 ± 272.1 |
| AUC(0-∞) (ng/mL*h) | 155.0 ± 50.5 | 780.4 ± 310.3 | 5680.9 ± 1 594.7 | 17152.1 ± 13309.2 | 4411.1 ± 489.8 | 5858.2 ± 673.5 | 11879.9 ± 454.9 | 3809.5 ± 1459.4 |
| t1/2 (h) | 1.2 ± 1.0 | 3.8 ± 1.1 | 4.7 ± 4.3 | 3.9 ± 0.3 | 4.8 ± 3.2 | 3.4 ± 0.6 | 4.2 ± 2.4 | 3.7 ± 2.8 |
| Tmax (h) | 0.08 | 1.1 ± 0.4 | 0.5 ± 0.0 | 0.5 ± 0.0 | 0.6 ± 0.2 | 0.5 ± 0.0 | 0.5 ± 0.0 | 0.5 ± 0.0 |
| CL (L/h/kg) | 13.8 ± 3.7 | 22.5 ± 10.4 | 2.8 ± 0.6 | 1.2 ± 0.5 | 3.8 ± 1.5 | 2.6 ± 0.3 | 1.4 ± 0.4 | 4.3 ± 1.1 |
| V (L/kg) | 20.7 ± 8.7 | 120.0 ± 53.2 | 16.3 ± 9.1 | 9.4 ± 3.8 | 22.4 ± 9.0 | 12.6 ± 1.8 | 7.5 ± 1.9 | 19.1 ± 7.7 |
| Cmax (ng/mL) | 131.4 ± 20.0 | 208.4 ± 99.7 | 2861.0 ± 781.4 | 6052.0 ± 1452.3 | 2154.3 ± 1570.9 | 3095.4 ± 575.0 | 5398.8 ± 911.3 | 2262.6 ± 485.9 |
Figure 5.
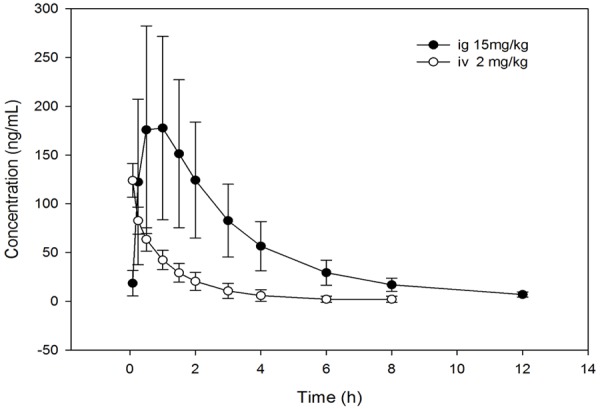
Mean plasma concentration time profile after ig 15 mg/kg or iv 2, 6 mg/kg administration of nuciferine in rats.
Discussion
The mobile phase played a critical role in achieving good chromatographic behavior and appropriate ionization [17-19]. Acetonitrile was selected for the organic phase, as it provides sharper peak shape and lower pump pressure compared to methanol. Acetonitrile and water (containing 0.1% formic acid) were chosen as the mobile phase because the combination provides proper retention time and peak shape. The total run time for each injection was 3 min.
Efficient removal of proteins and other potential interference in the bio-samples prior to LC-MS analysis was a crucial step in the development of this method [20-22]. The liquid-liquid extraction by ethyl acetate, ethyl ether and chloroform were tried at first, the recovery of them (between 70.6% and 95.3%) were good, the extraction recovery by ethyl acetate was the best (around 90.6% and 96.7%), however the liquid-liquid extraction is time-consuming and tedious. Then the simple protein precipitation was employed in our work, acetonitrile-methanol (9:1, v/v) with the acceptable recovery (around 84.9% and 92.0%) was chosen as the protein precipitation solvent. An effective and simple protein precipitation is much simpler and faster than liquid-liquid extraction or solid phase extraction.
We tried carbamazepine, diazepam, midazolam at first, however berberrubine was more suitable for IS in the present study. Berberrubine was selected as the IS, because its chemical structure and chromatographic performance are similar to nuciferine and the two show similar retention time and extraction efficacy; and both are suitable for detection in the positive ion electrospray ionization interface. The UPLC-MS/MS method in this study was validated for selectivity, linearity, accuracy, precision, recovery and stability with a total run time of 3 min.
Based on the developed UPLC-MS/MS, the tissues and plasma concentration of nuciferine were determined and analyzed. The tissues distribution results showed nuciferine can distribute into every organs including brain, kidney, lung, spleen, liver and heart. This indicated nuciferine is performed as two-compartment model after absorbed into blood circulation which is consistent with the results of plasma pharmacokinetic data analysis. Furthermore, the level of nuciferine in liver and kidney is nearly 10 times higher than plasma, which indicated that liver and kidney are two of most metabolic organ for nuciferine. And nuciferine is eliminated quickly in there, which resulted in the plasma t1/2 is (1.2 ± 1.0) and (3.8 ± 1.1) h when iv 2 mg/kg and po 15 mg/kg administration.
Artificial neural networks are computational models inspired by a brain’s central nervous system which is capable of machine learning as well as pattern recognition. BP-ANN is one of the widely used artificial modeling methods in medical area [23]. In this study, the developed BP-ANN model of tissues (brain, heart, liver, spleen, lung and kidney) will be helpful for comprehension of their metabolic characteristics, and predict the concentrations of each other. Moreover, in term of the good performance in training model, we can develop more different model between plasma and heart, liver, spleen, lung or kidney.
Conclusion
The developed UPLC-MS/MS method described here allows accurate and easily reproduced determination of nuciferine, utilizing only 50 µL of plasma with an LLOQ of 2 ng/mL. Nuciferine can across through blood brain barrier, the concentration in liver and kidney is highest, then followed by spleen, lung heart and brain. Nuciferine is eliminated quickly in the tissues and plasma, the t1/2 within 5 hour and the bioavailability of nuciferine was 17.9%. The concentrations in these tissues are correlated to each other, and can be predicted by a BP-ANN model.
Acknowledgements
This work was supported by fund of the key construction academic subject (Medical Innovation) of Zhejiang Province (11-CX26), Zhejiang Provincial Natural Science Foundation of China (LQ12H30001), Zhejiang Province funds for Health Department (2012RCB041), Zhejiang Medical Association Clinical Scientific Research Fund (2012ZYC-A109).
Disclosure of conflict of interest
None.
References
- 1.Sikandar S, Dizon D, Shen X, Li Z, Besterman J, Lipkin SM. The class I HDAC inhibitor MGCD0103 induces cell cycle arrest and apoptosis in colon cancer initiating cells by upregulating Dickkopf-1 and non-canonical Wnt signaling. Oncotarget. 2010;1:596–605. doi: 10.18632/oncotarget.194. [DOI] [PMC free article] [PubMed] [Google Scholar]
- 2.Cho EJ, Yokozawa T, Rhyu DY, Kim SC, Shibahara N, Park JC. Study on the inhibitory effects of Korean medicinal plants and their main compounds on the 1,1-diphenyl-2-picrylhydrazyl radical. Phytomedicine. 2003;10:544–551. doi: 10.1078/094471103322331520. [DOI] [PubMed] [Google Scholar]
- 3.Agnihotri VK, ElSohly HN, Khan SI, Jacob MR, Joshi VC, Smillie T, Khan IA, Walker LA. Constituents of Nelumbo nucifera leaves and their antimalarial and antifungal activity. Phytochemistry Letters. 2008;1:89–93. doi: 10.1016/j.phytol.2008.03.003. [DOI] [PMC free article] [PubMed] [Google Scholar]
- 4.Kashiwada Y, Aoshima A, Ikeshiro Y, Chen YP, Furukawa H, Itoigawa M, Fujioka T, Mihashi K, Cosentino LM, Morris-Natschke SL, Lee KH. Anti-HIV benzylisoquinoline alkaloids and flavonoids from the leaves of Nelumbo nucifera, and structure-activity correlations with related alkaloids. Bioorg Med Chem. 2005;13:443–448. doi: 10.1016/j.bmc.2004.10.020. [DOI] [PubMed] [Google Scholar]
- 5.Ohkoshi E, Miyazaki H, Shindo K, Watanabe H, Yoshida A, Yajima H. Constituents from the leaves of Nelumbo nucifera stimulate lipolysis in the white adipose tissue of mice. Planta Med. 2007;73:1255–1259. doi: 10.1055/s-2007-990223. [DOI] [PubMed] [Google Scholar]
- 6.Ono Y, Hattori E, Fukaya Y, Imai S, Ohizumi Y. Anti-obesity effect of Nelumbo nucifera leaves extract in mice and rats. J Ethnopharmacol. 2006;106:238–244. doi: 10.1016/j.jep.2005.12.036. [DOI] [PubMed] [Google Scholar]
- 7.Xie W, Zhao Y, Du L. Emerging approaches of traditional Chinese medicine formulas for the treatment of hyperlipidemia. J Ethnopharmacol. 2012;140:345–367. doi: 10.1016/j.jep.2012.01.027. [DOI] [PubMed] [Google Scholar]
- 8.Morales M, Bustamante S, Brito G, Paz D, Cassels BK. Cardiovascular effects of plant secondary metabolites norarmepavine, coclaurine and norcoclaurine. Phytother Res. 1997;12:103–109. [Google Scholar]
- 9.Nguyen KH, Ta TN, Pham TH, Nguyen QT, Pham HD, Mishra S, Nyomba BL. Nuciferine stimulates insulin secretion from beta cells-an in vitro comparison with glibenclamide. J Ethnopharmacol. 2012;142:488–495. doi: 10.1016/j.jep.2012.05.024. [DOI] [PubMed] [Google Scholar]
- 10.Ho HH, Hsu LS, Chan KC, Chen HM, Wu CH, Wang CJ. Extract from the leaf of nucifera reduced the development of atherosclerosis via inhibition of vascular smooth muscle cell proliferation and migration. Food Chem Toxicol. 2010;48:159–168. doi: 10.1016/j.fct.2009.09.033. [DOI] [PubMed] [Google Scholar]
- 11.Liu W, Yi DD, Guo JL, Xiang ZX, Deng LF, He L. Nuciferine, extracted from Nelumbo nucifera Gaertn, inhibits tumor-promoting effect of nicotine involving Wnt/beta-catenin signaling in non-small cell lung cancer. J Ethnopharmacol. 2015;165:83–93. doi: 10.1016/j.jep.2015.02.015. [DOI] [PubMed] [Google Scholar]
- 12.Wang MX, Liu YL, Yang Y, Zhang DM, Kong LD. Nuciferine restores potassium oxonate-induced hyperuricemia and kidney inflammation in mice. Eur J Pharmacol. 2015;747:59–70. doi: 10.1016/j.ejphar.2014.11.035. [DOI] [PubMed] [Google Scholar]
- 13.Wang YX, Liu B, Shi RB. HPLC determination of 2-hydroxy-1-methoxyaporphine, pronuciferine, nuciferine and roemerine in Nelumbo nucifera and its alkaloid fraction. Zhongguo Zhong Yao Za Zhi. 2008;33:1713–1716. [PubMed] [Google Scholar]
- 14.Luo X, Chen B, Liu J, Yao S. Simultaneous analysis of N-nornuciferine, O-nornuciferine, nuciferine, and roemerine in leaves of Nelumbo nuciferaGaertn by high-performance liquid chromatography-photodiode array detection-electrospray mass spectrometry. Analytica Chimica Acta. 2005;538:129–133. [Google Scholar]
- 15.Gu S, Zhu G, Wang Y, Li Q, Wu X, Zhang J, Liu G, Li X. A sensitive liquid chromatography-tandem mass spectrometry method for pharmacokinetics and tissue distribution of nuciferine in rats. J Chromatogr B Analyt Technol Biomed Life Sci. 2014;961:20–28. doi: 10.1016/j.jchromb.2014.04.038. [DOI] [PubMed] [Google Scholar]
- 16.Ma J, Cai J, Lin G, Chen H, Wang X, Wang X, Hu L. Development of LC-MS determination method and back-propagation ANN pharmacokinetic model of corynoxeine in rat. J Chromatogr B Analyt Technol Biomed Life Sci. 2014;959:10–15. doi: 10.1016/j.jchromb.2014.03.024. [DOI] [PubMed] [Google Scholar]
- 17.Wen C, Lin C, Cai X, Ma J, Wang X. Determination of sec-O-glucosylhamaudol in rat plasma by gradient elution liquid chromatography-mass spectrometry. J Chromatogr B Analyt Technol Biomed Life Sci. 2014;944:35–38. doi: 10.1016/j.jchromb.2013.11.001. [DOI] [PubMed] [Google Scholar]
- 18.Zhang Q, Wen C, Xiang Z, Ma J, Wang X. Determination of CUDC-101 in rat plasma by liquid chromatography mass spectrometry and its application to a pharmacokinetic study. J Pharm Biomed Anal. 2014;90:134–138. doi: 10.1016/j.jpba.2013.11.031. [DOI] [PubMed] [Google Scholar]
- 19.Wang X, Chen M, Wen C, Zhang Q, Ma J. Determination of chidamide in rat plasma by LC-MS and its application to pharmacokinetics study. Biomed Chromatogr. 2013;27:1801–1806. doi: 10.1002/bmc.3001. [DOI] [PubMed] [Google Scholar]
- 20.Ma J, Ding X, Sun C, Lin C, An X, Lin G, Yang X, Wang X. Development and validation a liquid chromatography mass spectrometry for determination of solasodine in rat plasma and its application to a pharmacokinetic study. J Chromatogr B Analyt Technol Biomed Life Sci. 2014;963:24–28. doi: 10.1016/j.jchromb.2014.05.031. [DOI] [PubMed] [Google Scholar]
- 21.Ma J, Lin C, Wen C, Xiang Z, Yang X, Wang X. Determination of bicuculline in rat plasma by liquid chromatography mass spectrometry and its application in a pharmacokinetic study. J Chromatogr B Analyt Technol Biomed Life Sci. 2014;953-954:143–146. doi: 10.1016/j.jchromb.2014.02.006. [DOI] [PubMed] [Google Scholar]
- 22.Du J, Zhang Y, Chen Y, Liu D, Chen X, Zhong D. Enantioselective HPLC determination and pharmacokinetic study of secnidazole enantiomers in rats. J Chromatogr B Analyt Technol Biomed Life Sci. 2014;965:224–230. doi: 10.1016/j.jchromb.2014.06.036. [DOI] [PubMed] [Google Scholar]
- 23.Hu L, Hong G, Ma J, Wang X, Lin G, Zhang X, Lu Z. Clearance Rate and BP-ANN Model in Paraquat Poisoned Patients Treated with Hemoperfusion. Biomed Res Int. 2015;2015:298253. doi: 10.1155/2015/298253. [DOI] [PMC free article] [PubMed] [Google Scholar]


