

Abstract
Aim: to evaluate the performance and accuracy of Controlled attenuation parameter CAP for hepatic steatosis detection. Methods: PubMed, EBSCO, Elsevier Science, Ovid, and Wiley were selected to search studies until August 31, 2014. Quality Assessment of Diagnostic Accuracy Studies checklist was used to assess the quality of included studies. Heterogeneity was evaluated using Q test. Sensitivity, specificity, diagnostic odds ratio (DOR), and the area under curve (AUC) with its 95% confidence intervals (CIs) were calculated to evaluate the accuracy of CAP for assessment of hepatic steatosis stage (≥ S1, ≥ S2 and ≥ S3). Results: Totally 11 studies (13 cohorts) with high methodological qualities were identified. The summary point estimations with 95% CIs of sensitivity, specificity, AUC and DORs were 0.78 (0.71, 0.84), 0.79 (0.70, 0.86), 0.86 (0.82, 0.88), and 14 (7, 27) for ≥ S1; 0.82 (0.74, 0.88), 0.79 (0.73, 0.85), 0.88 (0.85, 0.90) and 18 (10, 30) for ≥ S2; 0.86 (0.82, 0.89), 0.89 (0.86, 0.92), 0.94 (0.91, 0.96) and 51 (35, 76) for ≥ S3. Significant heterogeneity was found among the studies in ≥ S1 and ≥ S3. Threshold effect was existed in ≥ S3, but not in ≥ S1 and ≥ S2. Publication bias was not existed in ≥ S1 and ≥ S2 except ≥ S3. Conclusion: CAP provides good sensitivity and specificity for detection of ≥ S1, ≥ S2, and ≥ S3 steatosis. However, future studies with large samples are still necessary to confirm the clinical application.
Keywords: Controlled attenuation parameter, hepatic steatosis, diagnostic meta-analysis
Introduction
Hepatic steatosis is characterized by an accumulation of fat mass > 5% of liver wet weight or > 5% of the hepatocytes containing fatty deposits [1]. Hepatic steatosis is caused by accumulation of triglycerides (TG) in hepatocytes. The other causes for hepatic steatosis include alcohol abuse, viral hepatitis, nutritional administration, medications, and acute fatty liver of pregnancy [2,3]. The hepatic steatosis can lead to the metabolic dysfunction of liver, which may progress to irreversible liver damage, fibrosis, cirrhosis, and hepatocellular carcinoma [4]. The incidence is increasing especially in countries with high rates of obesity and type 2 diabetes [5,6]. Therefore, accurate diagnosis of hepatic steatosis via detecting its extent plays an important role in evaluating the clinical prognosis.
Although liver biopsy is traditionally used as the gold standard for hepatic steatosis diagnosis, it has several disadvantages which make it not a first-line test. For example, liver biopsy is invasive, has sample variability and low acceptance for patients, and may associate with severe complications [7,8]. In recent years, efforts have been made to develop some noninvasive methods for hepatic steatosis assessment. Two scoring systems, the Fatty Liver Index and Hepatic Steatosis Index, have been developed, but they were not extensively validated in external data [9,10].
FibroScan, as the advanced transient elastography device, has been regarded as an optimal technique and has shown positive results for detecting the degree of hepatic steatosis [11]. FibroScan is a noninvasive examination and can distinguish the patients with chronic liver disease away from liver biopsy. It is reported that the results of FibroScan have good repeatability which can used as continuous observation indexes [1]. Based on the ultrasonic properties of the radiofrequency and back propagated signals coupled with the FibroScan, a novel technology, namely controlled attenuation parameter (CAP), was developed to determine the severity of hepatic steatosis. Using Field II simulations, Sasso et al. [12] firstly validated CAP as an estimate method of ultrasonic attenuation at 3.5 MHz, and they suggested CAP was an immediate and efficient process to detect and quantify hepatic steatosis. Moreover, Shi and his colleagues [13] had performed a meta-analysis to assess the diagnostic accuracy of CAP. Nine studies with 11 cohorts have been analyzed in the meta-analysis, and they demonstrated that CAP has good sensitivity and specificity for hepatic steatosis detection; however, it is limited in the accuracy of steatosis. In addition, some new studies about CAP detection for hepatic steatosis have been published after this study. Therefore, we conducted a meta-analysis to evaluate the performance and accuracy of CAP for hepatic steatosis detection.
Materials and methods
Data sources and searches
PubMed (http://www.ncbi.nlm.nih.gov/pubmed/), EBSCO (http://search.ebscohost.com/), Elsevier Science (http://www.elsevier.com/), Ovid (http://gateway.ovid.com/), and Wiley (http://onlinelibrary.wiley.com/) were selected to search studies until August 31, 2014. The search terms were “transient elastography” and “liver steatosis”, “hepatic steatosis” in combination with “controlled attenuation parameter” or “CAP”. References of the eligible articles were also searched.
Inclusion and exclusion criteria
The inclusion criteria were: (1) studies evaluated liver steatosis using CAP; (2) the diagnostic gold standard was liver biopsy; (3) the pathologic category for liver steatosis was classified as stage 0 (S0: < 5% steatosis), stage 1 (≥ S1: 5%-33% steatosis) , stage 2 (≥ S2: 34%-66% steatosis) and stage 3 (≥ S3: > 66% steatosis); (4) the assessment index contained sensitivity, specificity, negative predictive value (NPV), and/or positive predictive value (PPV). (5) the language was restricted to English.
The exclusion criteria were as follows: (1) studies without original data; (2) the subjects of the study were less than 39.
Study selection and data extraction
Two investigators respectively assessed the eligible studies and extracted data from the included articles. Disagreements were settled by discussion with a third investigator. The data comprised of the first authors, county, publication year, the number of cases, age, body mass index (BMI), gender, liver disease, prevalence of ≥ S1, ≥ S2, and ≥ S3, and CAP cut-off values for ≥ S1, ≥ S2, and ≥ S3. Moreover, true positive, false positive, true negative, and false negative were abstracted to calculate sensitivity, specificity, PPV and NPV.
Quality assessment
Quality Assessment of Diagnostic Accuracy Studies (QUADAS) checklist was used to assess the quality of each study. The checklist has 14 items, and each item is scored as “yes”, “no”, or “unclear”. If the item scored “yes”, then received 1 point; if scored “no” or “unclear”, then received 0 point. Score > 10 was considered to be high methodological quality.
Data synthesis and statistical analysis
Sensitivity, specificity, positive likelihood ratio, negative likelihood ratio, and diagnostic odds ratio (DOR) with its 95% confidence intervals (CIs) were calculated to evaluate the accuracy of CAP. The threshold effect, as the primary cause of heterogeneity in test accuracy studies, was also analyzed with Meta-DiSc [14]. Hierarchical summary receiver operating characteristic (HSROC) curves were plotted, and the area under curve (AUC) with corresponding 95% CI was also counted. Heterogeneity was evaluated using Q test, and P < 0.05 represents the presence of heterogeneity. Publication bias was decided using Deek’s funnel plot asymmetry test. All statistical analyses were conducted by STATA version 11.0 (StataCorp, College Station, TX, USA), briefly the MIDAS and METANDI commands.
Results
Searching result and study characteristics
The selection flowchart is shown in Figure 1. According to the inclusion and exclusion criteria, a total of 69 studies were retrieved. Among them, 20 were duplications and 13 had low correlation. Besides, 8 reviews, 2 letters, 2 case reports, 3 studies without control, and 10 studies without sufficient data were eliminated. Therefore, a total of 11 studies [12,15-24] were identified in our research. The result of quality assessment suggested that all included studies had high methodological qualities (Figure 2).
Figure 1.
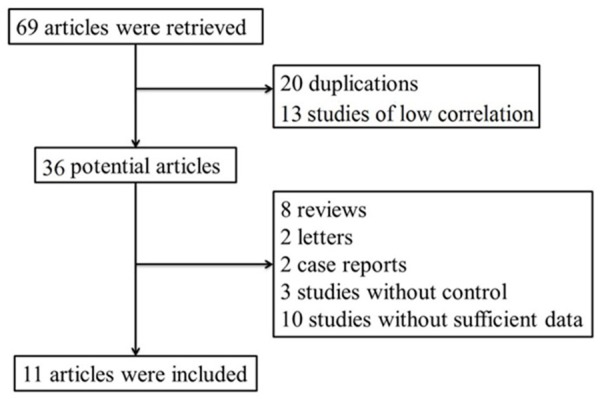
Flowchart of the study searching.
Figure 2.
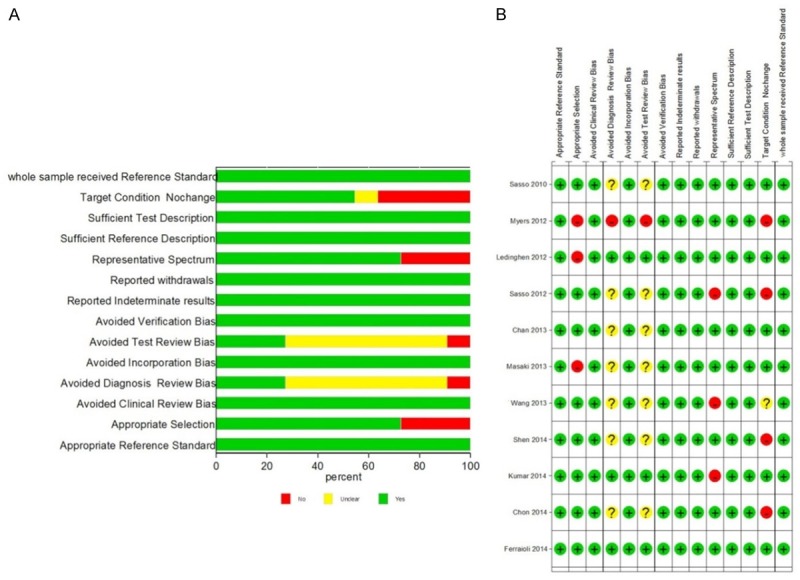
The methodological quality assessment of included studies using Quality Assessment of Diagnostic Accuracy Studies (QUADAS) checklist.
The extracted characteristics are listed in Table 1. A total of 2076 subjects were included in the 11 studies. Particularly, Kumer et al. [18] performed 3 cohort studies that contained 146 chronic hepatitis B virus (HBV) infected patients, 108 chronic hepatitis C virus (HCV) infected patients, and 63 non-alcoholic fatty liver disease (NAFLD) patients. Thus, there were 13 cohorts in our study.
Table 1.
The extracted characteristics of the included studies
| Author | Country | Year | Journal | Liver disease | Case number | The percentage of males (%) | Age | BMI |
|---|---|---|---|---|---|---|---|---|
| M Sasso | France | 2010 | Ultra in Med Bio | CLD 17 | 73 | 64 | 49±12 | 25±4 |
| ALD 39 | ||||||||
| NAFLD 17 | ||||||||
| RP Myers | Canada | 2012 | Liver Inter | Hepatitis 67 | 153 | 93.7 | 50 (41-56) | 32 (30-34) |
| NAFLD 72 | ||||||||
| Other 14 | ||||||||
| VD Ledinghen | France | 2012 | Liver Inter | NAFLD 28 | 112 | 48.2 | 53.8±12.2 | 25.8±4.2 |
| HCV 40 | ||||||||
| ALD 6 | ||||||||
| Other 38 | ||||||||
| M Sasso | France | 2012 | J V Hepato | HCV | 615 | 63.5 | 47.9±11.6 | 24.1±3.7 |
| M Kumar | Malaysia | 2013 | J Gastro Hepato | HBV 146 | 146 | 77.4 | 38 (18-71) | 24.3±3.6 |
| HCV 108 | 108 | 56.5 | 46.5 (18-71) | 24.7±3.3 | ||||
| NAFLD 63 | 63 | 86.8 | 37 (18-66) | 25.1±2.0 | ||||
| K Masaki | Japan | 2013 | Hepato Rea | HBV 17 | 155 | 59.3 | 55 (24-91) | 24.4 (15.4-39.2) |
| HCV 58 | ||||||||
| NASH 40 | ||||||||
| Other 40 | ||||||||
| CY Wang | China Tianjin | 2014 | W J Gastra | HBV | 88 | 70.4 | 38.32±12.99 | 24.16±4.97 |
| Feng Shen | China shanghai | 2014 | W J Gastra | NAFLD 52 | 152 | 69.7 | 35 (28-49) | 24.9 (22.5-27.7) |
| HBV 100 | ||||||||
| WK Chan | India | 2014 | J Gastro Hepato | NAFLD 101 | 161 | 51.5 | 50.3±11.3 | 29.4±3.9 |
| Control 60 | ||||||||
| YE Chon | Korea | 2014 | Liver Inter | CLD 135 | 135 | 64.4 | 51 (18-63) | 24.4 (14.3-33.8) |
| G Ferraioli | Italy | 2014 | W J Gastra | HBV 82 | 115 | 73.9 | 43.1±10.5 | 24.8±4.2 |
| HCV 28 | ||||||||
| HIV, HCV 5 |
CLD: chronic liver disease; ALD: alcoholic liver disease; NAFLD: non-alcoholic fatty liver disease; HCV: hepatitis C virus; HBV: hepatitis B virus; NASH: nonalcoholic steatohepatitis; HIV: Human Immunodeficiency Virus; BMI: body mass index.
The diagnostic accuracy of CAP
CAP accuracy for ≥ S1 was evaluated in 11 studies containing 12 cohorts (Figure 3). The CAP cut-off values ranged from 214 to 289 dB/m, and the median was 238 and 250 dB/m (Table 2). The summary sensitivity and specificity were 0.78 (95% CI: 0.71, 0.84) and 0.79 (95% CI: 0.70, 0.86) respectively. The positive likelihood ratio was 3.7 (95% CI: 2.5, 5.6) and the negative likelihood ratio was 0.27 (95% CI: 0.19, 0.39). The summary DOR was 14 (95% CI: 7, 27), and the AUC was 0.86 (95% CI: 0.82, 0.88, Figure 5A).
Figure 3.
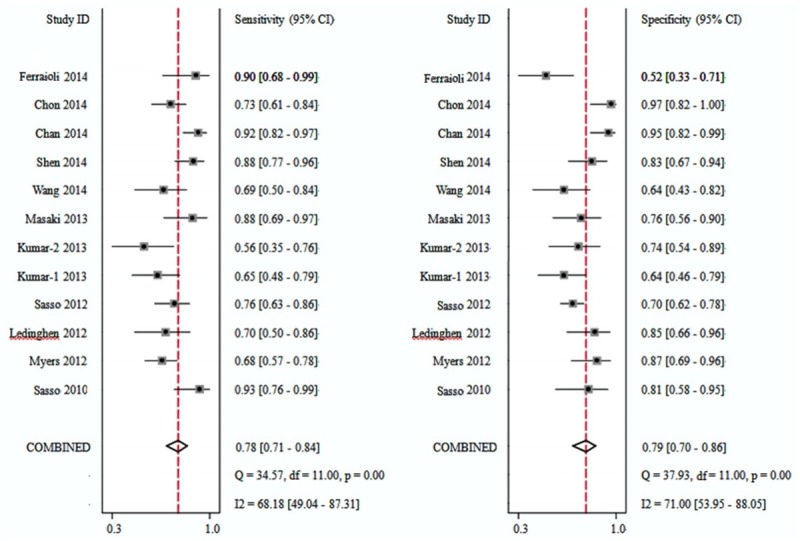
Forest plots of sensitivity and specificity of controlled attenuation parameter (CAP) for the detection of stage 1 (S1) hepatic steatosis.
Table 2.
The performance of CAP in the included studies
| Author | ≥ S1 | ≥ S2 | ≥ S3 | |||||||||||||||
|---|---|---|---|---|---|---|---|---|---|---|---|---|---|---|---|---|---|---|
|
|
|
|
||||||||||||||||
| CAP cut-off | AUC | Se | Sp | PPV | NPV | CAP cut-off | AUC | Se | Sp | PPV | NPV | CAP cut-off | AUC | Se | Sp | PPV | NPV | |
| M Sasso | 238 | 0.91 | 0.91 | 0.81 | 0.87 | 0.87 | 259 | 0.95 | 0.89 | 0.86 | 0.8 | 0.92 | 292 | 0.89 | 1 | 0.78 | 0.28 | 1 |
| RP Myers | 289 | 0.79 | 0.68 | 0.88 | 0.94 | 0.49 | 288 | 0.76 | 0.85 | 0.62 | 0.55 | 0.88 | 283 | 0.7 | 0.94 | 0.47 | 0.17 | 0.98 |
| VD Ledinghen | 266 | 0.84 | 0.69 | 0.85 | 0.83 | 0.73 | 311 | 0.86 | 0.57 | 0.94 | 0.81 | 0.83 | 318 | 0.93 | 0.87 | 0.91 | 0.65 | 0.97 |
| M Sasso | 222 | 0.82 | 0.76 | 0.71 | 0.53 | 0.87 | 233 | 0.86 | 0.87 | 0.74 | 0.33 | 0.98 | 290 | 0.88 | 0.78 | 0.93 | 0.15 | 1 |
| M Kumar | 214 | 0.683 | 0.649 | 0.64 | 0.667 | 0.62 | 255 | 0.793 | 0.778 | 0.8 | 0.457 | 0.94 | 266 | 0.841 | 0.75 | 0.804 | 0.182 | 0.982 |
| 224 | 0.658 | 0.576 | 0.73 | 0.667 | 0.651 | 251 | 0.667 | 0.583 | 0.774 | 0.424 | 0.867 | 305 | 0.916 | 0.714 | 0.921 | 0.385 | 0.976 | |
| / | / | / | / | / | / | 258 | 0.79 | 0.784 | 0.731 | 0.806 | 0.704 | 283 | 0.763 | 0.714 | 0.679 | 0.022 | 0.4 | |
| K Masaki | 280 | 0.878 | 0.87 | 0.77 | 0.752 | 0.87 | / | / | / | / | / | / | / | / | / | / | / | / |
| CY Wang | 220 | 0.711 | 0.694 | 0.72 | 0.717 | 0.633 | 230 | 0.868 | 0.833 | 0.781 | 0.893 | 0.65 | 284 | 0.974 | 1 | 0.969 | 1 | 0.857 |
| Feng Shen | 253 | 0.92 | 0.888 | 0.83 | 0.878 | 0.839 | 285 | 0.92 | 0.933 | 0.832 | 0.7 | 0.967 | 310 | 0.88 | 0.923 | 0.791 | 0.293 | 0.991 |
| WK Chan | 263 | 0.97 | 0.918 | 0.94 | 0.957 | 0.881 | 263 | 0.86 | 0.969 | 0.677 | 0.67 | 0.97 | 281 | 0.75 | 1 | 0.531 | 0.169 | 1 |
| Y E Chon | 250 | 0.885 | 0.731 | 0.95 | 0.971 | 0.615 | 299 | 0.894 | 0.824 | 0.861 | 0.667 | 0.935 | 327 | 0.8 | 0.778 | 0.841 | 0.259 | 0.981 |
| G Ferraioli | 219 | 0.76 | 0.911 | 0.52 | 0.569 | 0.892 | 296 | 0.82 | 0.6 | 0.915 | 0.529 | 0.935 | / | / | / | / | / | / |
S1: stage 1; S2: stage 2; S3: stage 3; CAP: controlled attenuation parameter; AUC: area under curve; Se: sensitivity; Sp: specificity; PPV: positive predictive value; NPV: negative predictive value.
Figure 5.
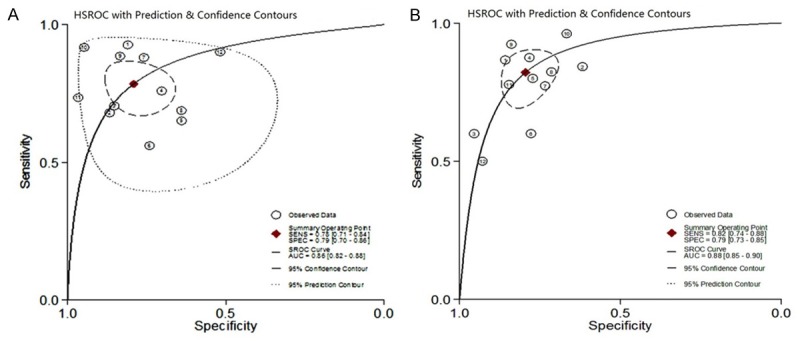
Hierarchical summary receiver operating characteristic (HSROC) curves of controlled attenuation parameter (CAP) for the detection of hepatic steatosis. A. Detection of stage 1 (S1) hepatic steatosis; B. Detection of stage 2 (S2) hepatic steatosis.
CAP accuracy for ≥ S2 was evaluated in 10 studies containing 12 cohorts (Figure 4). The CAP cut-off values ranged from 230 to 311 dB/m, and the median was 259 and 263 dB/m (Table 2). The summary sensitivity and specificity were 0.82 (95% CI: 0.74, 0.88) and 0.79 (95% CI: 0.73, 0.85) respectively. The positive likelihood ratio was 4.0 (95% CI: 3.0, 5.3) and the negative likelihood ratio was 0.22 (95% CI: 0.15, 0.33). The summary DOR was 18 (95% CI: 10, 30), and the AUC was 0.88 (95% CI: 0.85, 0.90, Figure 5B).
Figure 4.
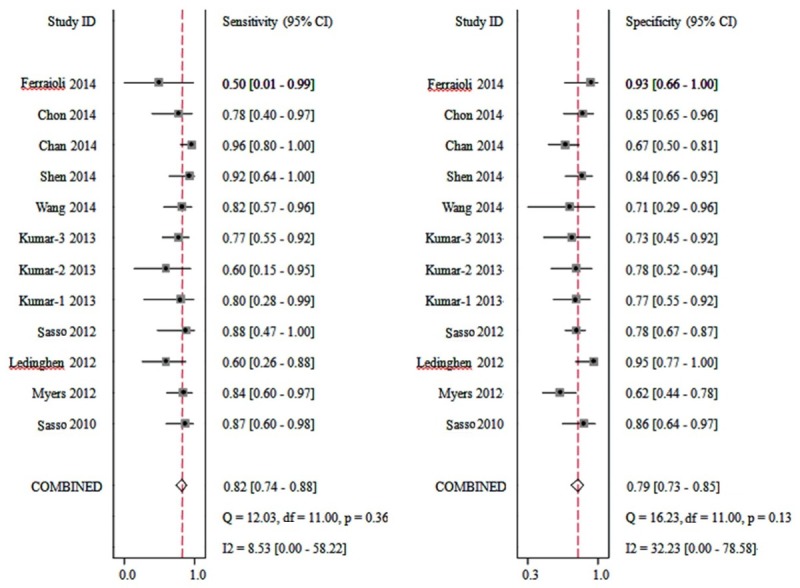
Forest plots of sensitivity and specificity of controlled attenuation parameter (CAP) for the detection of stage 2 (S2) hepatic steatosis.
Forest plots of sensitivity and specificity of CAP accuracy for ≥ S3 was not drawn because of the limited data. The results are shown in Tables 2 and 3. The CAP cut-off values ranged from 266 to 327 dB/m, and the median was 290 dB/m. The summary sensitivity was 0.86 (95% CI: 0.82, 0.89) and specificity was 0.89 (95% CI: 0.86, 0.92). The positive likelihood ratio was 8.1 (95% CI: 6.3, 10.4) and the negative likelihood ratio was 0.16 (95% CI: 0.12, 0.20). The summary DOR was 51 (95% CI: 35, 76), and the AUC was 0.94 (95% CI: 0.91, 0.96).
Table 3.
The results of controlled attenuation parameter (CAP) for the detection of stage 1 (≥ S1), stage 2 (≥ S2) and stage 3 (≥ S3) hepatic steatosis
| Disease | ≥ S1 | ≥ S2 | ≥ S3 | ||||
|---|---|---|---|---|---|---|---|
|
|
|
|
|||||
| Point estimation | 95% confidence intervals | Point estimation | 95% confidence intervals | Point estimation | 95% confidence intervals | ||
| Indexes | Sensitivity | 0.78 | [0.71, 0.84] | 0.82 | [0.74, 0.88] | 0.86 | [0.82, 0.89] |
| Specificity | 0.79 | [0.70, 0.86] | 0.79 | [0.73, 0.85] | 0.89 | [0.86, 0.92] | |
| Positive likelihood ratio | 3.7 | [2.5, 5.6] | 4.0 | [3.0, 5.3] | 8.1 | [6.3, 10.4] | |
| Negative likelihood ratio | 0.27 | [0.19, 0.39] | 0.22 | [0.15, 0.33] | 0.16 | [0.12, 0.20] | |
| Diagnostic odds ratio | 14 | [7, 27] | 18 | [10, 30] | 51 | [35, 76] | |
| AUC | 0.86 | [0.82-0.88] | 0.88 | [0.85-0.90] | 0.94 | [0.91-0.96] | |
Heterogeneity examination, threshold effect, and publication bias
Significant heterogeneity was found among the studies involved in ≥ S1 (Q = 5.732, P = 0.028) and ≥ S3 (Q = 49.5, P < 0.0001). Threshold effect was existed among studies involved in ≥ S3 (P < 0.03), but not in ≥ S1 (P = 0.09) or ≥ S2 (P = 1). Moreover, basing on the Deek’s funnel plot asymmetry test, publication bias was not existed among the included studies in ≥ S1 (t = -0.12, P = 0.91) and ≥ S2 (t = 1.75, P = 0.216) except for ≥ S3 (t = 1.75, P = 0.093). The results are presented in Table 4.
Table 4.
Heterogeneity examination, threshold effect, and publication bias
| ≥ S1 | ≥ S2 | ≥ S3 | |||||||
|---|---|---|---|---|---|---|---|---|---|
|
|
|
|
|||||||
| Statistics | P value | Result | Statistics | P value | Result | Statistics | P value | Result | |
| Heterogeneity | Q = 5.732 | 0.028 | Yes | Q = 49.5 | 3.045 | No | Q = 49.5 | < 0.0001 | Yes |
| Threshold effect | / | 0.09 | No | / | 1 | No | / | < 0.03 | Yes |
| Publication bias | t = -0.12 | 0.910 | No | t = 1.75 | 0.216 | No | t = 1.75 | 0.093 | Yes |
Discussion
CAP has been performed to evaluate the grades of hepatic steatosis in different population with various causes. In the present study, a total of 11 studies with 13 cohorts were included. According to the results, CAP had good sensitivity, specificity, and high AUC for detection of ≥ S1, ≥ S2, and ≥ S3 steatosis that were diagnosed by liver biopsy.
Several non-invasive methods including ultrasound, computed tomography (CT), magnetic resonance imaging (MRI), and hydrogen (1H) MRI have been used in detection of hepatic steatosis, but some limitations still exist [25,26]. Ultrasound is accepted for screening of fatty liver because it is inexpensive and it has an acceptable sensitivity and specificity, but it cannot reliably quantify fat accumulation and distinguish fibrosis from steatosis [27]. Non-enhanced CT has been suggested to quantify > 30% histologic grade of hepatic steatosis with 100% specificity and 82% sensitivity [28]. However, the CT values were demonstrated to be significantly varied with different manufactures’ multi-detector row CT or different generations of CT scanners [29]. Besides, the radiation exposure should be also taken into consideration especially for longitudinal studies and for children. 1H MRI is conducted in the molecular level in vivo. Both and colleagues [25] demonstrated that the mean sensitivity and specificity range for MRI were 82.0-97.4% and 76.1-95.3%, and for 1H MRI were 72.7-88.5% and 92.0-95.7% respectively. Nevertheless, it should be mentioned that the imaging procedure and the examination result are too complex for fully understanding and that the 1H MRI is not available for all clinical scanners [26].
CAP, as a novel method for detection and quantification of hepatic steatosis has multiple advantages. First, its use is not influenced by liver stiffness and fibrosis, which means CAP can be used to evaluate steatosis and fibrosis at the same time [17]. Second, it is an immediate, objective, inexpensive, and easy performed method to detect and quantify steatosis compared with other assessment modalities. Third, CAP probes a liver volume approximately 100 times larger than liver biopsies, which indicates that the influence by sample error is less for CAP. Consequently, based on these features, CAP will be popularly accepted as a reliable assessment tool for steatosis screening and quantification by radiologists in clinical practice.
A previous meta-analysis was conducted by Shi et al. [13]. In their study, a total of 9 studies were analyzed, and the results demonstrated that CAP offered good sensitivity (≥ S1: 0.78, 0.69-0.84; ≥ S2: 0.85, 0.74-0.92; ≥ S3: 0.83, 0.76-0.89) and specificity (≥ S1: 0.79, 0.68-0.86; ≥ S2: 0.79, 0.68-0.87; ≥ S3: 0.79, 0.68-0.87), and high HSROC (≥ S1: 0.85, 0.81-0.88; ≥ S2: 0.88, 0.85-0.91; ≥ S3: 0.87, 0.84-0.90). But, they did not retrieve literature published in 2014. In the current meta-analysis, another 5 studies published in 2014 were included and 3 studies in the previous study were excluded. Among the 3 studies, 2 studies respectively performed by Wong et al. [30] and Enooku et al. [31] only have abstract that cited from conferences and the study performed by Friendrich-Rust et al. [32] did not provide sufficient data. According to our results, no significant change was found for specificity, sensitivity, and HSROC compared with the previous study. Nevertheless, the threshold effect was also analyzed in the present study, which demonstrated that the difference in threshold was the primary cause of heterogeneity among the included studies.
In addition, heterogeneity was existed among the included studies. This heterogeneity may be caused by clinical heterogeneity and the existed threshold effect, since the race of studied subjected, the evaluation system of gold standard, and the cut-off value of transient elastography diagnose were different among the included studies. Moreover, bias for steatosis staging detected by FibroScan was found among different studies, as a unified reference for all stages of fibrosis (F0-F4) was not unified worldwide. For example, the cut-off value for obvious fibrosis ranges from 5.8 kpa to 9.3 kpa, and for early liver cirrhosis ranges from 9.4 kpa to 15.4 kpa. Thus, more studies with larger samples are still needed for further validation.
There are some limitations in the present study. Firstly, FibroScan itself has limitations, which may have an influence on the accuracy and clinical application. For example, the accuracy would decrease for female, elder and high BMI patients. Extrahepatic cholestasis, ascites, large blood vessels around liver, and narrow rib space may also influence the detecting and limit the use of FibroScan. In addition, liver stiffness may also correlate with the serum Alanine transaminase (ALT). Secondly, a significant heterogeneity was presented, which may influence the reliability we concluded though the bivariate model has been selected. Lastly, subgroup analyses of different causes were not conducted because of the limited studies and insufficient information.
Conclusion
In conclusion, the present meta-analysis demonstrates that CAP provides good sensitivity and specificity for detection of ≥ S1, ≥ S2, and ≥ S3 steatosis. We speculate that CAP is an efficient method to detect hepatic steatosis severity. However, future studies with large samples are still necessary to confirm or evaluate the clinical application.
Acknowledgements
This study was supported by Medical Guided Project of Science and Technology Commission of Shanghai Municipality (Grant No. 124119b0900).
Disclosure of conflict of interest
None.
References
- 1.Sasso M, Miette V, Sandrin L, Beaugrand M. The controlled attenuation parameter (CAP): A novel tool for the non-invasive evaluation of steatosis using Fibroscan®. Clin Res Hepatol Gastroenterol. 2012;36:13–20. doi: 10.1016/j.clinre.2011.08.001. [DOI] [PubMed] [Google Scholar]
- 2.Valenti L, Fracanzani AL, Bugianesi E, Dongiovanni P, Galmozzi E, Vanni E, Canavesi E, Lattuada E, Roviaro G, Marchesini G. HFE genotype, parenchymal iron accumulation, and liver fibrosis in patients with nonalcoholic fatty liver disease. Gastroenterology. 2010;138:905–912. doi: 10.1053/j.gastro.2009.11.013. [DOI] [PubMed] [Google Scholar]
- 3.Ohata K, Hamasaki K, Toriyama K, Matsumoto K, Saeki A, Yanagi K, Abiru S, Nakagawa Y, Shigeno M, Miyazoe S. Hepatic steatosis is a risk factor for hepatocellular carcinoma in patients with chronic hepatitis C virus infection. Cancer. 2003;97:3036–3043. doi: 10.1002/cncr.11427. [DOI] [PubMed] [Google Scholar]
- 4.David K, Kowdley KV, Unalp A, Kanwal F, Brunt EM, Schwimmer JB NASH CRN Research Group. Quality of life in adults with nonalcoholic fatty liver disease: baseline data from the nonalcoholic steatohepatitis clinical research network. Hepatology. 2009:1904–1912. doi: 10.1002/hep.22868. [DOI] [PMC free article] [PubMed] [Google Scholar]
- 5.Blachier M, Leleu H, Peck-Radosavljevic M, Valla DC, Roudot-Thoraval F. The burden of liver disease in Europe: a review of available epidemiological data. J Hepatol. 2013;58:593–608. doi: 10.1016/j.jhep.2012.12.005. [DOI] [PubMed] [Google Scholar]
- 6.Farrell GC, Larter CZ. Nonalcoholic fatty liver disease: from steatosis to cirrhosis. Hepatology. 2006;43:S99–S112. doi: 10.1002/hep.20973. [DOI] [PubMed] [Google Scholar]
- 7.Grandison GA, Angulo P. Can NASH be diagnosed, graded, and staged noninvasively? Clin Liver Dis. 2012;16:567–585. doi: 10.1016/j.cld.2012.05.001. [DOI] [PMC free article] [PubMed] [Google Scholar]
- 8.Rockey DC, Caldwell SH, Goodman ZD, Nelson RC, Smith AD. Liver biopsy. Hepatology. 2009;49:1017–1044. doi: 10.1002/hep.22742. [DOI] [PubMed] [Google Scholar]
- 9.Lee JH, Kim D, Kim HJ, Lee CH, Yang JI, Kim W, Kim YJ, Yoon JH, Cho SH, Sung MW. Hepatic steatosis index: a simple screening tool reflecting nonalcoholic fatty liver disease. Digest Liver Dis. 2010;42:503–508. doi: 10.1016/j.dld.2009.08.002. [DOI] [PubMed] [Google Scholar]
- 10.Bedogni G, Bellentani S, Miglioli L, Masutti F, Passalacqua M, Castiglione A, Tiribelli C. The Fatty Liver Index: a simple and accurate predictor of hepatic steatosis in the general population. BMC Gastroenterol. 2006;6:33. doi: 10.1186/1471-230X-6-33. [DOI] [PMC free article] [PubMed] [Google Scholar]
- 11.Wong VW, Vergniol J, Wong GLH, Foucher J, Chan HLY, Le Bail B, Choi PC, Kowo M, Chan AWH, Merrouche W. Diagnosis of fibrosis and cirrhosis using liver stiffness measurement in nonalcoholic fatty liver disease. Hepatology. 2010;51:454–462. doi: 10.1002/hep.23312. [DOI] [PubMed] [Google Scholar]
- 12.Sasso M, Beaugrand M, De Ledinghen V, Douvin C, Marcellin P, Poupon R, Sandrin L, Miette V. Controlled attenuation parameter (CAP): a novel VCTE™ guided ultrasonic attenuation measurement for the evaluation of hepatic steatosis: preliminary study and validation in a cohort of patients with chronic liver disease from various causes. Ultrasound in Medicine & Biology. 2010;36:1825–1835. doi: 10.1016/j.ultrasmedbio.2010.07.005. [DOI] [PubMed] [Google Scholar]
- 13.Shi KQ, Tang JZ, Zhu XL, Ying L, Li DW, Gao J, Fang YX, Li GL, Song YJ, Deng ZJ. Controlled attenuation parameter for the detection of steatosis severity in chronic liver disease: A meta-analysis of diagnostic accuracy. J Gastroenterol Hepatol. 2014;29:1149–1158. doi: 10.1111/jgh.12519. [DOI] [PubMed] [Google Scholar]
- 14.Zamora J, Abraira V, Muriel A, Khan K, Coomarasamy A. Meta-DiSc: a software for meta-analysis of test accuracy data. BMC Med Res Methodol. 2006;6:31. doi: 10.1186/1471-2288-6-31. [DOI] [PMC free article] [PubMed] [Google Scholar]
- 15.Myers RP, Pollett A, Kirsch R, Pomier-Layrargues G, Beaton M, Levstik M, Duarte-Rojo A, Wong D, Crotty P, Elkashab M. Controlled Attenuation Parameter (CAP): a noninvasive method for the detection of hepatic steatosis based on transient elastography. Liver Int. 2012;32:902–910. doi: 10.1111/j.1478-3231.2012.02781.x. [DOI] [PubMed] [Google Scholar]
- 16.Lédinghen V, Vergniol J, Foucher J, Merrouche W, Bail B. Non-invasive diagnosis of liver steatosis using controlled attenuation parameter (CAP) and transient elastography. Liver Int. 2012;32:911–918. doi: 10.1111/j.1478-3231.2012.02820.x. [DOI] [PubMed] [Google Scholar]
- 17.Sasso M, Tengher-Barna I, Ziol M, Miette V, Fournier C, Sandrin L, Poupon R, Cardoso AC, Marcellin P, Douvin C. Novel controlled attenuation parameter for noninvasive assessment of steatosis using Fibroscan®: validation in chronic hepatitis C. J Viral Hepat. 2012;19:244–253. doi: 10.1111/j.1365-2893.2011.01534.x. [DOI] [PubMed] [Google Scholar]
- 18.Kumar M, Rastogi A, Singh T, Behari C, Gupta E, Garg H, Kumar R, Bhatia V, Sarin SK. Controlled attenuation parameter for non-invasive assessment of hepatic steatosis: Does etiology affect performance? J Gastroenterol Hepatol. 2013;28:1194–1201. doi: 10.1111/jgh.12134. [DOI] [PubMed] [Google Scholar]
- 19.Masaki K, Takaki S, Hyogo H, Kobayashi T, Fukuhara T, Naeshiro N, Honda Y, Nakahara T, Ohno A, Miyaki D. Utility of controlled attenuation parameter measurement for assessing liver steatosis in Japanese patients with chronic liver diseases. Hepatol Res. 2013;43:1182–1189. doi: 10.1111/hepr.12094. [DOI] [PubMed] [Google Scholar]
- 20.Wang CY, Lu W, Hu DS, Wang GD, Cheng XJ. Diagnostic value of controlled attenuation parameter for liver steatosis in patients with chronic hepatitis B. World J Gastroenterol. 2014;20:10585. doi: 10.3748/wjg.v20.i30.10585. [DOI] [PMC free article] [PubMed] [Google Scholar]
- 21.Shen F, Zheng RD, Mi YQ, Wang XY, Pan Q, Chen GY, Cao HX, Chen ML, Xu L, Chen JN. Controlled attenuation parameter for non-invasive assessment of hepatic steatosis in Chinese patients. World J Gastroenterol. 2014;20:4702. doi: 10.3748/wjg.v20.i16.4702. [DOI] [PMC free article] [PubMed] [Google Scholar]
- 22.Chan WK, Mustapha N, Raihan N, Mahadeva S. Controlled attenuation parameter for the detection and quantification of hepatic steatosis in nonalcoholic fatty liver disease. J Gastroenterol Hepatol. 2014;29:1470–1476. doi: 10.1111/jgh.12557. [DOI] [PubMed] [Google Scholar]
- 23.Chon YE, Jung KS, Kim SU, Park JY, Park YN, Kim DY, Ahn SH, Chon CY, Lee HW, Park Y. Controlled attenuation parameter (CAP) for detection of hepatic steatosis in patients with chronic liver diseases: a prospective study of a native Korean population. Liver International. 2014;34:102–109. doi: 10.1111/liv.12282. [DOI] [PubMed] [Google Scholar]
- 24.Ferraioli G, Tinelli C, Lissandrin R, Zicchetti M, Dal Bello B, Filice G, Filice C. Controlled attenuation parameter for evaluating liver steatosis in chronic viral hepatitis. World J Gastroenterol. 2014;20:6626. doi: 10.3748/wjg.v20.i21.6626. [DOI] [PMC free article] [PubMed] [Google Scholar]
- 25.Bohte AE, van Werven JR, Bipat S, Stoker J. The diagnostic accuracy of US, CT, MRI and 1H-MRS for the evaluation of hepatic steatosis compared with liver biopsy: a meta-analysis. Europ Radiol. 2011;21:87–97. doi: 10.1007/s00330-010-1905-5. [DOI] [PMC free article] [PubMed] [Google Scholar]
- 26.Schwenzer NF, Springer F, Schraml C, Stefan N, Machann J, Schick F. Non-invasive assessment and quantification of liver steatosis by ultrasound, computed tomography and magnetic resonance. J Hepatol. 2009;51:433–445. doi: 10.1016/j.jhep.2009.05.023. [DOI] [PubMed] [Google Scholar]
- 27.Meek D, Mills P, Gray H, Duncan J, Russell R, McKillop J. A comparison of computed tomography, ultrasound and scintigraphy in the diagnosis of alcoholic liver disease. Br J Radiol. 1984;57:23–27. doi: 10.1259/0007-1285-57-673-23. [DOI] [PubMed] [Google Scholar]
- 28.Park SH, Kim PN, Kim KW, Lee SW, Yoon SE, Park SW, Ha HK, Lee MG, Hwang S, Lee SG. Macrovesicular Hepatic Steatosis in Living Liver Donors: Use of CT for Quantitative and Qualitative Assessment 1. Radiology. 2006;239:105–112. doi: 10.1148/radiol.2391050361. [DOI] [PubMed] [Google Scholar]
- 29.Birnbaum BA, Hindman N, Lee J, Babb JS. Multi-Detector Row CT Attenuation Measurements: Assessment of Intra-and Interscanner Variability with an Anthropomorphic Body CT Phantom 1. Radiology. 2007;242:109–119. doi: 10.1148/radiol.2421052066. [DOI] [PubMed] [Google Scholar]
- 30.Wong GL, Wong VW, Lai JW, Chim AM, Chan HL. Journal of gastroenterology and hepatology. Vol. 27. 111 River ST, Hoboken 07030-5774, NJ USA: Wiley-Blackwell; 2012. pp. 239–240. [Google Scholar]
- 31.Enooku K, Tateishi R, Fujiwara N, Mikami S, Minami T, Sato M, Uchino K, Kondo Y, Yoshida H, Ikeda H. 1330 Non-invasive measurement of liver steatosis by controlled attenuation parameter (CAP) using Fibroscan® in patients with nonalcoholic fatty liver disease (NAFLD) (NAFLD) J Hepatol. 2013;58:S536–S537. [Google Scholar]
- 32.Friedrich-Rust M, Romen D, Vermehren J, Kriener S, Sadet D, Herrmann E, Zeuzem S, Bojunga J. Acoustic radiation force impulse-imaging and transient elastography for non-invasive assessment of liver fibrosis and steatosis in NAFLD. Europ J Radiol. 2012;81:e325–e331. doi: 10.1016/j.ejrad.2011.10.029. [DOI] [PubMed] [Google Scholar]