Abstract
This study aimed to explore the effects of exogenous element exposure via the respiratory tract on the Se, Cd and Mo concentrations in different components of the peripheral blood in rats as well as to determine the correlations of the three trace elements concentrations among the components. The Sprague-Dawley rats were randomly divided into a control group and several experimental groups treated with different doses. The rats were exposed to a mixed trace element solution through 10 days of intratracheal instillation. The whole blood of all rats was collected and separated into three parts with Percoll density gradient centrifugation. The Se, Cd and Mo levels in whole blood, plasma, red blood cells (RBCs) and peripheral blood mononuclear cells (PBMCs) were determined by inductively coupled plasma mass spectrometry. The concentrations of the three trace elements increased together with the increase of the given doses (P<0.05), except Cd and Mo in the PBMCs. The three trace elements lacked linearity with the exposure doses in the PBMCs (r, 0.249-0.508), while the opposite was the case for the other components of the peripheral blood (r, 0.806-0.934). The correlation coefficients were higher (0.842-0.962) among the whole blood, plasma and RBCs than between PBMCs and other components, such as Se (0.376-0.529), Cd (0.495-0.604) and, especially, Mo (0.160-0.257). In conclusion, PBMCs might provide information about endogenous factors, and whole blood could more accurately reflect the effects of exogenous factors compared to other blood components.
Keywords: Trace elements, peripheral blood mononuclear cell, Sprague-Dawley rats, percoll density gradient centrifugation
Introduction
Trace elements play a fundamental role in maintaining human health. The main physiological functions of trace elements act as an integral part of various enzyme systems, working as essential ingredients or cofactors of hormones and vitamins, forming metalloproteins with specific functions and more [1,2]. Many studies have suggested that the occurrence and progression of a variety of endemic diseases, tumors and chronic diseases are related to imbalances of some trace elements. Therefore, the clinical detection of trace elements for monitoring the load of trace elements in human bodies and evaluating the health condition has gained increasing attention.
Blood samples are most commonly used in the clinical detection of trace elements because the pretreatment method is simple and the samples could reflect the absorption and metabolism of trace elements in bodies in a timely manner. The serum and plasma are the most widely used blood components for clinical testing. However, the element concentrations in serum or plasma are largely influenced by many exogenous factors [3], such as environmental pollution, regional differences, smoking, and diet [4,5], especially when the element levels are relatively low [6]. Compared to in the serum or plasma, the element levels in the red blood cells (RBCs) are relatively stable. Moreover, some heavy metals, such as lead, cadmium, and copper, in the blood mainly accumulate in the RBCs, demonstrating that erythrocytes are more sensitive indicators for the early detection of certain elements. For the lymphocytes, which is the main component of peripheral blood mononuclear cells (PBMCs), previous studies have demonstrated that lymphocytes are more similar to organ cells than erythrocytes and multinucleate leukocytes, and lymphocytes more accurately reflect trace element levels [7,8]. However, it is unknown how the element concentrations change simultaneously in different blood components in the presence of exogenous factors.
Studies on the element levels in PBMCs have mainly focused on the trace elements calcium, magnesium, zinc, copper and potassium [9,10], while little attention has been paid to other elements. We chose three elements, selenium, cadmium and molybdenum, as exogenous pollutants to administer to rats through intratracheal instillation. Both Se and Mo are essential elements, while Cd is a potentially toxic element that plays a significant role in human health, and their levels can represent the status of the different types of trace elements. Moreover, there are low levels of these three elements in the diet and water consumed by rats, which would not confound our study on the effects of exposure to exogenous elements on the levels of elements in different components of the peripheral blood.
This study aimed to explore the effects of exogenous element exposure via the respiratory tract on the Se, Cd and Mo concentrations in different components of peripheral blood (whole blood, plasma, erythrocytes and PBMCs) in rats which is the most-frequently used animal model in preclinical studies, as well as to determine the correlations of the three trace element concentrations among the components. The results will contribute to determining the blood components in which the element levels better reflect the effects of exogenous factors from those in which the element concentrations are stable and might reflect endogenous factors. This information will help researchers to select appropriate blood components for evaluating elements in future study.
Material and methods
Chemicals and instruments
Sodium selenite [Na2SeO3] (AR), ammonium molybdate [(NH4)6 Mo7O24·4H2O] (AR), cadmium chloride [CdCl2·2.5H2O] (AR), PBS buffer solution (NaCl 8.0 g/L, KCl 0.2 g/L, Na2HPO4 1.15 g/L, KH2PO4 0.2 g/L, pH 7.4, all the reagents used were AR), Percoll cellular segregation liquid (Pharmacia Co., Ltd., Art. No.: 17-0891-01), chloral hydrate (AR, Sinopharm Chemical Reagent Co., Ltd.), BV-level III ultraclean high purity nitric acid (UP, Suzhou Crystal Clear Chemical Co., Ltd.), BV-level III ultraclean high purity hydrogen peroxide, deionized water (conductivity 18 MΩ•cm, GN-RO-100purification system, Beijing Shuangfeng Science & Technology Development Co., Ltd.), human serum (lyophilization) standard substance (Germany Recipe Co., Ltd., Plasma Control, Level I), and pork liver national standard substances (GBW10051). All standard solutions were provided by the National Center of Analysis and Testing for Nonferrous Metals and Electronic Materials.
Agilent 7700x ICP-MS (American Agilent Co., Ltd.), Ultrawave Microwave Digestion system (Italian Milestone Co., Ltd.), BS110S electronic scales (Germany Idris Co., Ltd.), B60A Medical low speed centrifuge (Baiyang centrifuge factory), blood counting chamber (Beijing glass Co., Ltd.), and inverted microscope (China Chong Guang Co., Ltd.).
Animal experiment and grouping
All experimental procedures with animals were in strict accordance with the recommendations in the Guide for the Care and Use of Laboratory Animals and approved by the Committee on the Ethics of Animal Experiments of the Peking University Health Science Center (Permit Number: LA2012-61).
Forty-seven six-week-old, physically healthy, male Sprague-Dawley (SD) rats, weighing 180-200 g, were used in this study. The SD rats were obtained from the Department of Laboratory Animal Science, Peking University Health Science Center. Rats were housed in plastic cages with free access to low-lead diet and water ad libitum, and maintained in a specific pathogen free laboratory with controlled temperature, relative air humidity and 12-hour light and dark circles.
The SD rats were randomly divided into a control group and eight dose groups with different sample sizes shown in Table 1. After a week of adaptive feed, the rats were exposed to a mixed trace element solution according to 0.1 ml per 200 g weight through intratracheal instillation once per day for 10 days (10% chloral hydrate anesthesia). The control group was administrated physiological saline, while the other groups were administrated a target element solution with different doses shown in Table 1. Rats were weighed dailyand observed for behavioral changes, feeding and drinking habits. Twenty-four hours after the last administration, the rats were anesthetized with 10% chloral hydrate (0.3 mL/100 g body weight) and sacrificed with the method of femoral artery bloodletting. Approximately 2.5~3 ml of femoral arterial blood was collected into the lithium heparin anticoagulant tube and rapidly and softly blended to avoid blood coagulation and hemolysis.
Table 1.
The exposure doses administered to the rats in the nine groups
| Group | Se [mg/(kg•bw)] | Cd [mg/(kg•bw)] | Mo [mg/(kg•bw)] | Sample size |
|---|---|---|---|---|
| 0 (control) | 0 | 0 | 0 | 8 |
| 1 | 0.2 | 0.5 | 0.5 | 3 |
| 2 (low dose) | 0.4 | 1 | 1 | 8 |
| 3 | 0.8 | 2 | 2 | 3 |
| 4 (medium dose) | 1.2 | 4 | 3.5 | 8 |
| 5 | 1.8 | 8 | 5 | 3 |
| 6 | 2.4 | 12 | 9 | 3 |
| 7 (high dose) | 3.6 | 16 | 12 | 8 |
| 8 | 4.8 | 20 | 16 | 3 |
Percoll liquid preparation and blood separation
Percoll liquid and 8.5% NaCl were mixed with a ratio of 9:1 and then diluted to 66.2% Percoll (density of 1.083 g/mL) in 0.85% NaCl. Anticoagulant blood (1.5 mL) was mixed with isopyknic PBS buffer and slowly added to the centrifuge tube containing 3 ml of Percoll separation fluid. The tube was horizontally centrifuged with the force of 400 g (2000 round/minute) for 20 minutes. Diluted plasma, PBMCs and RBCs were collected.
Washing and counting of PBMCs
The trapped PBMCs were added into a double volume of PBS buffer, washed twice and then centrifuged with the force of 400 g for 15 and 10 minutes, respectively, to remove the free elements. After discarding the supernatant, PBS buffer was added to 2 mL. After adequate shocking and blending, we suspended the cells again. A 50 μL of cell suspension was collected, and we added 450 μL of PBS buffer. When fully blending the mixed solution again, one drop was used for the blood count under the microscope.
Sample pretreatment and determination
For whole blood, diluted plasma and RBC analysis, 0.5 mL, 0.9 mL and 0.2 g samples were added into a quartz digestive tube, respectively, and 0.8 mL of hydrogen peroxide and 1.2 mL of nitric acid were sequentially added. After microwave digestion and cooling, internal standard solutions were added up to 15 mL. For PBMCs, a 1.9 mL sample was added into the quartz digestive tube, respectively, and 0.4 mL of hydrogen peroxide and 1.0 mL of nitric acid were sequentially added. After microwave digestion and cooled, internal standard solutions were added up to 8 ml.
The concentrations of the three elements, Se, Cd and Mo, in four blood components were determined by Agilent 7700x inductively coupled plasma mass spectrometry (ICP-MS). To ensure that the target element determination had high sensitivity and a low detection limit, Se was determined in the He mode, and Cd and Mo in the No Gas mode. The related information on the operational parameters for ICP-MS was listed (Table S1). The standard curves are summarized in Table S2.
Quality control
SD rats were fed in a secondary environment under normal nutrition conditions. The experimental instrumentation passed the verification and calibration according to the national quality inspection department. National standard materials, pig liver and human serum, were used to evaluate the accuracy of the analysis method. The detection results are summarized in Table S3.
Statistical analysis
Statistical analyses were performed using SAS 9.1.3 (SAS Institute, Cary, NC, USA). The mean and standard deviation were used to describe the concentrations of the trace elements in different groups. The geometric mean was used to describe the increase folds of the trace elements in the dose groups compared to the control groups. The one-way ANOVA method was used to compare the differences among the groups. The correlation between trace elements and exposure doses was analyzed by Spearman’s rank correlation. Pair-wise comparison was performed using the SNK test. A two-sided P value of <0.05 was considered to be statistically significant.
Results
The element concentrations in the components of the peripheral blood
The concentrations of Se, Cd and Mo in different components of the peripheral blood were listed in Table 2. The concentrations of the three trace elements increased together with the increase of the administered doses (P<0.05), except for Cd and Mo in the PBMCs. There were no statistically significant differences in the Cd levels among the control, low-dose and medium-dose groups in the four components, all of which were lower than those in the high-dose group (all P<0.05). There were no significant differences in the Mo concentrations among the four groups (P=0.528) in PBMCs. The concentrations of trace elements for the nine groups in the four components were summarized in Figures 1, 2, 3 and 4. There was no linearity between the three trace elements and the exposure doses in the PBMCs (r, 0.249-0.508), while the opposite was true for the other peripheral blood components (r, 0.806-0.934). Interestingly, there was linearity when the Cd dose was more than 8 mg/(kg•bw) in the PBMCs (Figure 4B).
Table 2.
The concentration of the elements in the different peripheral blood components from rats in the different groups
| Element | Control group (n=8) | Low-dose group (n=8) | Medium-dose group (n=8) | High-dose group (n=8) | P |
|---|---|---|---|---|---|
| Whole blood (ng/mL) | |||||
| Se | 386.69±44.82b,c,d | 762.05±163.43a | 1631.57±255.25a,d | 5351.87±1752.80a,b,c | <0.001 |
| Cd | 1.48±1.82d | 2.93±1.88d | 14.55±4.55d | 99.69±45.19a,b,c | <0.001 |
| Mo | 30.76±7.14c,d | 138.33±90.39c,d | 1073.95±416.29a,b,d | 4509.64±1417.70a,b,c | <0.001 |
| Plasma (ng/mL) | |||||
| Se | 158.77±14.74c,d | 236.35±39.42c,d | 412.48±50.71a,b,d | 695.41±138.07a,b,c | <0.001 |
| Cd | 0.64±0.55d | 1.03±0.64d | 3.36±1.35d | 63.20±30.10a,b,c | <0.001 |
| Mo | 20.36±5.06d | 101.28±62.26d | 685.86±252.18d | 4230.80±1497.40a,b,c | <0.001 |
| RBCs (ng/g) | |||||
| Se | 440.16±81.40d | 834.78±171.76d | 2377.03±815.96d | 8539.23±3112.16a,b,c | <0.001 |
| Cd | 1.87±0.84d | 6.22±1.57d | 22.07±7.44d | 108.84±49.18a,b,c | <0.001 |
| Mo | 6.15±2.30c,d | 9.76±3.57c,d | 62.52±36.87a,b,d | 228.33±62.59a,b,c | <0.001 |
| PBMCs (ng/106 cells) | |||||
| Se | 1.67±0.45b,c,d | 3.44±1.25a | 4.44±2.78a | 4.83±1.58a | 0.005 |
| Cd | 0.11±0.05d | 0.08±0.04d | 0.16±0.10d | 0.21±0.10a,b | 0.014 |
| Mo | 0.65±0.37 | 0.65±0.31 | 0.82±0.53 | 0.93±0.53 | 0.528 |
Represents statistical significance (P<0.05) compared to the control group.
Represents statistical significance (P<0.05) compared to the low-dose group.
Represents statistical significance (P<0.05) compared to the medium-dose group.
Represents statistical significance (P<0.05) compared to the high-dose group.
Figure 1.
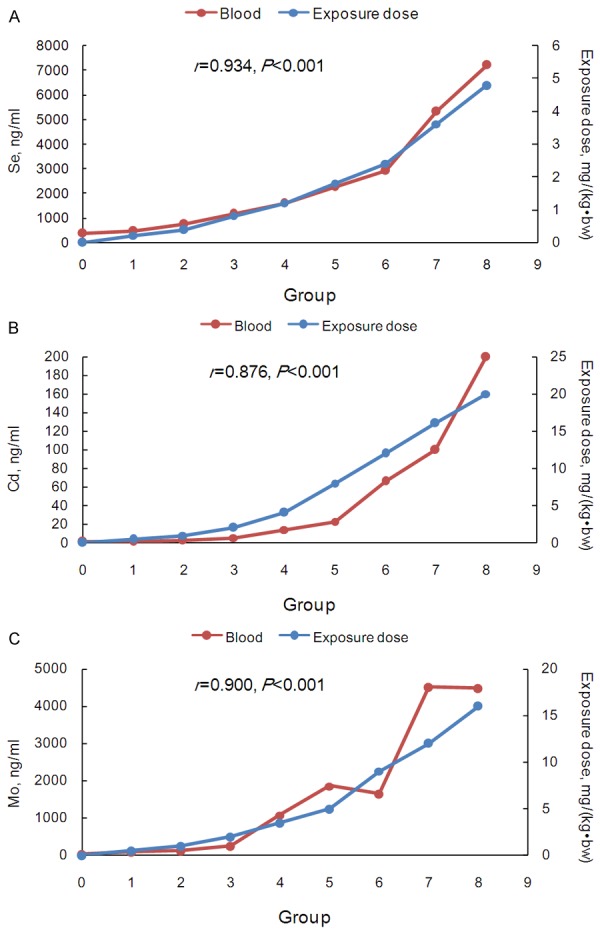
The trace element concentrations and exposure doses in the control and eight test groups in whole peripheral blood. A. Se; B. Cd; and C. Mo. The secondary vertical axis represented the exposure doses.
Figure 2.
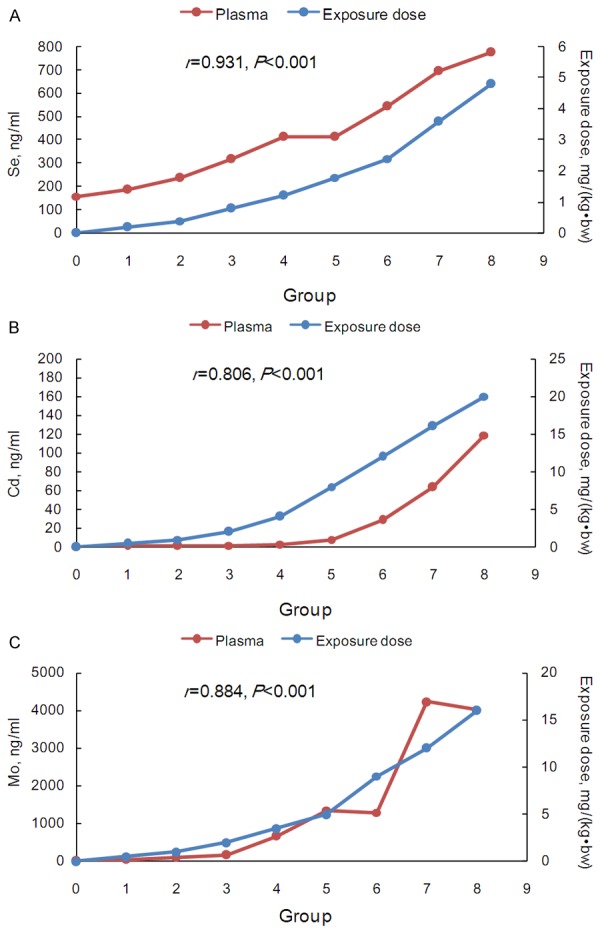
The trace element concentrations and exposure doses in the control and eight test groups in peripheral blood plasma. A. Se; B. Cd; and C. Mo. The secondary vertical axis represented the exposure doses.
Figure 3.
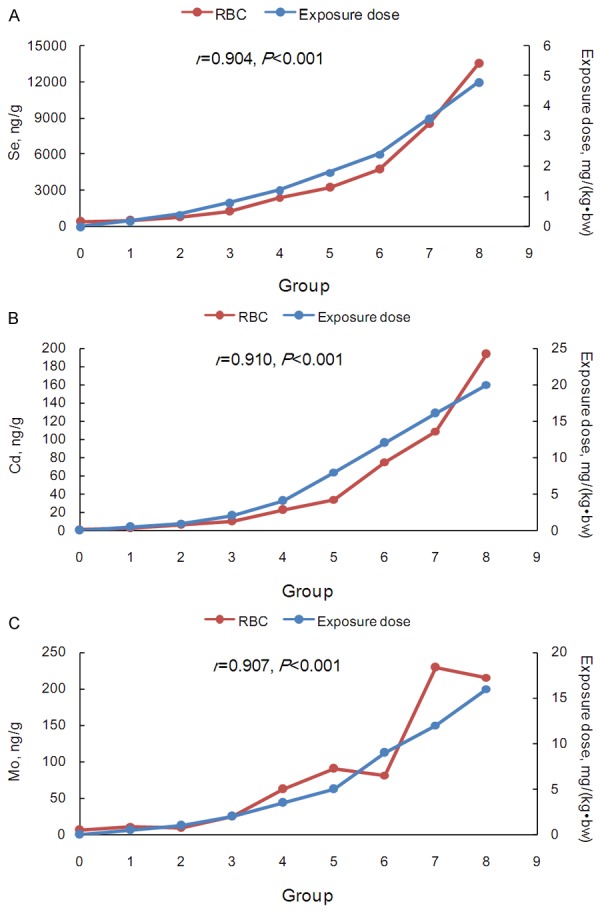
The trace element concentrations and exposure doses in the control and eight test groups in the peripheral blood RBCs. A. Se; B. Cd; C. Mo. The secondary vertical axis represented the exposure doses.
Figure 4.
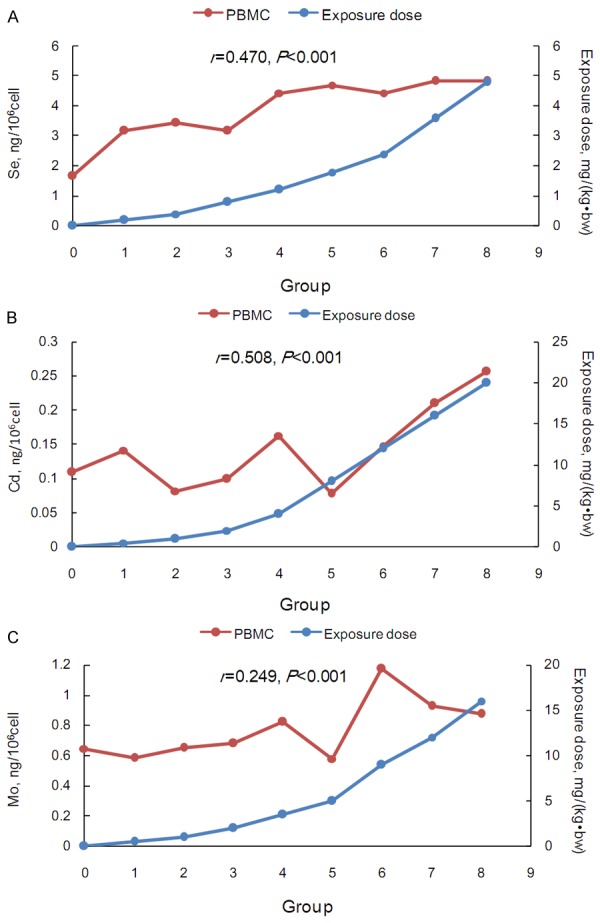
The trace element concentrations and exposure doses in the control and eight test groups in the peripheral blood PBMCs. A. Se; B. Cd; C. Mo. The secondary vertical axis represented the exposure doses.
Correlations among the peripheral blood components
The correlations of the three element concentrations among the four peripheral blood components were shown in Table 3. The correlation coefficients of the three element concentrations were higher among the whole blood, plasma and RBCs (Se (0.842-0.956), Cd (0.865-0.941) and Mo (0.925-0.962) than those between PBMCs and other components (Se (0.376-0.529), Cd (0.495-0.604) and Mo (0.160-0.257).
Table 3.
The correlations of the three element concentrations among the four peripheral blood components of rats
| Element | Plasma | RBCs | PBMCs |
|---|---|---|---|
| Se (n=47) | |||
| Whole blood | 0.888* | 0.956* | 0.430* |
| Plasma | - | 0.842* | 0.529* |
| RBCs | - | - | 0.376* |
| Cd (n=47) | |||
| Whole blood | 0.935* | 0.941* | 0.533* |
| Plasma | - | 0.865* | 0.604* |
| RBCs | - | - | 0.495* |
| Mo (n=47) | |||
| Whole blood | 0.962* | 0.931* | 0.229 |
| Plasma | - | 0.925* | 0.257 |
| RBC | - | - | 0.160 |
P<0.05.
The increase folds for the elements in the peripheral blood components
The increase folds for the three trace elements of the eight does groups compared to those of the control group were illustrated in Figure 5. The PBMCs curves deviated slightly with the geometric means of 2.21, 1.22 and 1.16 for Se, Cd and Mo, respectively (Table S4). For Se and Cd, the geometric means of the increase folds were highest in RBCs (4.95 and 10.56), whereas Mo increased more substantially in the plasma and the whole blood (geometric means, 20.77 and 18.42). Interestingly, the Se curve in the plasma (geometric mean, 2.29) was similar to that in PBMCs, while heavy deviations were observed for Cd and Mo (geometric means, 8.91 and 20.77) in the plasma.
Figure 5.
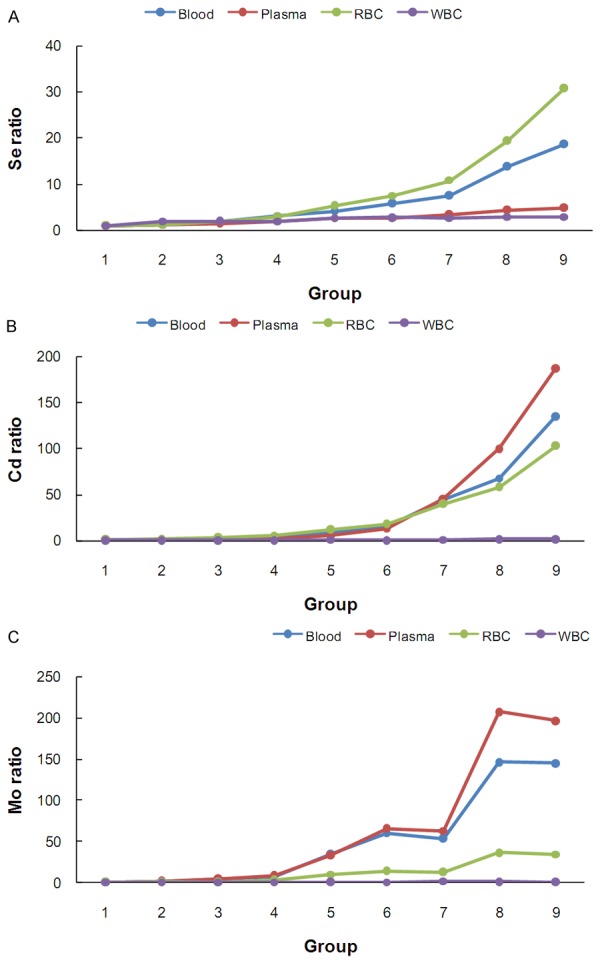
The increase fold in the trace element concentrations in the dose groups compared to the control groups in the four peripheral blood components.
Discussion
The manifestations of trace elements differ among the blood components in the presence of exogenous factors. In this study, Se, Cd and Mo changed significantly in the RBCs, plasma and whole blood, while they remained relatively stable in the PBMCs. The concentrations in the PBMCs may be less affected by exogenous factors, which could be a window to reflect the trace element levels in the body affected by endogenous factors.
None of these three trace elements had good correlations with the given doses in the PBMC component, and Mo had the lowest correlation coefficient. The concentration of Mo in the body, especially for Mo deficiency, may be related to various diseases, such as molybdenum cofactor deficiency [11], cancer [12], cardiovascular disease [13] and more. Relying on measurements the Mo level in the PBMCs may eliminate the bias caused by the exogenous factors and demonstrate the real changes in the element contents in response to endogenous factors. Previous studies have demonstrated that lymphocytes are more similar to organ cells than erythrocytes and multinucleate leukocytes. Rivera reported that, because the biological characteristics and ions changes of lymphocytes were very close to the myocardial cells and vascular smooth muscle cells, calcium regulation in lymphocytes might indirectly reflect the calcium regulation in myocardial cells and vascular smooth muscle cells [7]. Zhang reported that the Mn concentration in the PBMCs of patients with acute lymphoblastic leukemia was higher than for acute non-lymphoblastic leukemia, indicating that the increase of Mn was mainly affected by endogenous factors [14]. Additionally, when the administered dose of Cd was more than 8 mg/(kg•bw) in the PBMCs, the Cd concentration was linearly correlated with the given doses. Because such a high dose of Cd was rare, the Cd concentration was stable overall as well as Mo and Se.
Unlike for PBMCs, the concentrations in the RBCs, plasma and whole blood were obviously affected by exogenous factors. A previous study reported that the blood selenium concentrations tended to vary substantially and were influenced by both exogenous factors, such as diet, supplements, or smoking status, and endogenous factors, such as selenium storage, transport and excretion [15]. The correlation analysis revealed that there were high correlations (more than 84%) between any two of the three components, which is helpful for estimating the concentration in one component of blood according to another component. According to Figure 5, RBCs had more subtle changes in the element concentrations compared to plasma, except in the case of Se. RBCs have an average life expectancy of 114 days, and the nutritional status of trace elements can be observed over a long period of time [16]. Some heavy metals (such as Pb, Cd, and Cu) in the blood are mainly enriched in red blood cells. Zhang reported that 99% of Pb was distributed in the RBCs and only 1% was in the plasma when entering in the blood circulation. Therefore, studying the element levels in RBCs is more helpful for evaluating chronic diseases and metal poisoning [3]. Stefanowicz suggested that the erythrocyte Se level could be used to reliably assess a wide range of Se intake levels [17]. In addition, the selenium concentrations in the RBCs reflect the longer-term nutritional status due to the incorporation of selenium in erythrocyte synthesis [18]. Therefore, RBCs could be used to evaluate the status of certain elements when affected by exogenous factors.
Se and Cd mainly accumulate in RBCs, while Mo only slightly increases in RBCs compared to the control group, which is also true for the concentration of Se in the plasma. We could choose different blood components, according to the characteristics of the target elements, to test the effects of exogenous factors. Additionally, whole blood is considered to be a good biomarker for some trace elements, and it reflects recent, moderate exposure [16,19]. Considering the correlation and significance of change from exogenous element exposure, whole blood may be the best choice for evaluating the effects of exogenous factors.
In conclusion, the respiratory pathway is a passageway through which exogenous factors can affect internal environment. Administering trace elements through the respiratory pathway can simulate exposure to exogenous factors, such as atmospheric pollutants. Generally, PBMCs might provide information about endogenous factors, and whole blood could more accurately reflect the effects of exogenous factors compared to other blood components.
Acknowledgements
We thank the Laboratory of Elementomics, School of Public Health, Peking University for technical support.
Disclosure of conflict of interest
None.
Supporting Information
References
- 1.Mertz W. Review of the scientific basis for establishing the essentiality of trace elements. Biol Trace Elem Res. 1998;66:185–191. doi: 10.1007/BF02783137. [DOI] [PubMed] [Google Scholar]
- 2.Anzellotti AI, Farrell NP. Zinc metalloproteins as medicinal targets. Chem Soc Rev. 2008;37:1629–1651. doi: 10.1039/b617121b. [DOI] [PubMed] [Google Scholar]
- 3.Carpentieri U, Myers J, Thorpe L, Daeschner CW 3rd, Haggard ME. Copper, zinc, and iron in normal and leukemic lymphocytes from children. Cancer Res. 1986;46:981–984. [PubMed] [Google Scholar]
- 4.Specker BL, Lichtenstein P, Mimouni F, Gormley C, Tsang RC. Calcium-regulating hormones and minerals from birth to 18 months of age: a cross-sectional study. II. Effects of sex, race, age, season, and diet on serum minerals, parathyroid hormone, and calcitonin. Pediatrics. 1986;77:891–896. [PubMed] [Google Scholar]
- 5.LL Y, OY L, Q X, QF L, HD C, Q W, JY W. Study on difference and relation of heavy metals in adult dietary and blood in four cities. Experimental Technology and Management. 2011;28:29–33. [Google Scholar]
- 6.Whitehouse RC, Prasad AS, Rabbani PI, Cossack ZT. Zinc in plasma, neutrophils, lymphocytes, and erythrocytes as determined by flameless atomic absorption spectrophotometry. Clin Chem. 1982;28:475–480. [PubMed] [Google Scholar]
- 7.Rivera A, Conlin PR, Williams GH, Canessa ML. Elevated lymphocyte cytosolic calcium in a subgroup of essential hypertensive subjects. Hypertension. 1996;28:213–218. doi: 10.1161/01.hyp.28.2.213. [DOI] [PubMed] [Google Scholar]
- 8.Ambrosioni E, Costa FV, Montebugnoli L, Borghi C, Vasconi L, Tartagni F, Magnani B. Intralymphocytic sodium concentration: a sensitive index to identify young subjects at risk of hypertension. Clin Exp Hypertens. 1981;3:675–691. doi: 10.3109/10641968109033693. [DOI] [PubMed] [Google Scholar]
- 9.Carpentieri U, Myers J, Thorpe L, Daeschner CW 3rd, Haggard ME. Copper, zinc, and iron in normal and leukemic lymphocytes from children. Cancer Res. 1986;46:981–984. [PubMed] [Google Scholar]
- 10.MD W, XR G, JB L. Association between Intralymphocytic Magnesium Content and Myocardial, Vascular Remodeling in Essential Hypertension. Medical Journal of Zhongshan University. 2006;27:427–430. [Google Scholar]
- 11.Reiss J, Hahnewald R. Molybdenum cofactor deficiency: Mutations in GPHN, MOCS1, and MOCS2. Hum Mutat. 2011;32:10–18. doi: 10.1002/humu.21390. [DOI] [PubMed] [Google Scholar]
- 12.Nouri M, Chalian H, Bahman A, Mollahajian H, Ahmadi-Faghih M, Fakheri H, Soroush A. Nail molybdenum and zinc contents in populations with low and moderate incidence of esophageal cancer. Arch Iran Med. 2008;11:392–396. [PubMed] [Google Scholar]
- 13.Teksam O, Yurdakok M, Coskun T. Molybdenum cofactor deficiency presenting with severe metabolic acidosis and intracranial hemorrhage. J Child Neurol. 2005;20:155–157. doi: 10.1177/08830738050200021501. [DOI] [PubMed] [Google Scholar]
- 14.HX Z, SY W. Determination of some elements in leucocytes. World Elemental Medicine. 2005;12:84–85. [Google Scholar]
- 15.XW X, LJ L. Discussion about significance of examing Zn, Fe and Cu in RBC of patients with liver diseases. Journal of Dalian Medical University. 2005;27:57–58. [Google Scholar]
- 16.Benes B, Spevackova V, Smid J, Cejchanova M, Cerna M, Subrt P, Marecek J. The concentration levels of Cd, Pb, Hg, Cu, Zn and Se in blood of the population in the Czech Republic. Cent Eur J Public Health. 2000;8:117–119. [PubMed] [Google Scholar]
- 17.Stefanowicz FA, Talwar D, O’Reilly DS, Dickinson N, Atkinson J, Hursthouse AS, Rankin J, Duncan A. Erythrocyte selenium concentration as a marker of selenium status. Clin Nutr. 2013;32:837–842. doi: 10.1016/j.clnu.2013.01.005. [DOI] [PubMed] [Google Scholar]
- 18.Navarro-Alarcon M, Cabrera-Vique C. Selenium in food and the human body: a review. Sci Total Environ. 2008;400:115–141. doi: 10.1016/j.scitotenv.2008.06.024. [DOI] [PubMed] [Google Scholar]
- 19.Massadeh A, Gharibeh A, Omari K, Al-Momani I, Alomary A, Tumah H, Hayajneh W. Simultaneous determination of Cd, Pb, Cu, Zn, and Se in human blood of jordanian smokers by ICP-OES. Biol Trace Elem Res. 2010;133:1–11. doi: 10.1007/s12011-009-8405-y. [DOI] [PubMed] [Google Scholar]
Associated Data
This section collects any data citations, data availability statements, or supplementary materials included in this article.


