

Abstract
Objective: Analysis of the metabolic differences among the papillary thyroid carcinoma (group T) patients, benign thyroid tumor patients (group B) and healthy controls (group H) by nuclear magnetic resonance hydrogen spectrum. Methods: collect twenty serum specimens each from group T, group B and group H. Collect image archive. Use Topspin software, AMIX software and SIMCA-P+ software to calibrate, integrate with PCA and PLS-DA, research the three groups’ serum for endogenous metabolic differences. Results: The data of group T and group H established a discrimination model, and the model is correct (P<0.05). The content of metabolites in the serum of team T increased including valine, leucine, isoleucine, lactic acid, alanine, glutamic acid, lysine, glycine, while the lipids, choline, tyrosine decreased. The data of group B and group H established a discrimination model and the model is correct (P<0.05). The content of metabolites in the serum of team B increased including Trimethyl glycine, tyrosine, phenylalanine, valine, leucine, isoleucine, lactic acid, alanine, glutamic acid, while the Lipids and lysine reduced. Conclusion: Compared with team H, there is an obvious metabolic difference in team T and team B. It not only involves glucose metabolism but also the metabolism of lipids, amino acids and nucleic acid.
Keywords: Thyroid neoplasms, metabonomics, principal component analysis
Introduction
Thyroid carcinoma accounts for 2 percent of total malignant tumors, is the most common malignant tumor of the endocrine-system [1] and ranks 5th among female cancers [2]. Correlated documents show that there is an upward trend in the incidence of thyroid cancer in recent years. Between 1950 and 2004, Thyroid cancer incidence increased by 310% [3]. Among them there were 65% to 75% with well-differentiated papillary thyroid carcinoma, withl a ten-year survival rate of above 90% [4]. But from the clinical experience, we know that the diversion rate of cervical lymph node in early papillary thyroid carcinoma can reach 50%-70% [5-7], and thus can influence prognosis of patients and increase the risk of tumor recurrence after surgery, so the early diagnosis and treatment of thyroid carcinoma are very important. At present, the traditional diagonsis methods of thyroid cancer include medical imaging diagnosis, cytological examination and blood biochemistry, but these diagnosis means lack high sensitivity and perfect accuracy. For the past few years, thyroid fine needle aspiration has become the best method for distinguishing malignant and benign nodules preoperatively [8-10], this is a diagnosis method with excellent security, high accuracy and reasonable cost. But, this diagnostic method has a high false negative rate and it cannot accurately distinguish papillary thyroid carcinoma from follicular thyroid carcinoma [11]. In conclusion, we are in dire need of a test with high sensitivity and perfect accuracy which can be used in preoperative diagnosis of thyroid carcinoma.
The notion of “metabolomics” was first put forward by the British Nicholson study group in 1999. This is a science aimed at discussing the gene regulatory mechanism by measuring the systemic metabolic profile of the whole organism and detecting metabolic changes at different times and from different positions [12].
To summarize, the metabolic abnormalities of a tumor-burdened body are largely thanks to the existence of the tumor, and the unusual metabolism of the tumor results in abnormal metabolic substances appearing within the organism. Hence, this topic takes the NMR spectroscopy technique as the platform to analyze the metabolic differences among the papillary thyroid carcinoma patients (group T), benign thyroid tumor patients (group B) and healthy controls (group H), so that it can build a Metabolomics method which can perform differential diagnoses among the three kind of patients.
Materials and methods
Main reagents, equipment and software
Adamas Company in Switzerland: KH2PO4, waterless Na2HPO4. Beijing SBS gene technology Ltd: NMR spectrometer (AVANCE III 500 Hz). Bruker Company in Switzerland: The type 725 ultra-cryogenic refrigerator, SIMCA-P (11.0) software. Thermo Forma Company in America: high speed refrigerated centrifuge (5810R). Eppendorf Company in Germany: Topspin (2.1) software, AMIX software (V3.9.11). Umetrics Company in Sweden.
Group of experiments
There are the healthy controls group and the tumor group (the papillary thyroid carcinoma and benign thyroid tumor patients).
Included samples and eliminated samples in the tumor group: 1) inclusive criteria: ① patients who have been confirmed to be papillary thyroid carcinoma patients or benign thyroid tumor patients through pathology; ② the tumor diameter of papillary thyroid carcinoma patients is less than 2 cm, the tumor diameter of benign thyroid tumor patients is less than 4 cm; ③ patients are between age 18 and 65. 2) elimination criteria: ① patients who have accepted anti-tumor therapy four weeks prior to the progressive group; ② chronic lymphocytic thyroiditis accompanied by thyroid cancer or abnormal thyroid function; ③ distant metastasis of papillary thyroid carcinoma patients with a tumor diameter more than 2 cm, a tumor diameter of benign thyroid tumor patients more than 4 cm; ④ has hypertension, diabetes mellitus or other metabolic diseases, or has other nervous system diseases which affect metabolism; ⑤ patient whose liver and kidney function was abnormal; ⑥ patient who has other malignant tumors at the same time; ⑦ patient who has a long-term use of a drug which affects metabolism; ⑧ vegetarian; ⑨ pregnant women or breast-feeding women.
Inclusive criteria and eliminated criteria of the healthy controls: 1) inclusive criteria: ① without a tumor and to be healthy; ② patients are between age 18 and 65. 2) elimination criteria: ① pregnant women or breast-feeding women; ② patient who has nervous system diseases which affect metabolism; ③ has hypertension, diabetes mellitus or other metabolic diseases, or has other nervous system diseases which affect metabolism; ④ patient whose liver and kidney function was abnormal; ⑤ patient who has a long-term use of a drug which affects metabolism; ⑥ vegetarian.
General information of patients
We have collected the preoperative serum specimen of preoperative thyroid tumors from May 2012 to January 2013 in Union Hospital affiliated to Fujian Medical University, according to the following inclusive criteria of the tumor group, collecting the serum specimen of preoperative thyroid tumors including twenty cases of papillary thyroid carcinoma (group T) and twenty cases of benign thyroid lesions (group B). At the same time, we collected the serum specimens of 20 case volunteers from the medical examination center according to the inclusive criteria of the control group (group H). This study was conducted in accordance with the declaration of Helsinki.
This study was conducted with approval from the Ethics Committee of the Affiliated Union Hospital of Fujian Medical University.
There is no statistical significance of age-and sex-related differences between group T, group B and group H. And there is also no statistical significance of nodule numbers between group T and group B (P>0.05). See the Table 1.
Table 1.
General information of patients
| Groups | Age | Gender (male/female) | Nodule number |
|---|---|---|---|
| T | 45.3±9.7 | 4/16 | 1.4±0.3 |
| B | 44.7±12.2 | 5/15 | 1.6±0.7 |
| H | 44.5±10.9 | 4/16 | - |
| P value | >0.05 | >0.05 | >0.05 |
Methods
Collection of blood and specimen handling of serum
Collect blood samples, check centrifugal (alert parameters: rotation rate: 8000; time: ten minute; T: 4°C) plasma 1.5 ml, partial shipments of 0.5 ml/group. All the serum specimens were stored at eighty degrees below zero.
Liquid allocation of nuclear magnetic detection
Get advance 400 μl serum + 100 μl PBS + 100 μl heavy water, then mix them; run serum through high-speed refrigerated centrifuge (parameter settings: rotation rate: 12000; time: ten minute; T: 4°C); collect 500 μl supernatant and use it to test pipe.
Detection of dioscorea nipponica rhizoma
Collect NMR spectra by using nuclear magnetic resonance spectrometer, conduct the experiment by using D2O lock, three 5 mm HCN resonance probes with temperature (300 K) and spectral width (5 kHz), then gather data sampling by using the impulse sequence named NOEPR-CPMG (NOEPR, Nuclear overhauser effect spectroscopy with PResaturation; CPMG, Carr-Pure-Meiboom-Gill sequence), and among them pre-saturated modules are used to restrain the water peak signal (2 s), auto-convoluted wave modules are used to restrain broad peak caused by protein and lipoprotein. Number of times of accumulating signals should be 128. Obtain the spectra of the samples by using D2O as internal standard.
Data conversion and statistical analysis of the NMR spectrum
After phase and baseline correction of all one dimensional 1H NMR spectrum in the Topspin software (2.1, Germany), use lactic acid in the bimodal scaling at high field (1.33 ppm). Make adaptive binning on the scaled spectrum in the region of 0.50-9.0 ppm by AMIX Software (V3.9.11, Germany). Integration interval width is 0.005 ppm. In order to eliminate the effect of residual water peaks, for each peak period remove 4.315-6.65 ppm including residual water peak and containing urea peak signal. After that, the NMR spectrum is treated by thetotal area normalization method. Input the normalized data into the SIMCA-P + package (11.0, Umetrics, Sweden) carrying out by multivariate analysis. PCA, PLS-DA and OPLS-DA are taken first and then the second principal component.PCA results are expressed by a Scores diagram, mainly observing the overall situation of the sample as well as the existence of outliers. PLS-DA uses the UV method to carry on the standardization processing, the result uses the Scores chart to display and the reliability of the model was verified by cross validation and permutation tests. For the model (<0.05 P) after passing the verification, the OPLS-DA analysis is conducted further, and the results are expressed by Scores diagram. The correlation coefficient loading plot is used to express the contribution of the material and its contribution (r). This picture uses color to express the correlation coefficient, the warmer the color is, the more contribution there is. Through Pearson’s product-moment correlation coefficient, determine the metabolites with significant changes and carry out a biological explanation for these substances.
Result
Serum samples NMR spectrum from tumor group and healthy group, As shown in Figure 1.
Figure 1.
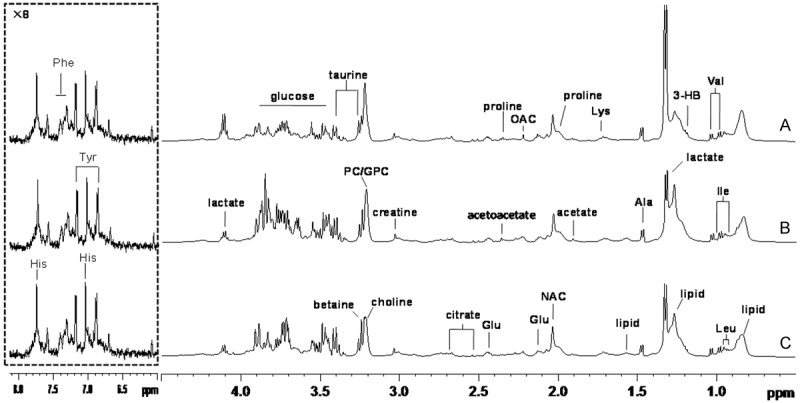
Is Serum 1-dimensional hydrogen spectrum (δ 0.5-4.5 and δ 6.0-8.0 500 MHz); A is group T, B is group T, C is group H.
Analysis results of data from the serum samples NMR spectrum
Principal component analysis of the data. In order to analyze the relationship among the samples, a PCA analysis of the corrected data will be made. PCA is a statistical analysis method that disperses n-variable metabolic fingerprint information concentrated into a small comprehensive index (principal components). Principal component analysis results are represented by Scores diagrams, mainly to observe the overall situation of the sample as well as the existence of outliers. Using SIMCA-P+ software to analyze the data of the normalized pattern recognition, PCA uses unit variance scaling UV to scale the conversion method. As shown in Figure 2.
Figure 2.
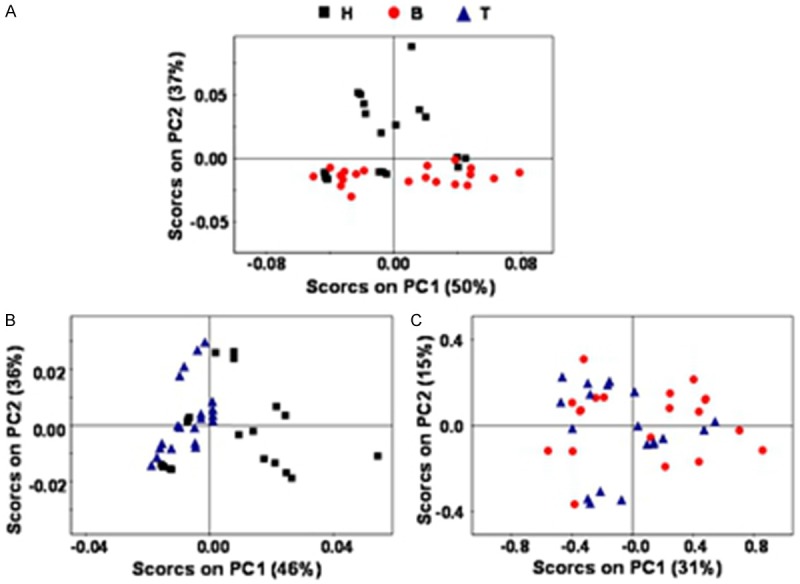
Three sets of data PCA score plot, A is group B and H, B is group T and H, C is group B and H.
There was a significant difference in PCA score between groups B and H. Group H is mainly focused on the 1, 2 quadrant, while the serum of group B is mainly focused on the 3, 4 quadrant, group B presents a good reunion. There was a significant difference in PCA score between groups T and H. Group T is mainly focused on the 2, 3 quadrant, while group H is mainly focused on the 1, 4 quadrant. Group T presents a good reunion. There was no significant difference in PCA score between groups B and T. The two sets of data were distributed randomly. It means the differences between the two groups cannot be distinguished by PCA. Further analysis is needed.
Data of PLS-DA analysis
Use SIMCA-P+ software (V11.0) to do the partial least squares (PLS) method to the data that is normalized to find correlation between the NMR data (X) and other variables (Y). PLS-PLA-DA uses the adaptive conversion method for data scaling. PLS-DA uses cross validation to verify the quality of the model. R2X and Q2 (Representing the variables and predictability of the model respectively) obtained by cross validation is used to evaluate the validity of the model. After that, Q2 will be obtained through changing the categorical variablesy by arranging random experiments many times, which does further testing on the effectiveness of the model.
The model of solvable explanation index R2X and prediction index Q2, combined with the results of permutation tests to verify that, the model of B group and T group, T group and H group were set up to explain the significant differences between the two groups. The model established by B and T groups is still not established, indicating that the metabolism difference between the two groups cannot be distinguished by PLS-DA, maybe due to a lack of significant differences between the metabolism groups, or because of the small sample size. Further analysis is needed. As shown in Figure 3.
Figure 3.
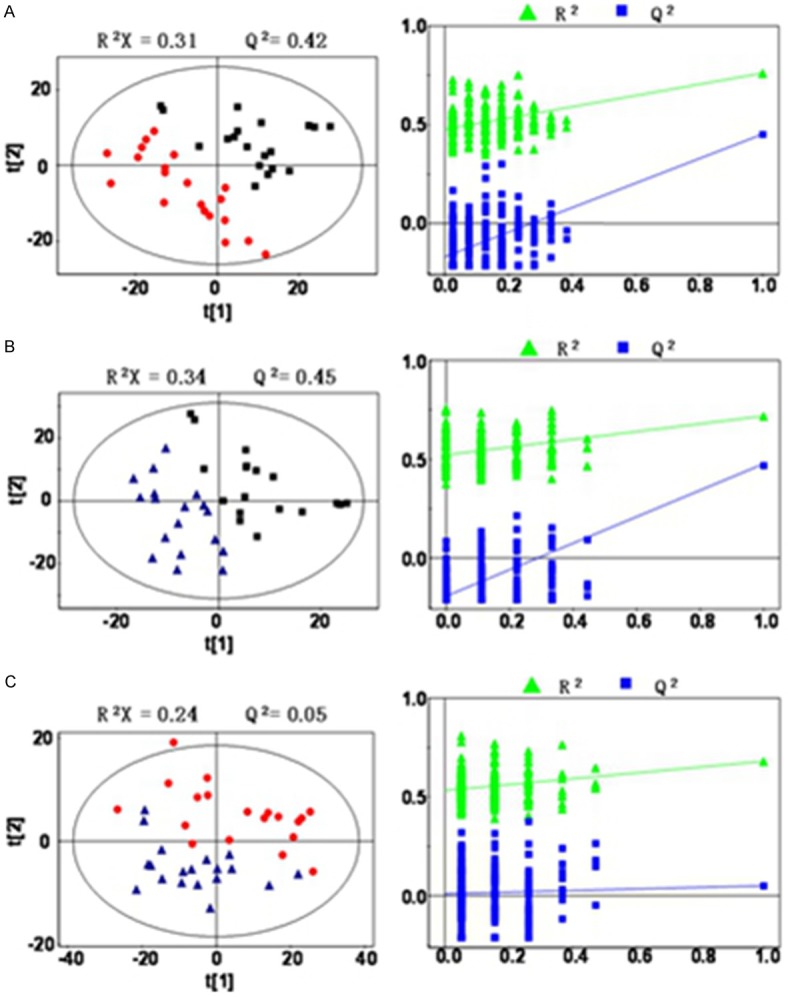
PLS-DA score plot (left), Permutation test (right). A: PLS-DA score plots and Permutation test of group B and H; B: Group T and H; C: PLS-DA score plots and Permutation test of group B and T.
Data OPLS-DA analysis
Through the verified model (P<0.05), perform OPLS-DA analysis as a further step by SIMCA-P+ software. The results are shown by Scores diagram, and Loading Plot is used to show the contribution of the material and its contribution size (r value); the cold and warm color of the map implies the correlation coefficient. The contribution is greater due to the warmer color, as shown in Figure 4.
Figure 4.
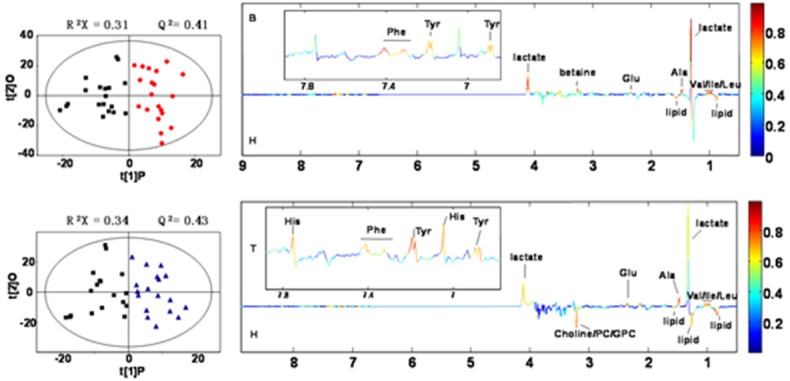
OPLS-DA score picture (left), loading picture of correlation coefficient (right).
Through the analysis of OPLS-DA, by analyzing the corresponding correlation coefficient of each metabolite, make further induction of metabolites with statistical significance. Then compare with the corresponding critical values of the correlation coefficient, to obtain the metabolite among the differences between the groups, as shown in Table 2. Correlation coefficients, positive and negative signs indicate positive and negative correlation in the concentrations, respectively. The correlation coefficient of │r│>0.456 was used as the cutoff value for the statistical significance based on the discrimination significance at the level of p=0.05 and df (degree of freedom) =17.
Table 2.
Metabolites among the differences between the groups
| Metabolites | ra | |
|---|---|---|
|
| ||
| T vs. H | B vs. H | |
| Val | 0.72↑ | 0.79↑ |
| Leu | 0.76↑ | 0.69↑ |
| Ile | 0.83↑ | 0.81↑ |
| Lactate | 0.70↑ | 0.60↑ |
| Ala | 0.84↑ | 0.76↑ |
| Lipid | -0.84↓ | -0.64↓ |
| Glu | 0.73↑ | 0.76↑ |
| Betaine | - | 0.87↑ |
| Choline | -0.70↓ | - |
| Tyr | -0.85↓ | 0.74↑ |
| Phe | - | 0.86↑ |
| Gly | 0.83↑ | - |
| Lys | 0.78↑ | -0.60↓ |
Correlation coefficients, positive and negative signs indicate positive and negative correlation in the concentrations, respectively. The correlation coefficient of │r│>0.456 was used as the cutoff value for the statistical significance based on the discrimination significance at the level of p=0.05 and df (degree of freedom) =17.
As shown in the Table 2: compare group T and group H, the content of valine, leucine, isoleucine, lactate, alanine, glutamic acid, lysine arginine, glycine are increased; the content of lipids, choline and tyrosine are decreased.
Compare group B with group T, valine, leucine, isoleucine, leucine, lactic acid, alanine, glutamic acid, trimethyl glycine, tyrosine and phenylalanine are increased, lipid and amino acid are decreased. Compared with the B group, the differences in the metabolism of group T were more obvious.
Discussion
The occurrence and development of malignant tumors has multi-factors, multi-genes and multi-stages with complex and gradual processes. The exact pathogenesis has still not become clear. The environment, nutrition, physiological state and pathological state of the organism are the result of the interaction between the substance and the key enzyme inside the body. From the molecular mechanism, these effects are generated in the gene, transcription, protein or metabolic levels of the body. Because of the existence of genes and proteins, the material guarantee for the occurrence of biological events can be provided, and the changes of metabolites reflects the result of the biological processes that have occurred. Therefore, the function within the body can be reflected and detected at the level of metabolites. While the changes of metabolites within living organisms contain abundant information, such as gene expression and protein function changes, by detecting the changes of endogenous metabolites, we can effectively carry out the overall understanding of the pathophysiology of the organism. By studying the biological molecules, the upstream event can be traced to combine the information of each level for integration. As an important branch of the biological system, metabolic genomics is a global analysis of the metabolic end products and/or metabolites within the body, focusing on analysis and detection of the end result of a series of biological abnormal reaction events. Therefore, the technology of the metabolic group has become a new diagnostic method for malignant tumors. Meanwhile, it can be effective to provide understanding and analysis of the overall pathophysiology of the organism.
The research shows that the most basic biological characteristics of malignant tumors is the differentiation and proliferation of malignant tumor cells, with the capability for invasion and metastasis. The main manifestations of the relative metabolism of substances are: substance synthesis metabolism is increased greatly, material decomposition metabolism is decreased obviously, and abnormal glucose metabolism, invasion and metastasis of related protein are metabolically abnormal.
The rapid proliferation of malignant tumor cells requires a large amount of lipids as precursors, to synthesis the phospholipids, which constitute a phospholipid bilayer of the cell membrane. Therefore, in the body of patients with malignant tumors, lipid material synthesis is increased, but the synthesis process is affected by the key enzymes, and the synthesis rate is much lower than the adoption speed, so the total effect is still lower. In this experiment, the serum lipids in patients with papillary thyroid carcinoma were decreased, which shows that the synthesis of membrane and membrane structures in patients with papillary thyroid carcinoma were enhanced.
The occurrence of malignant tumors is a cascade of multiple genes. Activation of proto oncogene and inactivation of tumor suppressor genes are important mechanisms. Methylation plays an important role in the regulation of eukaryotic gene expression. Currently, a series of tumor related genes were related to DNA methylation to different degrees [13,14]. The important biological function of DNA methylation is to control the gene expression, maintain the integrity of chromosomes and adjust some of the DNA recombination. Many studies have found that promoter methylation can inhibit gene expression at transcriptional level, and it is one of the most important reasons for tumors to inhibit gene promoter region methylation to gene inactivation [15]. In the study of thyroid cancer, methylation was found in TIMP3, MLH1, CDH1, RASSFIA and ESR [16-21], related to gene transcription and inactivation. Methylation may influence the development of thyroid cancer by the transcriptional regulation of many genes. Glycine is the most simple amino acid sequence of amino acids in the human body, as the main supplier of the methyl group. In this experiment, glycine content in papillary thyroid carcinoma was increased, which is related to high methylation of the promoter region. In addition, the rapid proliferation of malignant tumor cells requires the synthesis of a large number of nucleotides and proteins, leading to the increase of glycine as the synthesis of purine nucleotides. Chen JL [22] found that glycine content is increased in the body of stomach cancer patients with lymph node metastasis. Therefore, the elevation of glycine having any relationship with lymph node metastasis of papillary thyroid carcinoma in early stage needs further study. Furthermore, as the carnitine of the carrier of the internal and external material exchange of the mitochondrial membrane was synthesized to raw lysine, and participated in the folded leucine of protein space, so that papillary thyroid carcinoma was increased.
A large number of malignant tumor cells need a large and rapid supply of oxygen, but even when the supply of oxygen is sufficient, the cancer cells still rely on obtaining a large number to consume the glucose, for anaerobic fermentation, and convert it to lactic acid so that it can obtain the energy rapidly under the function of lactate dehydrogenase, known as the Warburg effect [23]. The enhancement of anaerobic fermentation of malignant tumor cells and the formation of lactic acid, leads to the accumulation of lactic acid, and local tumor acidosis. The acidic environment is not conducive to the growth and proliferation of malignant tumor cells, however, after the selection of the acid environment, the surviving malignant tumor cells have obvious advantages of proliferation. In addition, acid poisoning leads to an increase of extracellular matrix decomposition, to promote angiogenesis and the metastasis of malignant tumor cells [24]. There is a positive correlation between the concentration of lactic acid in malignant tumor tissues and lymph node or distant metastasis in patients with head and neck cancer. The low lactate concentrations in the malignant tumor tissues have a longer survival time, with good prognosis; high levels of lactic acid were easily transferred to a bad prognosis. This is related to radiation resistance caused by hypoxia [25]. The research results show that, the content of lactic acid was increased for the person with papillary thyroid carcinoma compared to a healthy person. Compared with the healthy person, the increasing is obviously, indicating that anaerobic fermentation in papillary thyroid carcinoma is increased. Meanwhile, oxygen respiration in tumor tissues is inhibited. Such conclusions are verified by Yan H [26] by the experiment. Therefore, related enzymes and metabolic abnormalities of raw material products to aerobic respiration, including the reduction of the succinate dehydrogenase, and the increasing content of pyruvate. Due to increasing internal energy consumption, a lot of pyruvate is consumed and transformed into lactic acid to release energy. The large consumption of pyruvate led to an increasing function of sugar fermentation, and to lower blood glucose. Other glucose are transformed into the allosteric glycolysis pathway, so that glycolysis raw materials are increased, and because the body lactic acid dehydrogenase activity is limited, resulting in the accumulation of pyruvate. The accumulation of a large amount of pyruvate promotes the reaction shift between pyruvate and alanine synthesis, resulting in elevated alanine in the malignant tumor in the body.
In conclusion, using nuclear magnetic resonance technique and PCA/PLS-DA method, we performed comparison analysis on the differences among serum in patients with papillary thyroid carcinoma, the benign thyroid tumor group and the healthy control group. We found that lactic acid was significantly higher in the patients with papillary thyroid carcinoma, and lipid was significantly decreased. In addition, we found that the alanine, lysine, glycine, leucine are also increased, with lactic acid and alanine as the main components of PC1 and PC2 in analysis. While on the PCA icon, the papillary thyroid carcinoma group shows a clear trend of aggregation. Whether or not elevated lactate and alanine can be used as a tumor marker for papillary thyroid carcinoma needs to be further studied. Papillary thyroid carcinoma is involved in metabolic abnormalities and many other functions, including sugar metabolism, lipid metabolism, nucleotide metabolism and methyl metabolism, mainly conducting anaerobic fermentation with malignant tumor cells, which is related to rapid proliferation and invasion.
Acknowledgements
Fujian Provincial Health System middle-aged backbone personnel training project (2013-ZQN-ZD-13). Key specialist project of the national clinical department. Fujian Province key medical discipline.
Disclosure of conflict of interest
None.
References
- 1.Sipos JA, Mazzaferri EL. Thyroid Cancer Epidemiology and Prognostic Variables. Clin Oncol (R Coll Radiol) 2010;22:395–404. doi: 10.1016/j.clon.2010.05.004. [DOI] [PubMed] [Google Scholar]
- 2.Siegel R, Naishadham D, Jemal A. Cancer statistics, 2013. CA Cancer J Clin. 2013;63:11–33. doi: 10.3322/caac.21166. [DOI] [PubMed] [Google Scholar]
- 3.Siegel R, Ma J, Zou Z, Jemal A. Cancer Statistics, 2014. CA Cancer J Clin. 2014;64:9–29. doi: 10.3322/caac.21208. [DOI] [PubMed] [Google Scholar]
- 4.Lin JD, Chao TC, Hsuh C, Kuo SF. High recurrent rate of multicentre papillary thyroid carcinoma. Ann Surg Oncol. 2009;16:2609–1616. doi: 10.1245/s10434-009-0565-7. [DOI] [PubMed] [Google Scholar]
- 5.Takada H, Kikumori T, Imai T. Patterns of Lymph Node Metastases in Papillary Thyroid Carcinoma: Results from Consecutive Bilateral Cervical Lymph Node Dissection. World J Surg. 2011;35:1560–1566. doi: 10.1007/s00268-011-1133-4. [DOI] [PubMed] [Google Scholar]
- 6.Kim SM, Chun KW, Chang HJ, Kim BW, Lee YS, Chang HS, Park CS. Solitary lateral neck node metastasis in papillary thyroid carcinoma. World J Surg Oncol. 2014;12:109. doi: 10.1186/1477-7819-12-109. [DOI] [PMC free article] [PubMed] [Google Scholar]
- 7.Shinto M, Wu JC, Park EE, Tanzella F. The importance of central compartment elective lymph node excision in the staging and treatment of papillary thyroid cancer. Arch Otolaryngol Head Neck Surg. 2006;132:650–654. doi: 10.1001/archotol.132.6.650. [DOI] [PubMed] [Google Scholar]
- 8.Sugino K, Mitsuji KI, Nagahama M, Kitagawa W, Shibuya H, Ohkuwa K, Yano Y, Uruno T, Akaishi J, Suzuki A, Masaki C, Ito K. Diagnostic accuracy of fine needle aspiration biopsy cytology and ultrasonography in patients with thyroid nodules diagnosed as benign or indeterminate before thyroidectomy. Endocrine Journal. 2013;60:375–382. doi: 10.1507/endocrj.ej12-0338. [DOI] [PubMed] [Google Scholar]
- 9.Peli M, Capalbo E, Lovisatti M, Cosentino M, Berti E, Mattai Dal Moro R, Cariati M. Ultrasound guided fine-needle aspiration biopsy of thyroid nodules: Guidelines and recommendations vs clinical practice; a 12-month study of 89 patients. J Ultrasound. 2012;15:102–107. doi: 10.1016/j.jus.2011.12.004. [DOI] [PMC free article] [PubMed] [Google Scholar]
- 10.Huang LY, Lee YL, Chou P, Chiu WY, Chu D. Thyroid Fine-Needle Aspiration Biopsy and Thyroid Cancer Diagnosis: A Nationwide Population-Based Study. PLoS One. 2015;10:e0127354. doi: 10.1371/journal.pone.0127354. [DOI] [PMC free article] [PubMed] [Google Scholar]
- 11.Pauzar B, Staklenac B, Loncar B. Fine Needle Aspiration Biopsy of Follicular Thyroid Tumors. Coll Antropol. 2010;34:87–91. [PubMed] [Google Scholar]
- 12.Issaq HJ, Nativ O, Waybright T, Luke B, Veenstra TD, Issaq EJ, Kravstov A, Mullerad M. Detection of Bladder Cancer in Human Urine by Metabolomic;ling Using High Performance Liquid Chromatography/Mass Spectrometry. J Urol. 2008;179:2422–2426. doi: 10.1016/j.juro.2008.01.084. [DOI] [PubMed] [Google Scholar]
- 13.Pradhan MP, Desai A, Palakal MJ. Systems biology approach to stage-wise characterization of epigenetic genes in lung adenocarcinoma. BMC Syst Biol. 2013;7:141. doi: 10.1186/1752-0509-7-141. [DOI] [PMC free article] [PubMed] [Google Scholar]
- 14.Stefansson OA, Esteller M. Epigenetic Modifications in Breast Cancer and Their Role in Personalized Medicine. Am J Pathol. 2013;183:1052–1063. doi: 10.1016/j.ajpath.2013.04.033. [DOI] [PubMed] [Google Scholar]
- 15.Szyf M. Targeting DNA methylation in cancer. Ageing Res Rev. 2003;2:299–328. doi: 10.1016/s1568-1637(03)00012-6. [DOI] [PubMed] [Google Scholar]
- 16.Feng H, Cheung AN, Xue WC, Wang Y, Wang X, Fu S, Wang Q, Ngan HY, Tsao SW. Down-regulation and promoter methylation of tissue inhibitor of metalloproteinase 3 in chorioearcinoma. Gynecol Oncol. 2004;94:375–382. doi: 10.1016/j.ygyno.2004.04.019. [DOI] [PubMed] [Google Scholar]
- 17.Brueckl WM, Grombach J, Wein A, Ruckert S, Porzner M, Dietmaier W, Rümmele P, Croner RS, Boxberger F, Kirchner T, Hohenberger W, Hahn EG, Jung A. Alterations in the tissue inhibiter of metalloproteinase-3 (TIMP-31 and found frequently in human eolorectal tunlolx Displaying either mlcrosatellite stability (MSS)or instability (MSI) Cancer Lett. 2005;223:137–142. doi: 10.1016/j.canlet.2004.09.037. [DOI] [PubMed] [Google Scholar]
- 18.Damton SJ, Hardie LJ, Muc RS, Wild CP, Casson AG. Tissue inhibitor of metalloproteinase-3 (TIMP-3) gene is Methylated in the development of esophageal adenocareinoma: lass of expression correlates with poor prognosis. Int J Cancer. 2005;115:351–358. doi: 10.1002/ijc.20830. [DOI] [PubMed] [Google Scholar]
- 19.Catalano MG, Fortunati N, Boccuzzi G. Epigenetics modifications and therapeutic prospects in human thyroid cancer. Front Endocrinol (Lausanne) 2012;3:40. doi: 10.3389/fendo.2012.00040. [DOI] [PMC free article] [PubMed] [Google Scholar]
- 20.Xing M, Cohen Y, Mambo E, Tallini G, Udelsman R, Ladenson PW, Sidransky D. Early OCUl Tenee of RASSFIA hypermethy-lation and its mutual exclusion with BBAF mutation in thyroid tulllor epigenesis. Cancer Res. 2004;64:1664–1668. doi: 10.1158/0008-5472.can-03-3242. [DOI] [PubMed] [Google Scholar]
- 21.Lee SJ, Lee MH, Kim DW, Lee S, Huang S, Ryu MJ, Kim YK, Kim SJ, Kim SJ, Hwang JH, Oh S, Cho H, Kim JM, Lim DS, Jo YS, Shong M. Cross-regulation between onco-genic BRAF(V600E)kinase and the MSTI pathway in papillary thyroid carcinoma. PLoS One. 2011;6:e16180. doi: 10.1371/journal.pone.0016180. [DOI] [PMC free article] [PubMed] [Google Scholar]
- 22.Chen JL, Tang HQ, Hu JD, Fan J, Hong J, Gu JZ. Metabolomics of gastric cancer metastasis detected by gas chromatography and mass spectrometry. World J Gastroenterol. 2010;16:5874–5880. doi: 10.3748/wjg.v16.i46.5874. [DOI] [PMC free article] [PubMed] [Google Scholar]
- 23.Chen Z, Lu W, Garcia-Prieto C, Huang P. The Warburg effect and its cancer therapeutic implications. J Bioenerg Biomembr. 2007;39:267–274. doi: 10.1007/s10863-007-9086-x. [DOI] [PubMed] [Google Scholar]
- 24.Zhang J, Liu L, Wei S, Nagana Gowda GA, Hammoud Z, Kesler KA, Raftery D. Metabolomics study of esophageal adenocarcinoma. J Thorac Cardiovasc Surg. 2011;141:469–475. doi: 10.1016/j.jtcvs.2010.08.025. [DOI] [PubMed] [Google Scholar]
- 25.Brizel DM, Schroeder T, Scher RL, Walenta S, Clough RW, Dewhirst MW, Mueller-Klieser W. Elevated tumor lactate concentrations predict for an increased risk of metastases in head-and-neek cancer. Int J Radiat Oncol Biol Phys. 2001;51:349–353. doi: 10.1016/s0360-3016(01)01630-3. [DOI] [PubMed] [Google Scholar]
- 26.Yan H, Bigber D, Velculescu V, Parsons DW. Mutant metabolic enzymes are at the origin of gliomas. Cancer Res. 2009;69:9157–9159. doi: 10.1158/0008-5472.CAN-09-2650. [DOI] [PMC free article] [PubMed] [Google Scholar]