Abstract
Glioma is the most common form of primary brain tumor. Increasing evidence show that IDH1 gene mutation is implicated in glioma. However, the mechanism involved in the progression of glioma remains unclear until now. In the study reported here, we used gene chip to identifying the genes regulated with IDH mutanted at R132. The results showed that IDH1-mutant leads to 1255 up-regulated genes and 1862 down-regulated genes in U87 cell lines. Meanwhile, GO and gene-network was performed and shown IDH1-mutant mainly affect small molecule metabolic process, mitotic cell cycle and apoptosis. This result will lay a foundation for further study of IDH1 gene function in the future.
Keywords: Glioma, IDH1, gene mutation, gene-chip, overexpression
Introduction
Glioma is the most common form of primary brain tumor, accounting for ~7% of the years of life lost caused by cancer [1,2]. Glioma tumors are histologically divided into Grade I through IV according to the WHO (World Health Organization) criteria. The median survival after diagnosis of patients with the most common glioma-glioblastoma is 14 months [3]. Glioma exhibits a relentless malignant progression characterized by widespread invasion throughout the brain, resistance to all therapeutic approaches, destruction of normal brain tissue and ultimately leads to the patient’s death [3]. Despite significant improvements in treatments for glioma patients, the median survival remains poor. Patients with newly diagnosed GBM exhibit a median survival of approximately 12 months, with generally poor responses to all therapeutic approaches [3,4]. Thus, the fundamental research on the pathogenesis of glioma remains necessary at the present stage.
IDH1 gene encodes isocitrate dehydrogenase 1, which catalyzes the oxidative carboxylation of isocitrate to α-ketoglutarate, resulting in the production of nicotinamide adenine dinucleotide phosphate [5]. The IDH1 protein forms an asymmetric homodimer and is thought to play a substantial role in cellular control of oxidative damage through generation of NADPH [6,7]. IDH1 with mutations were found in high frequency in glioma [8-13]. IDH1 protein exists in the cytoplasm and peroxisome whereas IDH2 protein resides in the mitochondria. The IDH1 R132 mutations were found to occur frequently in gliomas in a whole-genome exon-sequencing analysis [7], and a high frequency of the same mutations were later discovered in AML [14]. This genetic evidence led to early speculation that the IDH mutations confer the enzymes with an oncogenic gain of function.
In the present study, we used gene over-expression and gene-chip techniques to identify the IDH1 mutant type related genes, which be regulated directly/indirectly by IDH1 mutant in U87 cell lines. This result will lay a foundation for further study of IDH1 gene function in the future.
Materials and methods
Cell culture
The human glioblastoma cell line U87 was obtained from the Cell Bank in the Type Culture Collection of Chinese Academy of Sciences (Shanghai, China) and cultured in Dulbecco’s modified Eagle’s medium (Gibco, Grand Island, New York, USA), supplemented with 10% fetal bovine serum (FBS). The cells were grown at 37°C in a humidified-air atmosphere incubator containing 5% CO2.
Construction of recombinant expression lentiviruses
A recombinant pLenti6.3_MCS_IRES2-EGFP expression vector containing the human IDH1 wild type/mutant type cDNA was constructed. The expression vectors and the Packaging Mix were co-transfected into the 293FT cell line to generate lentiviral stocks, which were used to infect with the mammalian U87 cell line. The expression of wild/mutant type IDH1 was further confirmed by real time PCR and standard Western blot analysis. The cell line transfected with pLenti-IDH1-IRES-eGFP and the cell line expressing the negative pLenti6.3-MIG were referred to as U87-IDH1-mutant, and U87-IDH-wild, respectively. The U87 cell lines and transfected derivatives were maintained in DMEM supplemented with 2% fetal bovine serum and 8 μg/mL polybrene.
Real time PCR
The mRNA level of IDH1 was determined by real-time PCR. Total RNA was extracted from the cultured cells with Trizol (Invitrogen). The specific primers were synthesized by Sangon Biotechnology (Shanghai, China) and were presented in Table 1. The real-time PCR experiments were performed on an ABI 7500 Fast Real-Time PCR system (ABI, Foster City, CA). The first reaction mixtures included diluted cDNA, 50 μM of each gene-specific primer, 10 mM dNTP, and DEPC-treated water to a volume of 10 μL, which was mixed with the second reaction mixtures containing 10×RT butter, 25 mM Mg2+, 0.1 M dTT, 40 U/µL RNaseout, and 200 U/µL SuperScrip III RT to a final volume of 20 μL. In addition, the glyceraldehyde-3-phosphate dehydrogenase (GAPDH) gene was used to calculate the delta CT as the control, Primer sequences were as follows: human IDH1: (F) 5’-AGGCTCATCGACGACATGGT-3’, (R) 5’-TGGTACATGCGGTAGTGACG-3’; GAPDH: (F) 5’-GAAGGTCGGAGTCAACGGATT-3’, (R) 5’-CGCTCCTGGAAGATGGTGAT-3’. All the samples were performed in triplicate.
Table 1.
Top 10 genes in all of up-regulated genes
| Gene symbol | Chr | Fold change | Style | p-value | Gene Description |
|---|---|---|---|---|---|
| CPA4 | Chr7 | 7.21 | up | < 1e-07 | carboxypeptidase A4 |
| NDRG1 | Chr8 | 6.61 | up | < 1e-07 | N-myc downstream regulated 1 |
| PI3 | Chr20 | 5.83 | up | < 1e-07 | peptidase inhibitor 3 |
| DHCR24 | Chr1 | 5.74 | up | < 1e-07 | 24-dehydrocholesterol reductase |
| SLC2A1 | Chr1 | 5.41 | up | < 1e-07 | solute carrier family 2 |
| FAM111B | Chr11 | 4.45 | up | < 1e-07 | family with sequence similarity 111 |
| METTL7B | Chr12 | 3.62 | up | 9.0E-07 | methyltransferase like 7B |
| NEK10 | Chr3 | 3.56 | up | < 1e-07 | NIMA-related kinase 10 |
| LOC654433 | Chr2 | 5.53 | up | < 1e-07 | LOC654433 |
| ANGPTL4 | Chr19 | 3.48 | up | 3.0E-07 | angiopoietin-like 4 |
Western blotting
The cultured cells (1 × 10⁶) were lysed with 100 μL mixtures containing 10 μL PMSF (17.4 mg/mL) and 20 μL Protease Inhibitor cocktail (0.89 mg/mL) under ice-bath for 30 min. after centrifugation at 12,000 rpm for 3 min, the supernatant was obtained. The amount of total protein content was determined by a BCA protein assay kit (Pierce, Rockford, IL, USA). The sample (180 μg/lane) was separated by 8% SDS-polyacrylamide gel electrophoresis. Then a polyvinylidene difluoride membrane was used to electro-transfer. The membrane was blocked with TBST solution containing 5% nonfat milk at room temperature for 1 h and incubated overnight at 4°C with primary antibodies. In addition, the glyceraldehyde-3-phosphate dehydrogenase (GAPDH) was taken as the loading control. All the blotted protein bands were exposed to X-ray film. All experiments were repeated in triplicate.
Statistical analysis
The results obtained in vitro were expressed as mean ± SEM. All statistical analyses were estimated using post hoc tests after significant ANOVA. It could be considered statistically significant as the values of P < 0.05.
Results
Transfection efficiency of recombinant plasmids in U87 cell lines
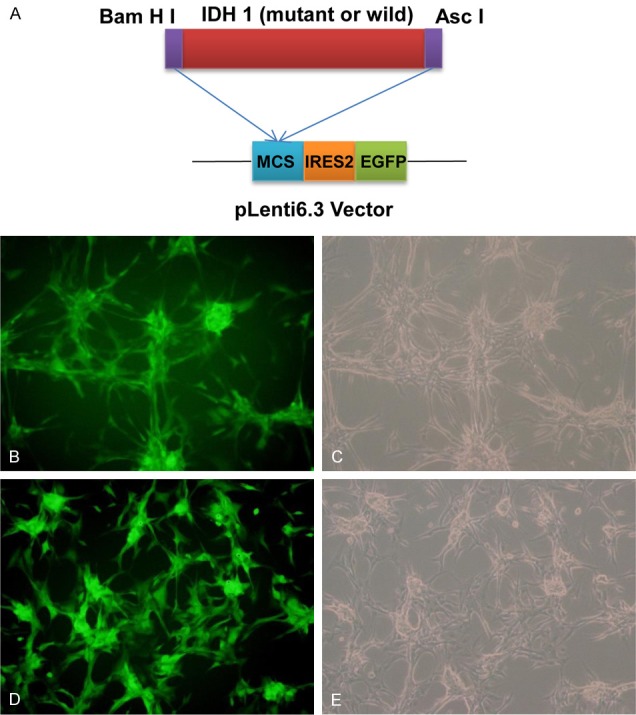
The U87 cell lines were infected with pLenti-IDH1-mutant. pLenti-IDH1-wild vector was used as control. After 48 h infection, the cells were observed under an inverted fluorescence microscope. As shown in Figure 1, EGFP expressed efficiently both in pLenti-IDH1-IRES-eGFP and empty vector, which indicated that U87 cell lines was infected by our prepared virus vector and IDH1 may be mediated coming into U87 cell by lentiviral vector. However, we need to verify it by real time PCR and western blot in the next experiment.
Figure 1.

Transfection of U87 cell lines with lentivirus of pLenti-IDH1-IRES-eGFP. A. Schematic diagram of IRES-based and dual promoter lentiviral vectors, the schematic map of the pLenti-IDH1-IRES-eGFP plasmids; B, C. U87 cell lines infected with pLenti6.3-IHD1-mutant were detected by fluorescence microscopy and visible spectrum, respectively; D, E. U87 cell lines infected with pLenti-IDH1-wild were detected by fluorescence microscopy and visible spectrum, respectively.
Expression analysis of IDH1 both in mRNA and protein level in U87 cell lines treated with lentiviral vector
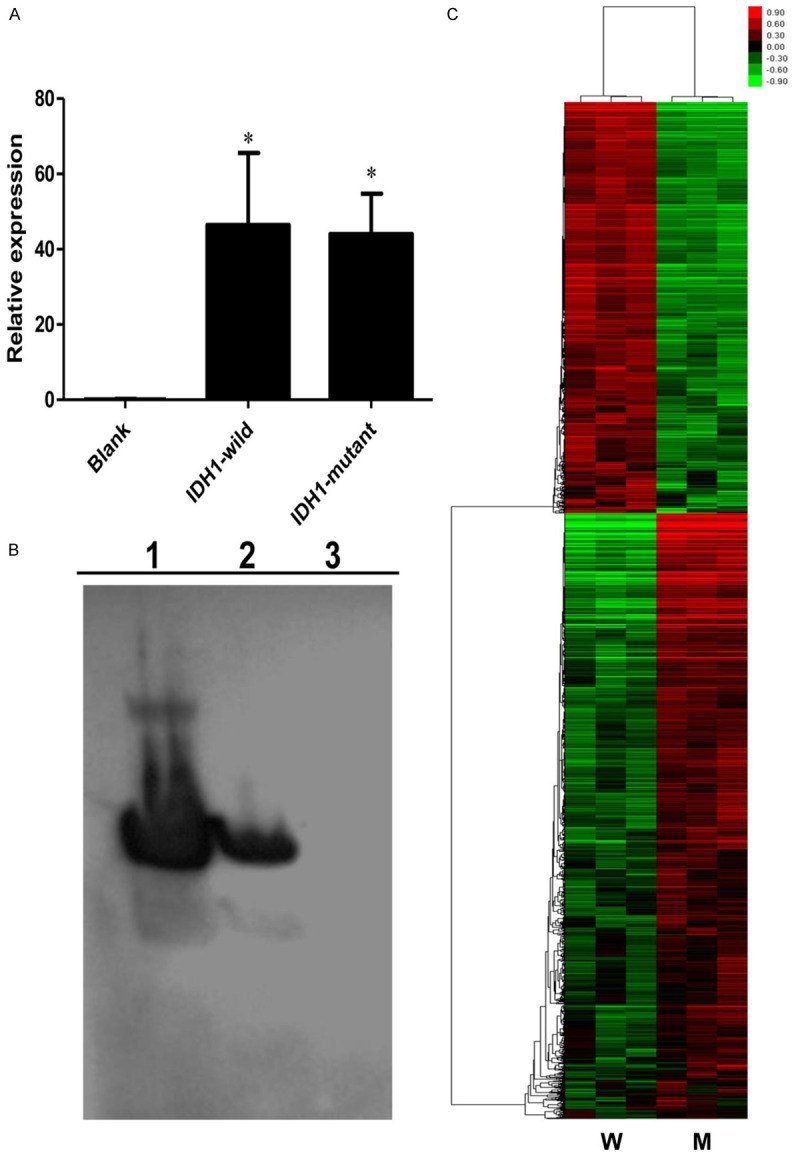
The relative expression level of IDH1 mRNA in U87 cell lines infected with plasmids were relatively 500 folds than the empty vector control group. And a statistically significant difference was observed in Figure 2A when compared with the empty vector control groups. In addition, Figure 2B indicated the protein expression of IDH1 after 48 h following infection demonstrated a significant difference compared to the control.
Figure 2.

mRNA expression and protein expression of IDH1 in U87 cell lines and analysis of expression profile by gene-chip. A. Real-time PCR quantification of IDH1 in U87 cells transfected with virus (empty vector, IDH1-mutant and IDH1-wild); B. Western blot of IDH1 expression extracted from U87 cells transfected with virus (1 = IDH1-mutant, 2 = IDH1-wild and 3 = empty vector); C. Genes up- and down-regulated in U87-IDH1-mutant cells compared with U87-IDH1-wild cells as identified by microarray hybridization analysis. Each column represented a single sample, whereas each row represented a single probe set. The coloured scales represent the expression ratios of different genes. Green squares indicate transcript levels below the mean value; Black squares show transcript levels equal to the median normal value; Red squares exhibit transcript levels higher than the mean value.
Difference of gene expression profile by gene-chip
In order to explore the genes regulated directly or indirectly by IDH1-mutant, difference of gene expression profile between IDH1-mutantand IDH1-wild was performed. As shown in Figure 2C, 6 samples (3 IDH1 wild groups and 3 IDH1 mutant groups) were detected and analysed. Compared to control groups, 1255 up-regulated genes and 1862 down-regulated genes were found (fold change > 1.2, P < 0.05). Meanwhile, top 10 genes were listed as Tables 1 and 2. All of these data indicated that these DEGs may be implicated with the development and progression of glioblastoma mediated by IDH1-mutant. Among the significant upregulated genes in the overexpression groups, CPA4 was the top gene as shown in Figure 3, with a fold change of 7.21.
Table 2.
Top 10 genes in all of down-regulated genes
| Gene symbol | Chr | Fold change | Style | p-value | Gene Description |
|---|---|---|---|---|---|
| IL1A | Chr2 | 0.037 | Down | < 1e-07 | interleukin 1 |
| IL6 | Chr7 | 0.065 | Down | < 1e-07 | interleukin 6 |
| SLC7A11 | Chr4 | 0.066 | Down | < 1e-07 | solute carrier family 7 |
| CLDN1 | Chr3 | 0.067 | Down | < 1e-07 | claudin 1 |
| CTH | Chr1 | 0.097 | Down | < 1e-07 | cystathionase |
| ASNS | Chr7 | 0.100 | Down | < 1e-07 | asparagine synthetase |
| CHAC1 | Chr15 | 0.100 | Down | < 1e-07 | cation transport regulator homolog 1 |
| SPRR2D | Chr1 | 0.110 | Down | 6.00E-07 | small proline-rich protein 2D |
| CXCL2 | Chr4 | 0.110 | Down | 1.00E-07 | chemokine ligand 2 |
| CXCL1 | Chr4 | 0.110 | Down | < 1e-07 | chemokine ligand 1 |
Figure 3.
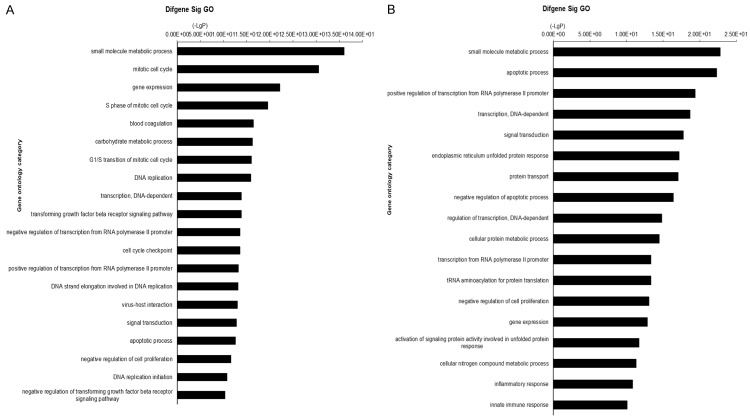
Gene ontology analysis of DEGs. A. GO analysis for up-regulated genes. a: Small molecule metabolic process; b: Mitotic cell cycle; c: Gene expression; d: S phase of mitotic cell cycle; e: Blood coagulation carbohydrate metabolic process; f: G1/S transition of mitotic cell cycle; g: DNA replication; h: Transcription, DNA-dependent; i: Transforming growth factor beta receptor signaling pathway; j: Negative regulation of transcription from RNA polymerase II promoter; k: Cell cycle checkpoint; l: Positive regulation of transcription from RNA polymerase II promoter; m: DNA strand elongation involved in DNA replication; n: Virus-host interaction; o: Signal transduction; p: Apoptotic process; q: Negative regulation of cell proliferation; r: DNA replication initiation; s: Negative regulation of transforming growth factor beta receptor signaling pathway. B. GO analysis for down-regulated genes. a: Small molecule metabolic process; b: Apoptotic process; c: Positive regulation of transcription from RNA polymerase II promoter; d: Transcription, DNA-dependent; e: Signal transduction; f: Endoplasmic reticulum unfolded protein response; g: Protein transport; h: Negative regulation of apoptotic process; i: Regulation of transcription, DNA-dependent; j: Cellular protein metabolic process; k: Transcription from RNA polymerase II promoter; l: tRNA aminoacylation for protein translation; m: Negative regulation of cell proliferation; n: Gene expression; o: Activation of signaling protein activity involved in unfolded protein response; p: Cellular nitrogen compound metabolic process; q: Inflammatory response; r: Innate immune response.
Gene ontology analysis of DEGs
For further understanding the function of DEGs, we performed GO analysis using all up- and down-regulated genes. As shown in Figure 3A, 3B, up-regulated genes mainly participate in small molecule metabolic process, mitotic cell cycle, gene expression and S phase of mitotic cell cycle. While, down-regulated gene mainly implicated with small molecule metabolic process, apoptotic process, positive regulation of transcription from RNA polymerase II promoter and transcription, DNA-dependent. All data indicated that IDH1-mutant gene may exert function through these processes described above.
Gene-interaction network
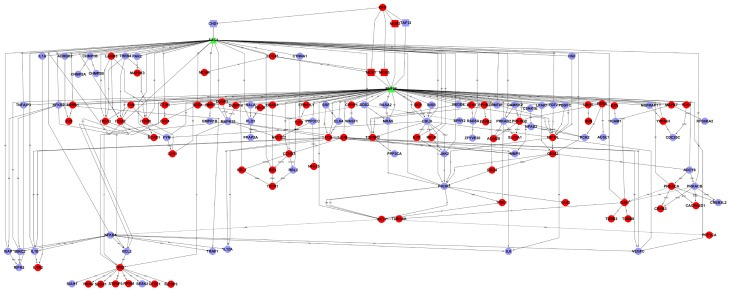
Gene-interaction analysis showed that IDH1-mutant gene can regulate directly MCM3/5/7, IHD1 and TAF12, in which, MCM3, MCM5 and MCM7 genes were up-regulated. IHD1 and TAF12 were down-regulated. IHD1 and TAF12 can interact with transcriptional factor RNF9 and FAC1. DNA replication licensing factor MCM is a class of proteins that in humans is encoded by the MCM gene. MCM is one of the highly conserved mini-chromosome maintenance proteins (MCM) that are essential for the initiation of eukaryotic genome replication.
Discussion
With the development bioinformatic, gene-chip was diffusely applied in biological field to elucidate pathogenetic mechanism for a variety of diseases, including glioma [15]. IDH1 is thought to play a pivotal role in geneisis and development of gliomas. In our study, we over-expressed IDH1-mutant and IDH1-wild in U87 cell mediated by lentiviral vector, and then detected the gene expression profile using gene-Chip to identify the IDH1-mutant related genes, aiming to elucidate the function mechanism involved in geneisis and development of gliomas.
Mutations in IDH1 are also implicated in cancer. Originally, mutations in IDH1 were detected in an integrated genomic analysis of human glioblastoma multiforme [7]. For further explore the function of IDH1 containing mutation, it is necessary to reveal the molecular mechanism of IDH1 gene. Our results show that IDH1-mutant overexpression lead to 1255 up-regulated genes and 1862 down-regulated genes in U87 cell lines. This result suggested that IDH1-mutant gene exerts its function through regulating these genes directly or indirectly. Ton 10 of up-/down-regulated genes was listed in Tables 1 and 2. In which the expression change of CPA4 and IL1A is most significant. CPA4 is a member of the carboxypeptidase A/B subfamily, and it is located in a cluster with three other family members on chromosome 7. Carboxypeptidases are zinc-containing exopeptidases that catalyze the release of carboxy-terminal amino acids, and are synthesized as zymogens that are activated by proteolytic cleavage. This gene could be involved in the histone hyperacetylation pathway. It is imprinted and may be a strong candidate gene for prostate cancer aggressiveness [16,17]. Previous study shown that CPA4 is associated with the risk of prostate cancer [17]. Similarly, IL1A is also a cancer-related gene in ovarian cancer, Charbonneau B, et al found that a missense single-nucleotide polymorphism (SNP) in the immune modulatory gene IL1A has been associated with ovarian cancer risk [18].
Meanwhile, the results from GO analysis shown that difference expression genes mainly participate in small molecule metabolic process, mitotic cell cycle, gene expression, apoptotic process, transcription and so on. These biological processes are thought to play vital roles in homeostasis. Dysfunction will lead to tumor formation or another disease. Finally, gene- interaction network was performed. As shown in Figure 4, IDH1-mutant gene can regulated directly MCM3/5/7, IHD1 and TAF12, in which, MCM3, MCM5 and MCM7 genes were up-regulated. IHD1-mutant and TAF12 were down-regulated. IHD1 and TAF12 can interact with transcriptional factor RNF9 and FAC1. DNA replication licensing factor MCM is a class of proteins that in humans is encoded by the MCM gene.MCM is one of the highly conserved mini-chromosome maintenance proteins (MCM) that are essential for the initiation of eukaryotic genome replication [19,20].
Figure 4.
Gene-interaction network. Red: up-regulated gene. Violet: down-regulated gene. Green: transcriptional factor. a: activation; a(-p): activation (dephosphorylation); a(ind): activation (indirect effect); a(+p): activation (phosphorylation); a(u): activation (ubiquination); b: binding/association; c: compound; c(a): compound (activation); disso: dissociation; ex: expression; ex(ind): expression (indirect effect); ind: indirect effect; inh: inhibition; inh(-p): inhibition (dephosphorylation); inh(ind): inhibition (indirect effect); inh(+p): inhibition (phosphorylation); inh(u): inhibition (ubiquination); m: missing interaction; p: phosphorylation; u: ubiquination; u(inh): ubiquination (inhibition).
In the present study, we used gene over-expression and gene-chip techniques to identify the IDH1-mutantrelated genes, which be regulated directly/indirectly by IDH1-mutant in U87 cell lines, and results showed that IDH1-mutant overexpression lead to 1255 up-regulated genes and 1862 down-regulated genes in U87 cell lines. This result suggested that IDH1-mutant gene exerts its function through regulating these genes directly or indirectly. This result will lay a foundation for further study of IDH1 gene function in the future.
Acknowledgements
This study was supported by the Youth Fund of the National Natural Science Foundation of China (grant number: 81201979) and the Youth Fund of the National Natural Science Foundation of China (grant number: 81201975).
Disclosure of conflict of interest
None.
References
- 1.Furnari FB, Fenton T, Bachoo RM, Mukasa A, Stommel JM, Stegh A, Hahn WC, Ligon KL, Louis DN, Brennan C, Chin L, DePinho RA, Cavenee WK. Malignant astrocytic glioma: genetics, biology, and paths to treatment. Genes Dev. 2007;21:2683–2710. doi: 10.1101/gad.1596707. [DOI] [PubMed] [Google Scholar]
- 2.Gladson CL, Prayson RA, Liu WM. The pathobiology of glioma tumors. Annu Rev Pathol. 2010;5:33–50. doi: 10.1146/annurev-pathol-121808-102109. [DOI] [PMC free article] [PubMed] [Google Scholar]
- 3.Stupp R, Mason WP, van den Bent MJ, Weller M, Fisher B, Taphoorn MJ, Belanger K, Brandes AA, Marosi C, Bogdahn U, Curschmann J, Janzer RC, Ludwin SK, Gorlia T, Allgeier A, Lacombe D, Cairncross JG, Eisenhauer E, Mirimanoff RO European Organisation for Research and Treatment of Cancer Brain Tumor and Radiotherapy Groups; National Cancer Institute of Canada Clinical Trials Group. Radiotherapy plus concomitant and adjuvant temozolomide for glioblastoma. N Engl J Med. 2005;352:987–996. doi: 10.1056/NEJMoa043330. [DOI] [PubMed] [Google Scholar]
- 4.Cancer Genome Atlas Research Network. Comprehensive genomic characterization defines human glioblastoma genes and core pathways. Nature. 2008;455:1061–1068. doi: 10.1038/nature07385. [DOI] [PMC free article] [PubMed] [Google Scholar]
- 5.Geisbrecht BV, Gould SJ. The human PICD gene encodes a cytoplasmic and peroxisomal NADP(+)-dependent isocitrate dehydrogenase. J Biol Chem. 1999;274:30527–30533. doi: 10.1074/jbc.274.43.30527. [DOI] [PubMed] [Google Scholar]
- 6.Xu X, Zhao J, Xu Z, Peng B, Huang Q, Arnold E, Ding J. Structures of human cytosolic NADP-dependent isocitrate dehydrogenase reveal a novel self-regulatory mechanism of activity. J Biol Chem. 2004;279:33946–33957. doi: 10.1074/jbc.M404298200. [DOI] [PubMed] [Google Scholar]
- 7.Parsons DW, Jones S, Zhang X, Lin JC, Leary RJ, Angenendt P, Mankoo P, Carter H, Siu IM, Gallia GL, Olivi A, McLendon R, Rasheed BA, Keir S, Nikolskaya T, Nikolsky Y, Busam DA, Tekleab H, Diaz LA Jr, Hartigan J, Smith DR, Strausberg RL, Marie SK, Shinjo SM, Yan H, Riggins GJ, Bigner DD, Karchin R, Papadopoulos N, Parmigiani G, Vogelstein B, Velculescu VE, Kinzler KW. An integrated genomic analysis of human glioblastoma multiforme. Science. 2008;321:1807–1812. doi: 10.1126/science.1164382. [DOI] [PMC free article] [PubMed] [Google Scholar]
- 8.De Carli E, Wang X, Puget S. IDH1 and IDH2 mutations in gliomas. N Engl J Med. 2009;360:2248. doi: 10.1056/NEJMc090593. author reply 2249. [DOI] [PubMed] [Google Scholar]
- 9.Ducray F, Marie Y, Sanson M. IDH1 and IDH2 mutations in gliomas. N Engl J Med. 2009;360:2248–2249. author reply 2249. [PubMed] [Google Scholar]
- 10.Houillier C, Wang X, Kaloshi G, Mokhtari K, Guillevin R, Laffaire J, Paris S, Boisselier B, Idbaih A, Laigle-Donadey F, Hoang-Xuan K, Sanson M, Delattre JY. IDH1 or IDH2 mutations predict longer survival and response to temozolomide in low-grade gliomas. Neurology. 2010;75:1560–1566. doi: 10.1212/WNL.0b013e3181f96282. [DOI] [PubMed] [Google Scholar]
- 11.Komotar RJ, Starke RM, Sisti MB, Connolly ES. IDH1 and IDH2 mutations in gliomas and the associated induction of hypoxia-inducible factor and production of 2-hydroxyglutarate. Neurosurgery. 2010;66:N20–21. doi: 10.1227/01.neu.0000369899.41915.67. [DOI] [PubMed] [Google Scholar]
- 12.Yan H, Parsons DW, Jin G, McLendon R, Rasheed BA, Yuan W, Kos I, Batinic-Haberle I, Jones S, Riggins GJ, Friedman H, Friedman A, Reardon D, Herndon J, Kinzler KW, Velculescu VE, Vogelstein B, Bigner DD. IDH1 and IDH2 mutations in gliomas. N Engl J Med. 2009;360:765–773. doi: 10.1056/NEJMoa0808710. [DOI] [PMC free article] [PubMed] [Google Scholar]
- 13.Balss J, Meyer J, Mueller W, Korshunov A, Hartmann C, von Deimling A. Analysis of the IDH1 codon 132 mutation in brain tumors. Acta Neuropathol. 2008;116:597–602. doi: 10.1007/s00401-008-0455-2. [DOI] [PubMed] [Google Scholar]
- 14.Mardis ER, Ding L, Dooling DJ, Larson DE, McLellan MD, Chen K, Koboldt DC, Fulton RS, Delehaunty KD, McGrath SD, Fulton LA, Locke DP, Magrini VJ, Abbott RM, Vickery TL, Reed JS, Robinson JS, Wylie T, Smith SM, Carmichael L, Eldred JM, Harris CC, Walker J, Peck JB, Du F, Dukes AF, Sanderson GE, Brummett AM, Clark E, McMichael JF, Meyer RJ, Schindler JK, Pohl CS, Wallis JW, Shi X, Lin L, Schmidt H, Tang Y, Haipek C, Wiechert ME, Ivy JV, Kalicki J, Elliott G, Ries RE, Payton JE, Westervelt P, Tomasson MH, Watson MA, Baty J, Heath S, Shannon WD, Nagarajan R, Link DC, Walter MJ, Graubert TA, DiPersio JF, Wilson RK, Ley TJ. Recurring mutations found by sequencing an acute myeloid leukemia genome. N Engl J Med. 2009;361:1058–66. doi: 10.1056/NEJMoa0903840. [DOI] [PMC free article] [PubMed] [Google Scholar]
- 15.Cheung HC, Baggerly KA, Tsavachidis S, Bachinski LL, Neubauer VL, Nixon TJ, Aldape KD, Cote GJ, Krahe R. Global analysis of aberrant pre-mRNA splicing in glioblastoma using exon expression arrays. BMC Genomics. 2008;9:216. doi: 10.1186/1471-2164-9-216. [DOI] [PMC free article] [PubMed] [Google Scholar]
- 16.Tanco S, Zhang X, Morano C, Aviles FX, Lorenzo J, Fricker LD. Characterization of the substrate specificity of human carboxypeptidase A4 and implications for a role in extracellular peptide processing. J Biol Chem. 2010;285:18385–18396. doi: 10.1074/jbc.M109.060350. [DOI] [PMC free article] [PubMed] [Google Scholar]
- 17.Ross PL, Cheng I, Liu X, Cicek MS, Carroll PR, Casey G, Witte JS. Carboxypeptidase 4 gene variants and early-onset intermediate-to-high risk prostate cancer. BMC Cancer. 2009;9:69. doi: 10.1186/1471-2407-9-69. [DOI] [PMC free article] [PubMed] [Google Scholar]
- 18.Charbonneau B, Block MS, Bamlet WR, Vierkant RA, Kalli KR, Fogarty Z, Rider DN, Sellers TA, Tworoger SS, Poole E, Risch HA, Salvesen HB, Kiemeney LA, Baglietto L, Giles GG, Severi G, Trabert B, Wentzensen N, Chenevix-Trench G for AOCS/ACS group. Whittemore AS, Sieh W, Chang-Claude J, Bandera EV, Orlow I, Terry K, Goodman MT, Thompson PJ, Cook LS, Rossing MA, Ness RB, Narod SA, Kupryjanczyk J, Lu K, Butzow R, Dörk T, Pejovic T, Campbell I, Le ND, Bunker CH, Bogdanova N, Runnebaum IB, Eccles D, Paul J, Wu AH, Gayther SA, Hogdall E, Heitz F, Kaye SB, Karlan BY, Anton-Culver H, Gronwald J, Hogdall CK, Lambrechts D, Fasching PA, Menon U, Schildkraut J, Pearce CL, Levine DA, Kjaer SK, Cramer D, Flanagan JM, Phelan CM, Brown R, Massuger LF, Song H, Doherty JA, Krakstad C, Liang D, Odunsi K, Berchuck A, Jensen A, Lubinski J, Nevanlinna H, Bean YT, Lurie G, Ziogas A, Walsh C, Despierre E, Brinton L, Hein A, Rudolph A, Dansonka-Mieszkowska A, Olson SH, Harter P, Tyrer J, Vitonis AF, Brooks-Wilson A, Aben KK, Pike MC, Ramus SJ, Wik E, Cybulski C, Lin J, Sucheston L, Edwards R, McGuire V, Lester J, du Bois A, Lundvall L, Wang-Gohrke S, Szafron LM, Lambrechts S, Yang H, Beckmann MW, Pelttari LM, Van Altena AM, van den Berg D, Halle MK, Gentry-Maharaj A, Schwaab I, Chandran U, Menkiszak J, Ekici AB, Wilkens LR, Leminen A, Modugno F, Friel G, Rothstein JH, Vergote I, Garcia-Closas M, Hildebrandt MA, Sobiczewski P, Kelemen LE, Pharoah PD, Moysich K, Knutson KL, Cunningham JM, Fridley BL, Goode EL. Risk of ovarian cancer and the NF-kappaB pathway: genetic association with IL1A and TNFSF10. Cancer Res. 2014;74:852–861. doi: 10.1158/0008-5472.CAN-13-1051. [DOI] [PMC free article] [PubMed] [Google Scholar]
- 19.Yabuta N, Kajimura N, Mayanagi K, Sato M, Gotow T, Uchiyama Y, Ishimi Y, Nojima H. Mammalian Mcm2/4/6/7 complex forms a toroidal structure. Genes Cells. 2003;8:413–421. doi: 10.1046/j.1365-2443.2003.00645.x. [DOI] [PubMed] [Google Scholar]
- 20.Hua C, Zhao G, Li Y, Bie L. Minichromosome Maintenance (MCM) Family as potential diagnostic and prognostic tumor markers for human gliomas. BMC Cancer. 2014;14:526. doi: 10.1186/1471-2407-14-526. [DOI] [PMC free article] [PubMed] [Google Scholar]


