Abstract
This study is to investigate the correlation between urine metabolites and clinical staging in patients with ovarian cancer. The urina sanguinis from 56 cases of primary epithelial ovarian cancer patients and 15 healthy volunteers was collected and the urine metabolites were extracted. Ultra high performance liquid chromatography/time-of-flight mass spectrometry (UPLC-Q-TOF-MS) analysis was performed. Principal component analysis (PCA) and partial least squares discriminant analysis (PLS-DA) were used to analyze the mass spectrometry data. Database retrieval and comparison of the screened metabolites were performed and one-way ANOVA and least significant difference (LSD) t test were carried out. PCA analysis of UPLC-Q-TOF-MS results showed that the score plots of samples from healthy people and patients with ovarian cancer at different clinical stages were separated. Further PLS-DA analysis significantly improved the classification results. The R2X was 0.757, the R2Y was 0.977 and the Q2Y was 0.87, indicating that the model stability and predictability were good. Eight metabolites, including N-acetylneuraminic acid-9-phosphate, 5’-methioadenosine, uric acid-3-nucleoside, pseudouridine, L-valine, succinic acid, L-proline and β-nicotinamide mononucleotide were identified. The contents of these metabolites increased with the development of the disease. There was correlation between urine metabolites and clinical staging in patients with ovarian cancer.
Keywords: Ovarian cancer, urine, metabonomics, ultra high performance liquid chromatography/time-of-flight mass spectrometry, staging
Introduction
Ovarian cancer is one of the three malignant tumors of female reproductive system. Its specific pathogenesis is unclear and the treatment effect is not ideal [1,2]. The mortality rate of ovarian cancer ranks first in gynecological malignancies [3,4]. One of the main reasons for the non-ideal treatment effect of ovarian cancer is the occult symptoms of ovarian cancer in patients and hence most patients are in advanced stage at their initial diagnosis [5,6]. However, there are no effective ovarian cancer screening and evaluating methods at present. According to previous studies, urine metabolite phenotype of ovarian cancer patients is different from that of normal persons [7,8]. Clinical staging can clearly define the situation in patients with ovarian cancer and it is of great importance for situation estimation, treatment plan formulation and prognosis judgment of ovarian cancer patients [9,10]. Therefore, in this study, the correlation between urine metabolites and clinical staging was investigated using metabonomics so as to find a simple method for screening for ovarian cancer patients.
Materials and methods
Patients’ data
A total of 56 cases of patients with primary epithelial ovarian cancer admitted to Qilu Hospital of Shandong University from December 2011 to September 2013 were enrolled in this study. In addition, 15 health volunteers were taken as the control group. The patients were from 46 to 71 years old, with the average age of 58.41 ± 8.51 years old and the median age was 58.32 years. The volunteers were from 44 to 69 years old, with average age of 57.36 ± 7.82 years old, and the median age was 57 years. Before specimen collection, all the patients did not undergo any treatment. Among the patients, 34 cases were serous cystadenocarcinoma of ovarian, 8 cases were ovarian mucinous cystadenocarcinoma, 9 cases were endometrial adenocarcinoma, 4 cases were clear-cell carcinoma and 1 case was mixed epithelial carcinoma. According to FIGO staging standard released in May 2009, there were 10 cases of stage I, 9 cases of stage II, 31 cases of stage III and 6 cases of stage IV. Prior written and informed consent were obtained from all patients and the study was approved by the ethics review board of the Qilu Hospital.
Specimen collection and processing
Once collected, 1 ml urina sanguinis was centrifuged at 4000 r/min for 10 min and 300 μL supernatant was taken and added with 600 μL methanol. The supernatant and methanol was mixed for 10 min. Then the sample was centrifuged at 14000 r/min for 10 min at 4°C and 800 μL supernatant was removed. Then the supernatant was filtered with 0.45 μm filter and preserved in low temperature refrigerator.
Ultra high performance liquid chromatography/time-of-flight mass spectrometry (UPLC-Q-TOF-MS) assay
As for UPLC, Agilent Zorbax SB-C18 (Agilent Technologies, Santa Clara, CA, USA) was firstly balanced with mobile phase A (0.1% formic acid aqueous solution). After the sample was applied to the purification system, gradient elution of 0-2 min 5% B (acetonitrile), 2-6 min 5-90% B, 6-10 min 90% B and 10-12 min 5% B was performed successively. The purified samples were then applied to Agilent 6520A UPLC-Q-TOF-MS (Agilent Technologies, Santa Clara, CA, USA). The parameters used were as follows: ionization mode, electrospray-positive ion mode; drying gas temperature, 350°C; dry gas flow rate, 10 L/min; spray pressure, 30 Psi; fragmentation voltage, 175 V; capillary voltage, 3500 V; scanning range, 50-1000 m/z.
Data processing
UPLC-Q-TOF-MS peak area of total ion chromatography (TIC) integration for each sample was performed using Agilent chromatography workstation. Common peaks were selected and imported into SIMCA-P 12 software (Umetrics, Umea, Sweden) for normalization processing. Principal component analysis (PCA) was then performed and aggregation and outliers were observed. Partial least squares-discriminant analysis (PLS-DA) was then performed and metabolic markers which were closely related to staging were searched.
Statistical analysis
Statistical analysis was performed using SPSS version 19.0 (SPSS Inc, Chicago, IL, USA) for Windows and P value less than 0.05 was considered as statistically significant. Differences of metabolic markers between groups were tested with one-way ANOVA and least significant difference (LSD) t test.
Results
UPLC-Q-TOF-MS results
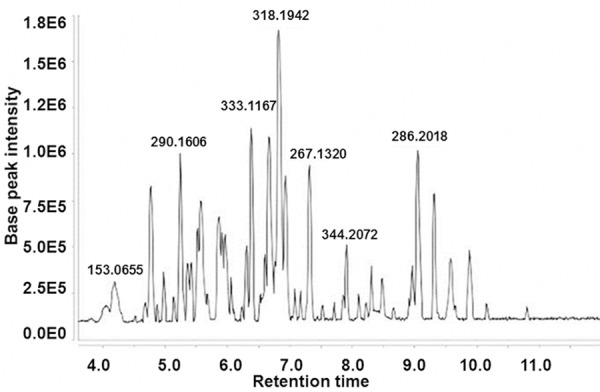
To detect the urine metabolites of patients with ovarian cancer, urine samples were analyzed by UPLC-Q-TOF-MS. Response value analysis of characteristics mass number of internal and external standard showed that the relative standard deviation (RSD) all were less than 3%, indicating that the analysis instrument was stability and the information acquired from the mass spectrometry was accurate and reliable. The representative UPLC-Q-TOF-MS total ion chromatography (TIC) of urine samples was shown in Figure 1. Each time point in the TIC represented the sum of 80-1000 m/z response values and each peak represented the information of one or several compounds. The result indicated that the instrument worked normally.
Figure 1.

Representative total ion chromatography of urine UPLC-Q-TOF-MS analysis of patients with ovarian cancer.
PCA and PLS-DA analysis of metabolites
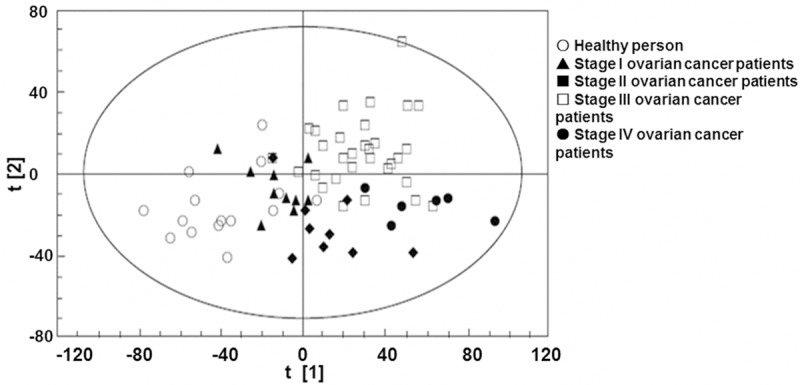
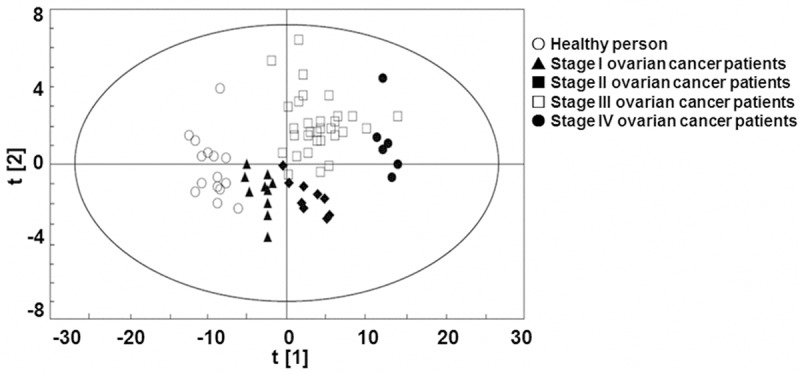
To analyze the urine metabolite composition of patients with ovarian cancer, UPLC-Q-TOF extracted data was analyzed by PCA and PLS-DA methods successively. PCA analysis result was shown in Figure 2. The result showed that the scores of samples from healthy people and those from patients with ovarian cancer at different clinical stages had separated trend in the plot. PLS-DA was performed for further analysis and as shown in Figure 3, the classification results were improved obviously while compared with PCA result. The R2X, which was used to express the interpretation ability of variable parameter X to the constructed model, was 0.757. The R2Y, which was used to measure the fitting of classification model, was 0.977. The Q2Y parameter to measure the prediction ability of the model was 0.87. The above three parameters indicating that the model stability and predictability were good. Collectively, the results argued that the urine metabolite composition of patients with ovarian cancer was different from that of normal people and was correlated with clinical stages.
Figure 2.

PCA score plot of urine metabolism in healthy people and patients with ovarian cancer. Each point in the graph represents a sample. ○: healthy people, ▲: stage I ovarian cancer patients, ■: stage II ovarian cancer patients, □: stage III ovarian cancer patients, ●: stage IV ovarian cancer patients.
Figure 3.

Partial least squares discriminant analysis score plot of urine metabolism in normal people and patients with ovarian cancer. ○: healthy people, ▲: stage I ovarian cancer patients, ■: stage II ovarian cancer patients, □: stage III ovarian cancer patients, ●: stage IV ovarian cancer patients.
Identification of different metabolites
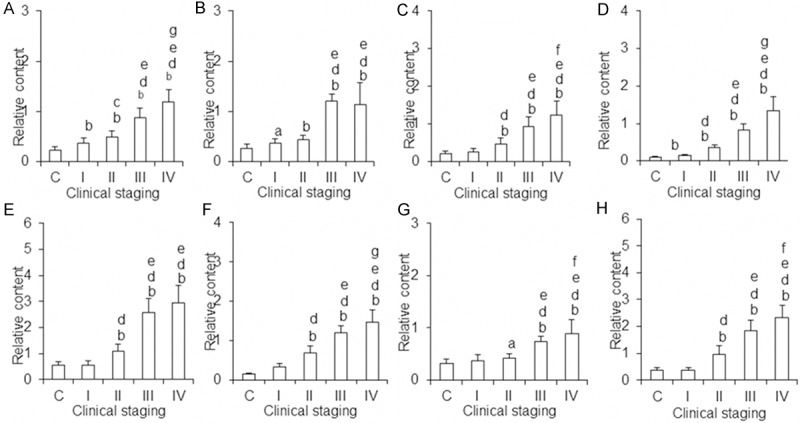
To identify metabolites which are closely linked to ovarian cancer staging, variable importance in projection (VIP) was tested after PLS-DA analysis. VIP value indicates the importance of the variable to sample classification, and the larger the value is, the more important role the variable plays on the distribution of the sample in the score plot. The different points which were acquired by combining VIP values and the correlation coefficients were analyzed with two-tailed t-test. Then the samples which had statistical significance were searched and compared against database. Finally, 8 metabolites reflecting different metabolic states between healthy people and ovarian cancer patients at different clinical stages were identified (Table 1). The relative contents and differences of these metabolites in urine of healthy people and the patients with ovarian cancer were shown in Figure 4. Collectively, the results argued that the difference of metabolic status between patients with ovarian cancer and normal people could be reflected by the changes in the concentration of urine metabolites.
Table 1.
The different urinary metabolites of ovarian cancer patients
| No | The different metabolites | VIP values | P values | Fold change values |
|---|---|---|---|---|
| 1 | N-Acetylneuraminic acid-9-phosphate | 5.26 | 0.00757 | 4.82 |
| 2 | 5’-Methylthioadenosine | 4.59 | 0.00901 | 2.89 |
| 3 | Uric acid-3-nucleoside | 4.40 | 0.01026 | 6.06 |
| 4 | Pseudouridine | 3.29 | 0.00344 | 9.15 |
| 5 | L-Valine | 2.92 | 0.00476 | 3.75 |
| 6 | Succinic acid | 2.51 | 0.01537 | 5.71 |
| 7 | L-Proline | 2.47 | 0.01133 | 1.33 |
| 8 | β-Nicotinamide mononucleotide | 2.32 | 0.00376 | 7.78 |
Figure 4.

Relative contents of the different urine metabolites in ovarian cancer patients. A. N-acetylneuraminic acid-9-phosphate; B. 5’-methioadenosine; C. Uric acid-3-nucleoside; D. Pseudouridine; E. L-valine; F. Succinic acid; G. L-proline; H. β-nicotinamide mononucleotide. aP < 0.05 vs control, bP < 0.01 vs control; cP < 0.05 vs stage I, dP < 0.01 vs stage I; eP < 0.01 vs stage II; fP < 0.05 vs stage III; gP < 0.01 vs stage III. C: The control group; I-IV: different stages of ovarian cancer group. The ordinate is the relative content of metabolites and the abscissa is grouping.
Discussion
Metabolomics is an emerging technology using small molecular metabolites as the studying objects. It has unique advantages and broad application value in tumor metabolic marker screening and pathogenesis elucidating [11-13]. To date, metabolomics technology has been used in a large number of basic and clinical researches on ovarian cancer [14-16]. It is reported that glycerophosphocholine/phosphatidylcholine ratio decreases in ovarian cancer tissue [17]. There are differences in glycolysis and β fatty acid oxidation related metabolites, such as carnitine, acetyl carnitine and butyryl carnitine [18]. In addition, compared with the ascites of non malignant disease, lysophospholipid metabolism in ascites in patients with ovarian cancer significantly increases [19]. The levels of serum phosphatidal ethanolamine, phosphatidylcholine, sphingomyelin and phosphatidylcholine acetal in ovarian cancer patients are different from those of normal people [20]. These results indicate that metabolism in ovarian cancer cells is significantly different from that of normal ovarian cell and the differences can be shown in carcinoma tissue, ascites and blood.
The chemical compositions of urine can well reflect the changes of specific tissue metabolism and ovarian cancer cell metabolic changes also are reflected by urine. Woo et al. have found 3 potential biomarkers in urine, named 1-methyladenosine, 3-methyluridine and 4-androstenes-3,17-diketone, all of which are metabolites highly related to DNA methylation [7]. Carolyn M. Slupsky et al. have identified 67 different metabolites, which are linked to tricarboxylic acid cycle, energy and amino acid metabolism [8]. Zhang et al. found 22 potential metabolic markers, which mainly are involved in nucleotide metabolism (pseudouridine, N-acetyl cytosine), histidine metabolism (L-histidine, Imidazole pyruvic acid), tryptophan metabolism and mucin metabolism (3’- saliva lactose, 3-sialic acid-N-acetyllactosamine). The contents of N-acetyl cytosine, pseudouridine, uric acid-3-nucleoside and succinic acid in urine of patients with ovarian cancer before and after surgery changed obvious [21]. Chen et al. found that pseudouridine, phytosphingosine, hippuric acid and homovanillic acid sulfate are the characteristics metabolite compositions of urine in ovarian cancer patients [22].
As mentioned above, a lot of metabolic markers of urine in patients with ovarian cancer have been identified using various means of metabonomics. Whether these markers can dynamically reflect the occurrence and development of ovarian cancer and the condition of ovarian cancer patients is still unclear. In this study, UPLC-Q-TOF-MS technique was applied to investigate the correlation between clinical staging and the constitution of urinary metabolites in patients with ovarian cancer. PCA and PLS-DA analysis of urinary metabolites showed that urine sample points of healthy people could obviously be distinguished from those of ovarian cancer patients in different clinical stages. The result indicated that healthy people were different from ovarian cancer patients at different clinical stages in urinary metabolites. By database retrieval and comparison, 8 kinds of metabolites with different metabolic states between healthy people and the patients with ovarian cancer were identified. The contents of these metabolites all increased in urine in patients with ovarian cancer. The eight metabolites were N-acetylneuraminic acid-9-phosphate, 5’-methioadenosine, uric acid-3-nucleoside, pseudouridine, L-valine, succinic acid, L-proline and β-nicotinamide mononucleotide.
Three kinds of the 8 metabolites named pseudouridine [21,22], succinic acid [21] and uric acid-3-nucleoside [21] have already been detected in previous studies and are considered as the potential markers of ovarian cancer. Pseudouridine and uric acid-3-nucleoside concentrations in urine of patients with ovarian cancer were higher than that of healthy people. This is related to the large amount RNA degradation and the catabolite nucleosides are excreted in urine [21,22]. This study showed that the content of succinic acid in urine of patients with ovarian cancer was higher than that in healthy people, which was consistent with the result of Zhang et al. [21]. Carolyn M. Slupsky et al., however, pointed out that the content of succinic acid of urine in patients with ovarian cancer was lower than that in healthy people [8]. As a result, the characteristics and significance of succinic acid changing in urine of patients with ovarian cancer remains further study. In this study, the other 5 compounds were newly identified metabolites different in patients with ovarian carcinoma from healthy people. In fact, some of the 5 metabolites were involved in some other tumor metabonomics studies. For example, 5’-methioadenosine was detected in the urine of patients with lymphoma by Li HY et al. [23]. The 5’-methioadenosine is a sulfur lipophilic adenosine metabolized by S-adenosylmethionine in spermine, spermidine and polyamine synthetic pathways. Increased 5’-methioadenosine content in urine of patients with cancer may be induced by increased arginine synthase activity [24]. Chen J et al. have found that proline concentration in urine of patients with hepatocellular carcinoma was higher than that of normal people [25]. Additionally, Qiu et al. have found the same result in patients with colorectal cancer [26]. Chen et al. found that valine content in colorectal cancer patients was higher than in normal people and they pointed out that the increased valine content was probably induced by the increased glycolysis [27]. N-acetylneuraminic acid-9-phosphate and β-nicotinamide mononucleotide related metabonomics study has not been reported. N-acetylneuraminic acid-9-phosphate is involved in the metabolism of amino sugars and it is a condensation of N-acetylmannosamine and phosphoenolpyruvate catalyzed by N-acetylneuraminic acid-9-phosphate synthase [28]. Increased content of N-acetylneuraminic acid-9-phosphate in urine of patients with ovarian cancer suggested glucose metabolism change in ovarian cancer cells. Nicotinamide nucleotide is an important intermediate product of intracellular nicotinamide adenine dinucleotide NAD+ [29] and NAD+ is an important redox cofactor which is involved in many metabolic processes in cells. In order to maintain rapid proliferation, NAD+ dependence of tumor cells is higher than that of normal cells [30]. Increased β-nicotinamide mononucleotide content in urine of patients with ovarian cancer indicates enhanced cell growth and metabolism and increased demand for NAD+.
Collectively, 8 kinds of metabolites in urine of healthy people and ovarian cancer patients at different clinical stages were at different levels. With the development of disease, the majority of them showed increasing trends, indicating that urinary metabolites were associated with ovarian cancer clinical staging. The increased trends of N-acetylneuraminic acid-9-phosphate and pseudouridine were typical and regular and the contents of them were significantly different between healthy people and patients with ovarian cancer at different clinical stages. As a result, these two metabolites might be potential makers in ovarian cancer screening and condition judgment at early stage of ovarian cancer.
Acknowledgements
This work was supported by National Natural Science Foundation of China Youth Science Foundation (81000146), Natural Science Foundation of Shandong Province (Y2007C016) and Science and Technology Development Project of Shandong Province (2009GG10002002).
Disclosure of conflict of interest
None.
References
- 1.Foley OW, Rauh-Hain JA, del Carmen MG. Recurrent epithelial ovarian cancer: an update on treatment. Oncology (Williston Park) 2013;27:288–94. 298. [PubMed] [Google Scholar]
- 2.Auersperg N. The origin of ovarian cancers-hypotheses and controversies. Front Biosci (Schol Ed) 2013;5:709–19. doi: 10.2741/s401. [DOI] [PubMed] [Google Scholar]
- 3.Saika K, Sobue T. Cancer statistics in the world. Gan To Kagaku Ryoho. 2013;40:2475–80. [PubMed] [Google Scholar]
- 4.Ge TT, Lou G. NMR and mass spectrometry techniques based metabolomics in ovarian cancer research. Pract Oncol J. 2013;27:206–10. [Google Scholar]
- 5.Cohen JC, White M, Cruz A, Farias-Eisner R. In 2014, can we do better than CA125 in the early detection of ovarian cancer? World J Biol Chem. 2014;5:286–300. doi: 10.4331/wjbc.v5.i3.286. [DOI] [PMC free article] [PubMed] [Google Scholar]
- 6.Baldwin LA, Huang B, Miller RW, Tucker T, Goodrich ST, Podzielinski I, DeSimone CP, Ueland FR, van Nagell JR, Seamon LG. Ten-year relative survival for epithelial ovarian cancer. Obstet Gynecol. 2012;120:612–8. doi: 10.1097/AOG.0b013e318264f794. [DOI] [PubMed] [Google Scholar]
- 7.Woo HM, Kim KM, Choi MH, Jung BH, Lee J, Kong G, Nam SJ, Kim S, Bai SW, Chung BC. Mass spectrometry based metabolomic approaches in urinary biomarker study of women’s cancers. Clin Chim Acta. 2009;400:63–9. doi: 10.1016/j.cca.2008.10.014. [DOI] [PubMed] [Google Scholar]
- 8.Slupsky CM, Steed H, Wells TH, Dabbs K, Schepansky A, Capstick V, Faught W, Sawyer MB. Urine metabolite analysis offers potential early diagnosis of ovarian and breast cancers. Clin Cancer Res. 2010;16:5835–41. doi: 10.1158/1078-0432.CCR-10-1434. [DOI] [PubMed] [Google Scholar]
- 9.Liang J. Application analysis of laparoscopic technique in ovarian cancer restaging operation. Guide of China Medicine. 2014;12:58. [Google Scholar]
- 10.Schorge JO, Eisenhauer EE, Chi DS. Current surgical management of ovarian cancer. Hematol Oncol Clin North Am. 2012;26:93–109. doi: 10.1016/j.hoc.2011.10.004. [DOI] [PubMed] [Google Scholar]
- 11.Chen XM, Zhang LW. Application of flight mass spectrometry in early gastrointestinal cancer research. Chinese Journal of Cancer Prevention and Treatment. 2012;19:154–6. [Google Scholar]
- 12.Zhou W, Zhou Y, Qi JY. Research advance of metabonomics in tumor markers of lung cancer. Chinese Journal of Cancer Prevention and Treatment. 2012;19:313–6. [Google Scholar]
- 13.Zhou YQ, Di W. Advances on ovarian cancer related metabolomics. Journal of International Obstetrics and Gynecology. 2012;39:356–9. [Google Scholar]
- 14.Roy D, Mondal S, Wang C, He XP, Khurana A, Giri S, Hoffmann R, Jung DB, Kim SH, Chini EN, Periera JC, Folmes CD, Mariani A, Dowdy SC, Bakkum-Gamez JN, Riska SM, Oberg AL, Karoly ED, Bell LN, Chien J, Shridhar V. Loss of HSulf-1 promotes altered lipid metabolism in ovarian cancer. Cancer Metab. 2014;2:13. doi: 10.1186/2049-3002-2-13. [DOI] [PMC free article] [PubMed] [Google Scholar]
- 15.Makowski L, Zhou CX, Zhong Y, Kuan PF, Fan C, Sampey BP, Difurio M, Bae-Jump VL. Obesity increases tumor aggressiveness in a genetically engineered mouse model of serous ovarian cancer. Gynecol Oncol. 2014;133:90–7. doi: 10.1016/j.ygyno.2013.12.026. [DOI] [PMC free article] [PubMed] [Google Scholar]
- 16.Poisson LM, Munkarah A, Madi H, Datta I, Hensley-Alford S, Tebbe C, Buekers T, Giri S, Rattan R. A metabolomic approach to identifying platinum resistance in ovarian cancer. J Ovarian Res. 2015;8:13. doi: 10.1186/s13048-015-0140-8. [DOI] [PMC free article] [PubMed] [Google Scholar]
- 17.Iorio E, Mezzanzanica D, Alberti P, Spadaro F, Ramoni C, D’Ascenzo S, Millimaggi D, Pavan A, Dolo V, Canevari S, Podo F. Alterations of choline phospholipid metabolism in ovarian tumor progression. Cancer Res. 2005;65:9369–76. doi: 10.1158/0008-5472.CAN-05-1146. [DOI] [PubMed] [Google Scholar]
- 18.Fong MY, McDunn J, Kakar SS. Identification of metabolites in the normal ovary and their transformation in primary and metastatic ovarian cancer. PLoS One. 2011;6:e19963. doi: 10.1371/journal.pone.0019963. [DOI] [PMC free article] [PubMed] [Google Scholar]
- 19.Xiao Y, Schwartz B, Washington M, Kennedy A, Webster K, Belinson J, Xu Y. Electrospray ionization mass spectrometry analysis of lysophospholipids in human ascitic fluids: comparison of the lysophospholipid contents in malignant vs nonmalignant ascitic fluids. Anal Biochem. 2001;290:302–13. doi: 10.1006/abio.2001.5000. [DOI] [PubMed] [Google Scholar]
- 20.Zhang T, Wu X, Yin M, Fan L, Zhang H, Zhao F, Zhang W, Ke C, Zhang G, Hou Y, Zhou X, Lou G, Li K. Discrimination between malignant and benign ovarian tumors by plasma metabolomic profiling using ultra performance liquid chromatography/mass spectrometry. Clin Chim Acta. 2012;413:861–8. doi: 10.1016/j.cca.2012.01.026. [DOI] [PubMed] [Google Scholar]
- 21.Zhang T, Wu X, Ke C, Yin M, Li Z, Fan L, Zhang W, Zhang H, Zhao F, Zhou X, Lou G, Li K. Identification of potential biomarkers for ovarian cancer by urinary metabolomic profiling. J Proteome Res. 2012;12:505–12. doi: 10.1021/pr3009572. [DOI] [PubMed] [Google Scholar]
- 22.Chen J, Zhou L, Zhang X, Lu X, Cao R, Xu C, Xu G. Urinary hydrophilic and hydrophobic metabolic profiling based on liquid chromatography-mass spectrometry methods: Differential metabolite discovery specific to ovarian cancer. Electrophoresis. 2012;33:3361–9. doi: 10.1002/elps.201200140. [DOI] [PubMed] [Google Scholar]
- 23.Li HY, Wang SM, Liu HM, Bu SS, Li J, Han D, Zhang MZ, Wu GY. Separation and identification of purine nucleosides in the urine of patients with malignant cancer by reverse phase liquid chromatography/electrospray tandem mass spectrometry. J Mass Spectrom. 2009;44:641–51. doi: 10.1002/jms.1539. [DOI] [PubMed] [Google Scholar]
- 24.Roe B, Kensicki E, Mohney R, Hall WW. Metabolomic profile of hepatitis C virus-infected hepatocytes. PLoS One. 2011;6:e23641. doi: 10.1371/journal.pone.0023641. [DOI] [PMC free article] [PubMed] [Google Scholar]
- 25.Chen J, Wang W, Lv S, Yin P, Zhao X, Lu X, Zhang F, Xu G. Metabonomics study of liver cancer based on ultra performance liquid chromatography coupled to mass spectrometry with HILIC and RPLC separations. Anal Chim Acta. 2009;650:3–9. doi: 10.1016/j.aca.2009.03.039. [DOI] [PubMed] [Google Scholar]
- 26.Qiu Y, Cai G, Su M, Chen T, Liu Y, Xu Y, Ni Y, Zhao A, Cai S, Xu LX, Jia W. Urinary metabonomic study on colorectal cancer. J Proteome Res. 2010;9:1627–34. doi: 10.1021/pr901081y. [DOI] [PubMed] [Google Scholar]
- 27.Chen JL, Fan J, Yan LS, Guo HQ, Xiong JJ, Ren Y, Hu JD. Urine metabolite profiling of human colorectal cancer by capillary electrophoresis mass spectrometry based on MRB. Gastroenterol Res Pract. 2012;2012:125890. doi: 10.1155/2012/125890. [DOI] [PMC free article] [PubMed] [Google Scholar]
- 28.Taniguchi N, Honke K, Fukuda M. N-Acetylneuraminic Acid Phosphatase (NANP) Tokyo: Springer-Verlag Press; 2014. Handbook of Glycosyltransferases and Related Genes. [Google Scholar]
- 29.Sheng FF, Ren X, Dai XP. Effect of nicotinamide mononucleotide on insulin secretion and gene expressions of PDX-1 and FoxO1 in RIN-n5f cells. Journal of Central South University (Medical Science) 2012;36:958–63. doi: 10.3969/j.issn.1672-7347.2011.10.005. [DOI] [PubMed] [Google Scholar]
- 30.Qin Y, Zhang RY, Mou ZY. Nicotinamide phosphoribosyltransferase inhibitors in cancer therapy: an advance. Academic Journal of Second Military Medical University. 2012;33:794–8. [Google Scholar]


