Abstract
To investigate the changes in the proportion of γδ T cells and Foxp3+ Treg cells in children with BA (biliary atresia). The distribution of γδ T cells in the liver tissues and the proportion of γδ T cells and Foxp3+ Treg cells were observed and detected in BA Group (32 cases) and control group (CG) (12 cases) by using immunohistochemical methods and flow cytometry. The periportal bile duct of liver in BA Group was surrounded by a large number of γδ T cells and a certain degree of Foxp3+ Treg cells infiltration. Additionally, the proportion of γδ T cells and Foxp3+ Treg cells was significantly higher than that in CG (P<0.05). And significantly negative correlation was revealed in the proportion of γδ T cells and Foxp3+ Treg cells (P<0.05). The increase of γδ T cells or inhibition of Foxp3+ Treg cell proliferation in liver tissues of patients with biliary atresia exacerbated the progressive inflammatory injury of bile ducts.
Keywords: Biliary atresia, γδ T cells, Treg cells
Introduction
Biliary atresia (BA) is a common cause of neonatal cholestasis. Recent studies have demonstrated that BA is closely related to abnormal immune responses triggered by the virus infection [1]. As the most important innate immune cells excluding NK (Natural Killer) cells and NKT (Natural Killer T) cells, the γδ T cells are a group of T cell subsets between the innate immunity and adaptive immunity, which play a key role in anti-infection, anti-autoimmune diseases and anti-tumors [2]. It is reported that the γδ T cells down-regulate the immune function through inhibiting Foxp3+ Treg cells so as to promote the activity of immune inflammatory cells and progressive development of the disease [3]. As to whether γδ T cells are abnormally distributed and correlated with Foxp3+ Treg cells in children with BA, no such report has been ever found. This study aims to make a preliminary study of the proportion of γδ T cells in periportal bile ducts of liver in children with BA as well as the changes in the proportion of γδ T cells and Foxp3+ Treg cells, so as to better understand the immune regulation mechanism of BA cells.
Materials and methods
Subjects
Among the 23 patients with Type III BA in BA Group, there were 18 females and 5 males, which had an average age of 2.5 months ranging from 2 to 5 months. Of the 12 cases of patients in CG Group, there were 8 females and 4 males, which had an average age of 3.2 months ranging from 1 to 14 months; there were 5 cases of neonatal hepatitis and 7 of congenital choledochal cyst. The 10 mm × 10 mm × 10 mm of hepatic lobe tissue specimens were harvested from all the patients in both groups during Kasai surgeries. The clinical data of the two groups are shown in Table 1. A part of specimens were made into sections for the purposes of immunohistochemical staining, and the other part was used for the isolation of lymphocytes in order to carry out the analysis of γδ T cells and Foxp3+ Treg cells by using flow cytometry. This study was approved by the Ethics Committee of the medical school.
Table 1.
Clinical characteristics of the patients in two groups
| BA (n = 23) | Choledochal Cyst (n = 7) | Neonatal Hepatitis (n = 5) | |
|---|---|---|---|
| Age (Month) | 2.91 ±3.03 | 5.27±3.32 | 3.54±2.82 |
| Weight (kg) | 5.5±1.3 | 7.2±2.8 | 6.2±4.6 |
| TB (2.0-20 μmol/l) | 218±54 | 69±23 | 195±72 |
| DB (0-4 μmol/l) | 156±31 | 49±21 | 141±46 |
| ALT (0-20 U) | 354±162 | 39±15 | 296±94 |
| GGT (0-50 U) | 351±154 | 73±26 | 298±123 |
Note: BA, biliary atresia; TB, total bilirubin; DB: direct bilirubin; ALP, alanine aminotransferase; GGT, gamma-glutamyl transferase.
Distribution of γδ T cells and Foxp3+ Treg cells in liver tissues
The liver tissues of BA Group and CG were collected and stained with immunohistochemistry after fixation, dehydration, embedding and production. Of two consecutive slices, the mouse anti-human Foxp3 antibody (1:100, Abcam, ab20034) was adopted in one slice to label Foxp3+ Treg cells; while, the rat anti-human TCR γδ antibody (1:200, Abcam, ab79056) was used in the other slice to label γδ T cells. Then, representative images were selected with a magnification of 200 × original images by using optical microscopy. Additionally, Image Pro plus software (version 5.01, Media Cybemetics, Silver Spring, USA) was employed to analyze the IOD (Integral Optical Density) and MOD (Mean Optical Density) of Foxp3+ Treg and γδ T cells displayed in the images of two groups so as to calculate the distribution and proportion of the two types of cells.
Separation of lymphocytes in the liver
Fresh liver tissues were cleaned with PBS (Phosphate Buffered Saline) and cut into pieces. And then the discontinuous Percoll density gradient centrifugation method was employed for lymphocytes acquisition in liver.
γδ T cell staining and flow cytometry assay
Two tubes of isolated lymphocytes were respectively taken from patients in BA Group and CG, each containing approximately 1 × 10⁶ lymphocytes. Of the two tubes from each patient in both groups, one was stained by flow antibodies including FITC-anti-CD4 mAb (Monoclonal Antibody), PE-anti-CD25 mAb and APC-anti-Foxp3 mAb, respectively, after stimulated by the stimulating agent; another was stained by flow antibodies including FITC-anti-CD3 mAb and PE-anti-TCR-γδ mAb. Mouse IgG2a-PE, IgG1-FITC and IgG2b-APC purchased from eBioscience were taken as the same type of fluorescent antibody so as to compare with all of the above samples. Staining was performed on the surface of the CD (Cluster of Differentiation) molecules before the membrane was broken and the intracellular cytokines were labeled. BD FACS Aria II flow cytometry was employed to perform flow cytometric measurement of the labeled cells so as to measure the proportion of CD4+CD25+Foxp3+ Treg and CD3+TCRγδ+ T cells in each tube. And then the flow cytometric data were analyzed by using FlowJo Software 7.6.1 (Tree Star, Inc., Stanford).
Statistical methods
SPSS 13.0 software was employed for statistical analysis. The measurement data were expressed by mean ± standard deviation (x±s). The correlation between γδ T cells and Foxp3+ Treg cells in patients in BA Group was analyzed by using t-test. P<0.05 indicated significant difference.
Results
Expression and distribution of γδ T cells in liver tissues
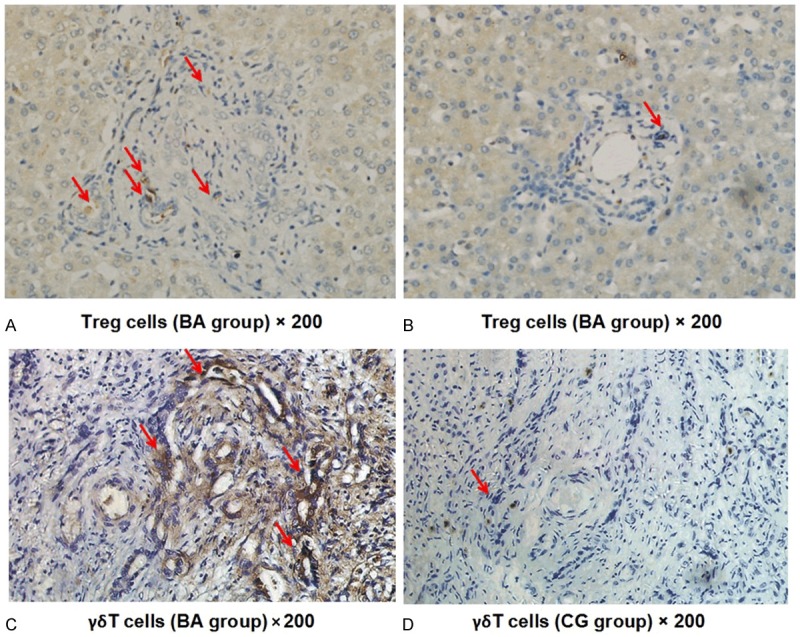
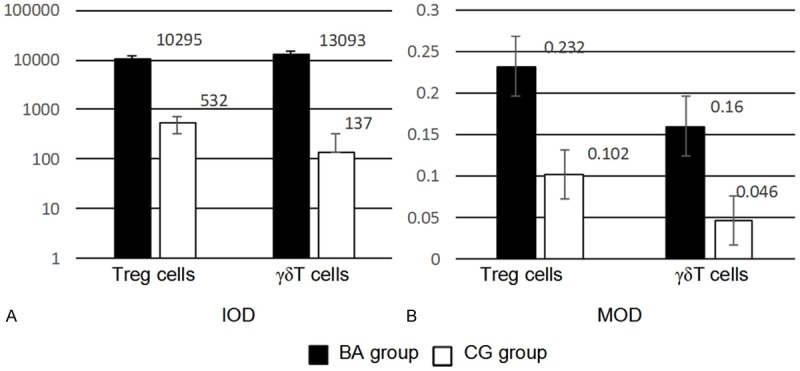
Immunohistochemistry demonstrated that the periportal bile duct of liver in BA Group was infiltrated by Foxp3+ Treg cells to a certain degree (Figure 1A) and a large number of γδ T cells (Figure 1C); while, lower Foxp3+ Treg cell expression (Figure 1B) and almost no γδ T cell expression (Figure 1D) were found in the periportal bile duct of liver in CG. According to the analysis of the images performed by using Image Pro Plus, the expressions of Foxp3+ Treg and γδ T cells in liver tissues of BA Group and CG were significantly different (Figure 2). The IOD analysis showed that the Treg and γδ T cells in BA Group were 10295±310 and 13093±290, respectively, compared to 532±72 and 137±50 in CG. The MOD analysis demonstrated that the Treg and γδ T cells in BA Group were 0.232±0.045 and 0.160±0.039, respectively, compared to 0.102±0.008 and 0.046±0.009 in BA. Additionally, as shown by the statistical analysis, the significantly differences were revealed in both the Treg (IOD: t = -30.414, P<0.001; MOD: t = 12.726, P<0.001) and γδ T cells (IOD: t = 196.974, P<0.001; MOD: t = 12.761, P<0.001) between BA Group and CG. The results also showed that the proportion of Foxp3+ Treg/γδ T cells was significantly decreased around the periportal bile duct of liver in BA Group (BA = 0.6±0.06; CG = 4.0±1.1, P = 0.004), indicating that unbalanced Foxp3+ Treg/γδ T cells might play a role in the pathogenesis of BA.
Figure 1.

Distribution of liver treg and γδ T cells in BA group and CG. A, C. Section of the Periportal Bile Duct of Liver in BA Group; B, D. Section of the Periportal Bile Duct of Liver in CG; Red Arrow: Treg cells; Red Triangle: γδ T Cells.
Figure 2.

Semi-quantitative analysis of immunohistochemistry.
Changes in the proportion of γδ T cells and Foxp3+ Treg in the liver tissues of the two groups
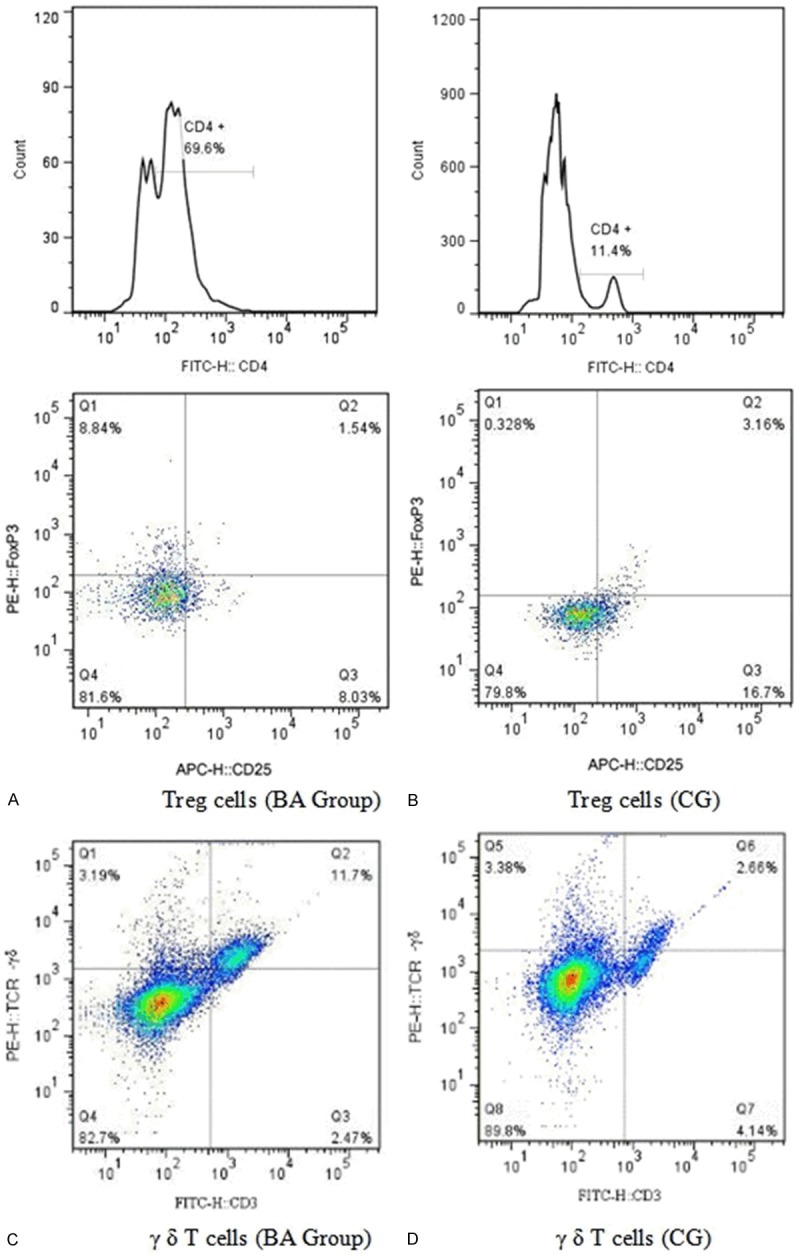
The results showed that the percentage of CD4+CD25+highFoxp3+ Treg in T cells in children with BA was significantly lower than that in CG (P<0.05) (Figure 3A, 3C); while the ratio of γδ T cells was significantly higher than that of CG (P<0.05) (Figure 3B, 3D and Table 2).
Figure 3.

Flow cytometric measurement of Treg and γδ T cells in the liver of BA group and CG.
Table 2.
Comparison between the proportion of Treg and γδ T cells in liver tissues in both groups
| Group | Number of Cases | Foxp3+ Treg cells (%) | γδ T cells (%) |
|---|---|---|---|
| BA Group | 23 | 1.7±0.32 | 10.3±1.3 |
| CG Group | 12 | 3.5±1.10 | 2.9±0.7 |
| T value | - | -7.503 | 22.729 |
| P value | - | <0.001 | <0.001 |
Correlation analysis between γδ T cells and Foxp3+ Treg cells in liver tissues in BA
As revealed by Pearson correlation analysis, in liver tissues in patients with BA, the proportion of γδ T cells was negatively correlated with that of Foxp3+ Treg cells (r = -0.842, P<0.5).
Discussion
According to this research, increased Foxp3+ Treg cells and obviously lower percentage of Foxp3+ Treg cells among T cells were found in the periportal bile duct in BA Group compared to CG, indicating more remarkable hyperplasia of the proinflammatory cytokine in BA such as CD4+ T cells, CD8+ T cells and NKT cells, consistent with the literature reports [4-6]. Foxp3+ Treg cells, especially CD4+CD25+Foxp3+ Treg cells, have a high degree of immune suppression functions, which play a central role in the maintenance of immune tolerance and immune homeostasis. Miethke and others [4] found in animal model studies that the lack of Foxp3+ Treg cells in three days before the birth of mouse inhibited the function loss of NK cells and contributed to NK cells hyper-activation and proliferation, resulting in the occurrence of BA. Lages et al. [6] also revealed in recent studies that adoption of Foxp3+ Treg cells to the BA mouse model in vivo can inhibit the activation of CD8+ cells dependent on DC cells (Dendritic Cells) so as to reduce the damage to the bile duct epithelium. According to our previous study, Foxp3+ Treg and Th17 cells were increased significantly in the periportal bile duct of BA; however, more remarkable increase of Th17 cells and significantly-decreased proportion of Treg/Th17 were seen, from which the conclusion that unbalanced proportion of Treg/Th17 played a role in BA progressive inflammation was drawn [7]. As can be concluded from studies stated hereinabove, undeveloped Foxp3+ Treg of the newborn has served as a key factor accounting for origination of BA in that window period. However, with progress of the diseases, Foxp3+ Treg cells surrounding the liver bile duct do not show the adaptive immune suppression function, indicating the existence of some factors that inhibit the proliferation or function of Foxp3+ Treg cells in the inflammatory progression stage of BA.
It was found that γδ T cells could not only recognize and kill target cells directly, but also secrete various cytokines to induce adaptive immunity [8]; and the activated γδ T cells could inhibit the proliferation and function of Foxp3+ Treg cells. Studies on mice with MS (multiple sclerosis) revealed that γδ T cells that expressed the interleukin 23 receptor could inhibit the proliferation and function of Foxp3+ Treg cells by using the dependent mechanism of the interleukin 23, thereby exacerbating the proliferation of effector T cells and causing the pathogenesis of MS [9]. In this study, we found obviously increased proportion of γδ T cells and relatively reduced proportion of Foxp3+ Treg cells in the periportal bile duct of the liver tissues in children with BA, suggesting relationship between the abnormal expressions of γδ T cells and Foxp3+ Treg cells and the pathogenesis and progression of BA. Further correlation analysis showed that the proportion of Foxp3+ Treg cells was negatively correlated with that of γδ T cells, suggesting that the γδ T cells may downregulate the immune regulation of the organism by inhibiting the proliferation of Foxp3+ Treg cells, thereby exacerbating the occurrence of bile duct inflammation in the liver and bile ducts.
T cells can be classified into αβ T cells (CD4+ and CD8+ cells) and γδ T cells according to four different peptide chains of antigen receptors including α, β, γ and δ. The γδ T cells are a group of T cell subsets which express the γδ chain of T cell antigen receptors and are abundant in their content [10] in the tissues, especially in epithelium. Previous studies have demonstrated that γδ T cells are the important sources of IFN-γ [11], which are also an important source of IL-17 and play a significant role in the antiviral infection and autoimmune diseases revealed by more and more evidences [12]. Although previous studies has shown that, IFN-γ and IL-17 secreted by αβ T cells are involved in the inflammatory injury of the intrahepatic and extrahepatic bile duct in BA, but the source of increased cytokines is not entirely clear. In this experiment, we found the significantly higher proportion of γδ T cells in liver tissues of patients with BA than that in CG, indicating that γδ T cells may also be involved in the immune inflammatory injury of BA bile ducts by secreting IFN-γ and IL-17. Although the absolute number of γδ T cells is much less than that of αβ T cells, it is found that they can initiate immune responses in the host body faster than αβ T cells and play an important role unmatched with their number by identification of TCR signals and pattern recognition of receptor signals. Next we will perform animal experiments to verify the mechanism of γδ T cells involving in BA bile duct injuries.
Acknowledgements
This work was supported by the National natural science foundation of China, NO. 81270481, Epigenic modifications induce pro-inflammatory Treg differention in the pathogenesis of biliary atresia.
Disclosure of conflict of interest
None.
References
- 1.Mack CL. The pathogenesis of biliary atresia: evidence for a virus-induced autoimmune disease. Semin Liver Dis. 2007;27:233–242. doi: 10.1055/s-2007-985068. [DOI] [PMC free article] [PubMed] [Google Scholar]
- 2.Kisielow J, Kopf M. The origin and fate of γδT cell subsets. Curr Opin Immunol. 2013;25:181–188. doi: 10.1016/j.coi.2013.03.002. [DOI] [PubMed] [Google Scholar]
- 3.Gong G, Shao L, Wang Y, Chen CY, Huang D, Yao S, Zhan X, Sicard H, Wang R, Chen ZW. Phosphoantigen-activated V gamma 2V delta 2 T cells antagonize IL-2-induced CD4+CD25+ Foxp3+T regulatory cells in mycobacterial infection. Blood. 2009;113:837–845. doi: 10.1182/blood-2008-06-162792. [DOI] [PMC free article] [PubMed] [Google Scholar]
- 4.Miethke AG, Saxena V, Shivakumar P, Sabla GE, Simmons J, Chougnet CA. Post-natal paucity of regulatory T cells and control of NK cell activation in experimental biliary atresia. J Hepatol. 2010;52:718–726. doi: 10.1016/j.jhep.2009.12.027. [DOI] [PMC free article] [PubMed] [Google Scholar]
- 5.Mack CL, Tucker RM, Sokol RJ, Karrer FM, Kotzin BL, Whitington PF, Miller SD. Biliary atresia is associated with CD4+ Th1 cell-mediated portal tract inflammation. Pediatr Res. 2004;56:79–87. doi: 10.1203/01.PDR.0000130480.51066.FB. [DOI] [PMC free article] [PubMed] [Google Scholar]
- 6.Lages CS, Simmons J, Chougnet CA, Miethke AG. Regulatory T cells control the CD8 adaptive immune response at the time of ductal obstruction in experimental biliary atresia. Hepatology. 2012;56:219–227. doi: 10.1002/hep.25662. [DOI] [PMC free article] [PubMed] [Google Scholar]
- 7.Yang Y, Liu YJ, Tang ST, Yang L, Yang J, Cao GQ, Zhang JH, Wang XX, Mao YZ. Elevated Th17 cells accompanied by decreased regulatory T cells and cytokine environment in infants with biliary atresia. Pediatr Surg Int. 2013;29:1249–1260. doi: 10.1007/s00383-013-3421-6. [DOI] [PubMed] [Google Scholar]
- 8.Kabelitz D, Peters C, Wesch D, Oberg HH. Regulatory functions of γδT cells. Int Immunopharmacol. 2013;16:382–387. doi: 10.1016/j.intimp.2013.01.022. [DOI] [PubMed] [Google Scholar]
- 9.Petermann F, Rothhammer V, Claussen MC, Haas JD, Blanco LR, Heink S, Prinz I, Hemmer B, Kuchroo VK, Oukka M, Korn T. γδT cells enhance autoimmunity by restraining regulatory T cell responses via an interleukin-23-dependent mechanism. Immunity. 2010;33:351–363. doi: 10.1016/j.immuni.2010.08.013. [DOI] [PMC free article] [PubMed] [Google Scholar]
- 10.Ma XH, Xiao L, Feng K. γδ T cells and biological characteristics of Progress. J Pract Med. 2013;29:3425–3426. [Google Scholar]
- 11.Kubota K. Innate IFN-γ production by subsets of natural killer cells, natural killer T cells and γδ T cells in response to dying bacterial-infected macrophages. Scand J Immunol. 2010;71:199–209. doi: 10.1111/j.1365-3083.2009.02366.x. [DOI] [PubMed] [Google Scholar]
- 12.Schirmer L, Rothhammer V, Hemmer B, Korn T. Enriched CD161 high CCR6+ γδT cells in the cerebrospinal fluid of patients with multiple sclerosis. JAMA Neurol. 2013;70:345–351. doi: 10.1001/2013.jamaneurol.409. [DOI] [PubMed] [Google Scholar]


