

Abstract
The aim of this study was to investigate the roles of PI3K/PKB/mTOR/S6K1 signaling pathway in the risk-increasing mechanisms of type 2 diabetes mellitus (T2DM) towards the Alzheimer’s disease (AD). Based on the high-sugar high-fat diet, the single intraperitoneal injection of streptozotocin was performed to induce the T2DM rat model; the immunohistochemistry and RT-PCR technique were then performed to detect the expression levels of mTOR, PI3K, PKB, S6K1 and phosphorylated Tau protein in the hippocampal tissues of each group. The related metabolic indicators of the T2DM group and the T2DM + AD group were significantly higher than the normal control group and the AD group (P<0.01); the Morris water maze test of the AD group and the learning and memory of the T2DM + AD group were than significantly decreased than the T2DM group (P<0.01); the T2DM + AD group exhibited significantly increased expression levels of mTOR, S6K1 and Tau protein in the hippocampal tissues than the AD group and the T2DM group (P<0.05), and while the expression levels of PI3K and PKB were decreased (P<0.05). Among the possible mechanisms through which T2DM increased the risk of AD, the dystransduction of insulin signaling pathway (PI3K/PKB/mTOR/S6K1) was the important cause of hyperphosphorylation of Tau protein, thus it prompted the AD occurrence.
Keywords: PI3K/PKB/mTOR/S6K1 signaling pathway, type 2 diabetes, Alzheimer’s disease
Introduction
The Alzheimer’s disease (AD) was a degenerative disease of central nervous system, with the progressive cognitive dysfunction and memory impairment as the characteristic. The epidemiological studies had confirmed that [1] the risk of type 2 diabetes mellitus (T2DM) patients getting AD was greatly higher than the non-diabetes patients, so some scholars had proposed AD as the “type 3 diabetes” [2]. The studies found [3,4] the glycolmetabolic disorders was closely linked with the AD pathogenesis. The biological research [5] had confirmed the impacts of insulin resistance (IR) towards the pathological changes of AD from the cellular and molecular levels, IR could affect the acetylcholine metabolism, promote the tau protein hyperphosphorylation, and mediate the PI3K/PKB/mTOR signaling pathway to involve into the mechanism regulation of Aβ metabolism, tau protein phosphorylation and neuronal apoptosis, thus affecting the cognitive functions, when the insulin signaling transduction occurred the disorder, it might trigger the characteristic pathological changes of AD. IR was the major pathogenesis of T2DM, thus it could be presumed that the insulin signaling pathway might be a bridge between T2DM and AD [6], among which PI3K/PKB/mTOR/S6K1 signaling pathway was the major pathway of insulin signaling transduction, the study found [7] that the PI3K/PKB/mTOR/S6K1 pathway played an important role in the growth and development of neurons, some neurodegenerative diseases such as AD, Parkinson’s disease and others existed the abnormality of mTOR pathway.
Through observing the behavioral science, histopathological features of hippocampal tissues and expressions of mTOR, PI3K, PKB, S6K1, total amount of phosphorylated Tau protein and mRNA among the T2DM group, the AD group and the T2DM + AD group, this study set the key regulatory protein mTOR of insulin signaling pathway as the starting point to explore the relationships of mTOR with the expressions of its upstream and downstream factors: PI3K, PKB and S6K1, or positive/negative regulation, as well as the AD-related biomarker tau protein and Aβ, aiming to explore the roles of PI3K/PKB/mTOR/S6K1 signaling pathway in the risk-increasing mechanism of T2DM towards AD.
Materials and methods
Subjects and grouping
The male SD rats, weighed 200-250 g of (provided by the Laboratory Animal Center, Jiangxi traditional Chinese medicine university), were fed one week for the adaptability, then the Morris water maze test was performed to test the abilities of spatial learning and memory of each rat, the qualified 50 rats were randomly divided into two groups: the normal control group (23 rats) and the T2DM group (27 rats). Based on the high-sugar high-fat diet, the single intraperitoneal injection of streptozotocin (STZ, 30 mg/kg, Sigma, USA) to establish the T2DM rat model, the blood glucose meter (Roche ACCU-CHEK blood glucose meter, Germany) was used to detect the fasting plasma glucose (FPG), and the successful modeling standard of T2DM was set as FPG≥16.7 mmol/L and IR; Aβ1-40 (Sigma, USA), with the condensed status and injected into the bilateral hippocampus with the stereotaxic instrument (RWD Lifescience Co., Ltd., Shenzhen China), was used to create the AD model, one week after the surgery, the Morris water maze test was performed, and the standard was set as 95% (the ceiling value) of the mean escaping-incubation period of the normal control group, the rats that exceeded this ceiling value were considered s successful model of AD. 4 weeks after the successful T2DM modeling, the T2DM + AD model was prepared based on the T2DM model.
After modeling, the normal control group were randomly divided into two groups: the normal control group (11 rats) and the AD group (12 rats). The T2DM group were randomly divided into two groups: the T2DM group (12 rats) and the T2DM + AD group (15 rats). This study was carried out in strict accordance with the recommendations in the Guide for the Care and Use of Laboratory Animals of the National Institutes of Health. The animal use protocol has been reviewed and approved by the Institutional Animal Care and Use Committee (IACUC) of Nanchang University.
Sampling
The rats were fasted overnight for 12 h, then intraperitoneally injected 10% chloral hydrate (3 mL/kg, Yulong Algae Co., Ltd., Qingdao, China) for the anesthesia, followed by the laparotomy and blood sampling from the inferior vena cava, the blood samples were immediately centrifuged at 4°C and 4000 r/min for 5 min, the separated serum was then placed into the -20°C refrigerator for the determination of glucose, insulin, total cholesterol and triglycerides. The rats were the decapitated, and the PBS solution was used to clean the blood, the bilateral hippocampal tissues were stripped out, with partial hippocampal tissues fixed with 4% neutral paraformaldehyde (Damao Chemical Reagent Factory, Tianjin, China) for the immunohistochemistry, and partial hippocampal tissues were immediately placed into the liquid nitrogen, then transferred into the -80°C refrigerator for RT-PCR.
Detection of observation indicators
The blood glucose was detected with glucose oxidase method, the automatic biochemical analyzer was used to determine the total cholesterol and triglycerides, and the radioimmunoassay was used to detect the insulin. The immunohistochemistry of hippocampal tissues used the SP method, and the hippocampal tissues were observed and photographed under the microscope, each slice was detected the numbers of positive cells and total cells within each vision field with the Image-Pro Plus v6.0 image analysis system (Media Cybernetics Co., LTd) at 400 magnification, then calculated the percentage of positive cells to total cells with each vision field, and the mean value was finally used. The RT-PCR detection was through the RNA extraction, determination of total RNA concentration and purity, reverse transcription, synthesis of gene primer sequences, PCR amplification and electrophoresis, then used the gel imaging analysis system to perform the absorbance integration scanning towards the bands, the ratio of target gene absorbance to the internal reference gene absorbance was then used to represent the relative expressions of target genes. Immunohistochemical examination of hippocampal tissues [8-11].
Preparation of paraffin section
The hippocampal tissues were taken and immediately placed into 4% paraformaldehyde for the fixation, then continued the alcohol-dehydration with alcohol (70%→80%→95%→100%) for several hours. The tissues were impregnated with xylene I and II for 0.5 hours, which called hyalinization, then wax dipping with paraffin at 60°C. Embedding the melt paraffin was poured into the embedding frame, then the tissue mass was placed inside. Slicing after fixing, the paraffin mass was sliced into 4-5 μm paraffin sections. Section development the paraffin section was placed into 40-43°C water, and developed flat. Section salvaging the glass slide was used to salvage the flat paraffin section from the water, and paved it onto the glass slide. Section baking the paraffin section was baked at 60°C for 1-3 h. After the section baking, the paraffin section was placed into the box and stored at the normal temperature.
Immunohistochemical SP method
The hippocampal tissues were dewaxed with xylene I and II for 20 minutes at 60°C, and dehydrated with gradient alcohol. Then it is deactivated of endogenous peroxidase: 3% H2O2 incubated at the room temperature and in the darkness 10 min, washed with PBS 3 times for 3 min each time. Antigen retrieval: placed in 0.01 M citric acid solution, boiled and naturally cooled down to the room temperature. Washed with PBS 3 times for 3 min each time. Closure: closed with the closure solution for 20 minutes. Added the primary antibody (1:100), the negative was added PBS, and incubated at 4°C overnight. Washed with PBS 5 times for 3 min each time. Added the biotin-labeled secondary antibody (Zhongshanjinqiao Co., Ltd, Beijing, China), incubated at 37°C for 30 min. Washed with PBS 5 times for 3 min each time. DAB staining: 30 μl DAB working solution, stained under the control of microscope for 3 min, then fully rinsed with the tap water. Hematoxylin restaining for 1 min. Conventional dehydration with gradient alcohol for 12 min. Hyalinization with xylene I and II for 5 min. The neutral gum was used for the closure, followed by the microscopic observation and photograph.
The hippocampal tissues of each rat were selected three sections, and randomly counted 4 non-overlapping vision of each section at 400 magnification, the Image-Pro Plus v6.0 image analysis system was used to measure the positive cell number and total cell number of each field, and calculated the ratio of positive cells to the total cells within the vision, the average was finally taken.
RT-PCR detection [8-11]
Tissue homogenate: 50 mg rat hippocampal tissues was placed into the glass grinder, added 1.0 ml Trizol solution, after ground, the tissues were poured into 1.5 ml EP tube, mixed and stood still at the room temperature for 5 min. Then isolation: each 1 ml Trizol was added 0.2 ml CHCl3 (with ratio as 1/5 (v/v)), then covered tightly and agitated violently for 15 sec, stood still at the room temperature for 3 min, then centrifuged at 4°C and 12000 rpm for 15 min. Precipitation of RNA: the upper layer (water phase, about 500 μl) was transferred into a new EP tube, and added the same volume of isopropanol, mixed and stood still at the room temperature for 20 min, followed by the centrifugation at 4°C and 12000 rpm for 10 min. Rinsing of RNA: after discarded the supernatant, 1 mL 75% ethanol was added to wash the RNA precipitant once, then centrifuged at 4°C and 5000 rpm for 5 min, discarded the supernatant, and the rest small amount of liquid was performed the short-time centrifugation, and sucked out by a micro-liquid transfer. Re-solving of RNA: the liquid was dried at the room temperature (about 2-3 min), then 50 μL RNA solution was added into the tube for the repeated mixing to fully dissolve RNA. The extracted RNA was stored at -80°C for the reverse transcription.
Determination of total RNA concentration and purity
1 μl RNA was taken and added into 99 μL RNase-free ddH2O for the centrifugation, the RNase-free ddH2O was used as the blank control, and the OD values at 230 nm, 260 nm and 280 nm were read by the ultraviolet/visible light spectrophotometer. Then the total RNA concentration, A260 nm/A230 nm ratio and A260 nm/A280 nm ratio were calculated, respectively. Among which, the total RNA concentration (μg/μl)=A260 nm×40×100/1000.
Procedure of reverse transcription
The following ingredients were added into the EP tube: Total RNA 1 μg and random hexamer primer 1 μl. Then RNase-free ddH2O was added to make the total volume to 12 μL, mixed and simply centrifuged, then bathed in 65°C water bath for 5 min, followed by the rapid cooling by the ice bath, then added: 5×Reaction Buffer 4 μl. RiboLockTM RNase inhibitor (20 U/μL) 1 μl, 10 mM dNTP mix 1 μl, RevertAidTM M-MuLV Reverse Transcriptase (200 U/μL) 1 μl. DEPC-treated water was added to make the total volume to 20 μl, mixed and simply centrifuged. Reaction conditions: 25°C for 5 min; 42°C for 60 min; 70°C for 5 min; then the cDNA products could be obtained, which was then stored at -20°C for the future use.
Synthesis of gene primer sequences
The primer sequences of target gene and internal gene were synthesized by Invitrogen, USA. PI3K primer: upstream 5’-TCC TGG AGA ACC TGG AAG AC-3’, downstream 5’-CTG GAG GAG TTT CGG TTG AT-3’, the amplified segment was about 379 bp; PKB primer: upstream 5’-GCC CAA CAC CTT CAT CAT-3’, downstream 5’-GGA CAC GGT TCT CAG TAA GC-3’, the amplified segment was about 398 bp; S6K1 primer: upstream 5’-ATG CTG CTT CTC GTC TTG G-3’ downstream 5’-CCT GGT TGG CAC TTT CAC T-3’, the amplified segment was about 228 bp; mTOR primer: upstream 5’-ATG ACG AGA CCC AGG CTA AG-3’, downstream 5’-GCC AGT CCT CTA CAA TAC GC-3’, the amplified segment was about 387 bp.
Tau protein primer: upstream 5’-CGG CGT AAG CAA AGA CA-3’, downstream 5’-TGT AGC CGC TTC GTT CT-3’, the amplified segment was about 215 bp; GAPDH primer: upstream 5’-CCT CTG GAA AGC TGT GGC GT-3’, downstream 5’-TTG GAG GCC ATG TAG GCC AT-3’, the amplified segment was about 430 bp.
Preparation of stock solution (concentration: 100 nmol/L) was prepared according to the primer instructions, 10 μL stock solution was added into 90 μL ddH2O, which formed the needed PCR primer working solution (concentration was 10 nmol/L).
PCR amplification
The following ingredients were added into the EP tube: cDNA 1 μl, upstream primer 1 μl, downstream primer 1 μl, 2×MasterMix 10 μl, ddH2O total volume 20 μl. After mixed and simply centrifuged, the mixture was pre-denatured at 94°C for 5 min, then performed the PCR amplification for 35 cycles under the following conditions: degeneration at 94°C for 30 S, reannealing at 60°C for 30 S, extension at 72°C for 30 S. End-extension at 72°C for 10 min, and the electrophoresis was performed as soon as the reaction was over.
Electrophoresis
1% agarose gel was prepared (with TAE buffer), then added 5 μl samples and standards, respectively, followed by the electrophoresis at the voltage as 3-4 V/cm. The electrophoresis solution was the TAE buffer. The electrophoresis was performed until the bromphenol blue migrated to 3/4 of the gel downstream. When the electrophoresis was finished, the results were taken the pictures under the ultraviolet. The gel imaging analysis system was used to scan the absorbance integrity of each band, the relative expression strength of target gene was expressed by the ratio of target gene absorbance to the internal standard gene absorbance.
Statistical analysis
The SPSS13.0 statistical software was used to analyze the results, the measurement data were expressed as the mean ± standard deviation (x̅±s). The single factor analysis of variance was used to compare the intergroup difference. When the difference was statistically significant, the SNK-q test was used to perform the pairwise comparison, with P<0.05 considered as the statistical significance.
Results
General information
Compared with the normal control group and the AD group, the levels of FPG, glycated hemoglobin, insulin, total cholesterol and triglyceride of the T2DM group and the T2DM + AD group were significantly increased (P<0.01), while there was no statistical significance between the normal control group and the AD group (P>0.05), the levels in the T2DM + AD group were higher than the T2DM group, and the differences were statistically significant (P<0.05, Table 1).
Table 1.
Comparison of biochemical markers of each group (x̅±s)
| Group | N | FBG (mmol/L) | TG (mmol/L) | TC (mmol/L) | HbA1C (%) | Insulin (IU/L) | HOMA-IR |
|---|---|---|---|---|---|---|---|
| Normal control | 11 | 4.85±0.49 | 0.75±0.06 | 1.06±0.13 | 4.34±0.26 | 9.01±2.15 | 1.94±1.45 |
| T2DM | 10 | 22.57±2.90● | 1.47±0.10● | 2.47±0.06● | 4.34±0.26 | 20.45±1.87● | 18.70±3.46● |
| AD | 9 | 5.06±0.66▲▲ | 0.71±0.08▲▲ | 1.01±0.08▲▲ | 5.71±0.08▲▲ | 18.61±1.91▲▲ | 4.19±2.23▲▲ |
| T2DM + AD | 9 | 24.53±2.21●,▲,▼ | 1.57±0.12●,▲,▼ | 2.57±0.13●,▲,▼ | 12.47±0.32●,▲ | 26.57±2.12●,▲,▼ | 30.14±2.56●,▲,▼ |
Note: Compared with the normal control group;
P<0.01.
Compared with the T2DM group;
P<0.05.
Compared with the T2DM group;
P<0.01.
Compared with the AD group;
P<0.01.
IR index: the IR index of homeostasis model was used, HOMA-IR=FINs (IU/L) ×FPG (mmol/L)/22.5.
Comparison of learning and memory (Morris water maze test)
In the Morris water maze test, compared with the normal control group and the T2DM group, the times that rats of the AD group and the T2DM + AD group crossed the former platform were significantly reduced (P<0.01), and the difference was statistically significant (P<0.01), the difference between the AD group and the T2DM + AD group was statistically significant (P<0.05, Table 2).
Table 2.
Times that rats of each group crossed the former platform within 120 s (x̅±s)
| Group | N | Times that rats crossed the former platform within 120 s |
|---|---|---|
| Normal control | 11 | 11.91±1.81 |
| T2DM | 10 | 7.10±0.99● |
| AD | 9 | 3.00±0.71●,▲ |
| T2DM + AD | 9 | 1.78±0.83●,▲,▼ |
Note: Compared with the normal control group;
P<0.01.
Compared with the T2DM group;
P<0.01.
Compared with the AD group;
P<0.05.
Immunohistochemical results
The nerve cells near the injection point of hippocampal region of each group all exhibited that the cytoplasm had the positive cells of tan mTOR, S6K1 and hyperphosphorylated Tau protein, and these three indicators had no statistical significance when compared with the normal control group and the AD group (P>0.05), while the difference between the T2DM group and the T2DM + AD group was statistically significant (P<0.01). Compared with the control group and the AD group, the expression levels of mTOR in the hippocampal tissues of the T2DM group and the T2DM + AD group were higher (P<0.05), and S6K1 was significantly higher (P<0.01). When compared with the normal control group and the T2DM group, the positive cells of Tau protein of the AD group and the T2DM + AD group were significantly increased (P<0.01).
Compared with the normal control group, the AD group and the T2DM group, the expression levels of PI3K and PKB in the hippocampal tissues of the T2DM + AD group were reduced (P<0.01); compared with the normal control group and the AD group, the expression levels of PI3K and PKB in the hippocampal tissues of the T2DM group were reduced (P<0.01); compared with the normal control group, the expression levels of PI3K and PKB in the hippocampal tissues of the AD group were reduced (P<0.05, Figure 1; Table 3).
Figure 1.
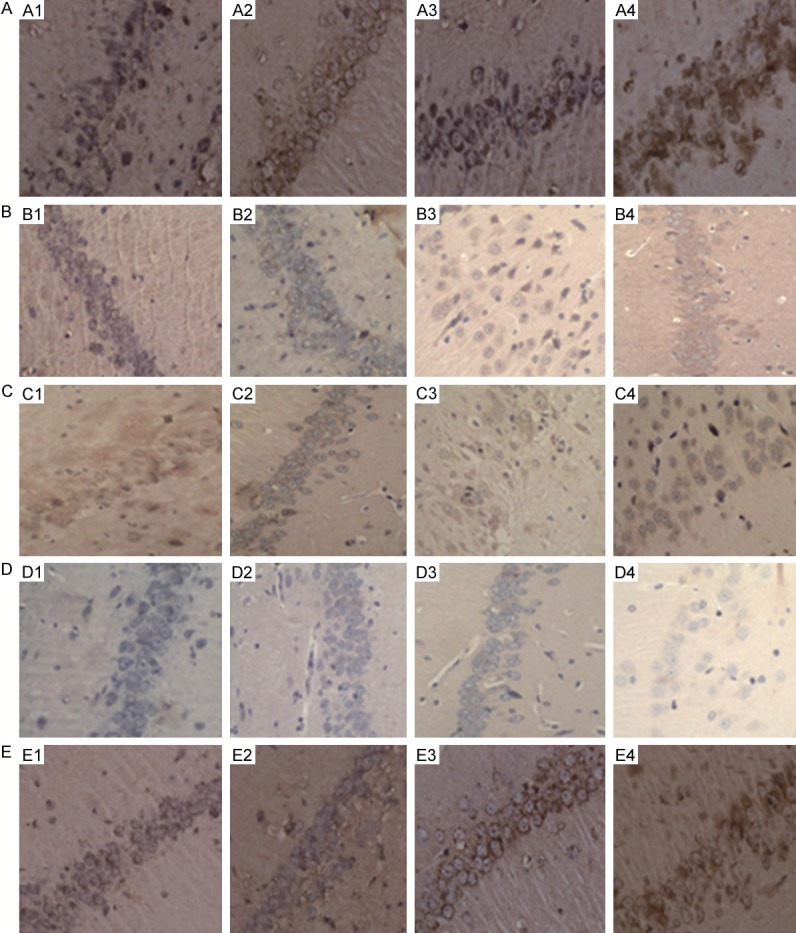
Expressions of mTOR protein, PI3K protein, S6K1 protein, PKB protein, phosphorylated Tau protein in the hippocampal tissues of each group envision×400. A1-A4: mTOR protein; B1-B4: PI3K protein; C1-C4: S6K1 protein; D1-D4: PKB protein; E1-E4: Phosphorylated Tau protein. A1, B1, C1, D1, E1: Normal group; A2, B2, C2, D2, E2: T2DM group; A3, B3, C3, D3, E3: AD group; A4, B4, C4, D4, E4: AD + T2DM group.
Table 3.
Comparison of mTOR expression in the hippocampal tissues among three groups (x̅±s)
| Group | N | mTOR | S6K1 | PI3K | PKB | Phosphorylated Tau protein |
|---|---|---|---|---|---|---|
| Normal control | 11 | 0.27±0.04 | 0.49±0.0017 | 0.444±0.0763 | 0.261±0.0195 | 0.14±0.05 |
| T2DM | 10 | 0.49±0.12● | 0.472±0.0002◆,★ | 0.235±0.0265◆,▼ | 0.130±0.0099◆,▼ | 0.22±0.14 |
| AD | 9 | 0.21±0.05▲ | 0.521±0.0009◆,▼ | 0.360±0.0377●,▲ | 0.159±0.0115◆,★ | 0.57±0.06◆,★ |
| T2DM + AD | 9 | 0.62±0.07●,◆,▼ | 0.556±0.0002◆,▼,★ | 0.127±0.0173◆,▼,★ | 0.089±0.0162◆,▼,★ | 0.73±0.08◆,★,▼ |
Note: Compared with the normal control group;
P<0.05.
Compared with the normal control group;
P<0.01.
Compared with the AD group;
P<0.01.
Compared with the T2DM group;
P<0.05.
Compared with the T2DM group;
P<0.01.
Gene expression
Compared with the normal control group and the AD group, the expressions of mTOR mRNA and S6K1 mRNA in the hippocampal tissues of the T2DM group and the T2DM + AD group were significantly increased (P<0.05), the expression level of Tau protein mRNA was significantly enhanced (P<0.01), the comparison of these three indicators between the normal control group and the AD group was not statistically significant (P>0.05), while those of mTOR and Tau protein mRNA of the T2DM group was statistically significantly different from the T2DM + AD group (P<0.01), and that of S6K1 mRNA of the T2DM group was statistically significantly different from the T2DM + AD group (P<0.05).
Compared with normal control group, the AD group and the T2DM group, the PI3K mRNA expression in the hippocampal region of the T2DM + AD was decreased (P<0.05), and that of PKB mRNA was significantly decreased (P<0.01), and the differences of these two indicators between the normal control group and the AD group were significant (P<0.05), among which there existed statistical significance in PI3K mRNA between the T2DM group and the T2DM + AD group (P<0.05). But PKB mRNA was not statistically significant between the AD group and the T2DM group (P>0.05), there was statistically significant difference between the T2DM group and the T2DM + AD group (P<0.01, Figure 2; Table 4).
Figure 2.
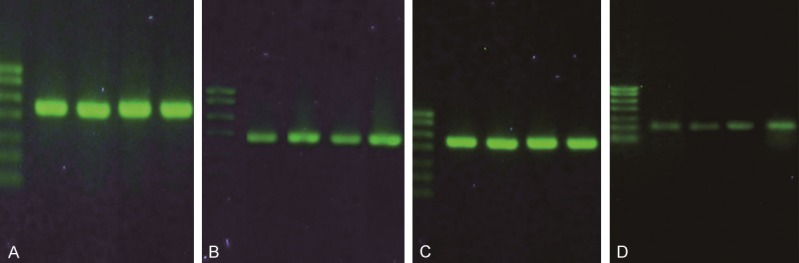
Expressions of mTOR gene and total Tau protein gene in each group. A: GAPDH (430 bp); B: mTOR (387 bp); C: GAPDH (430 bp); D: Tau (215 bp). Note: Bands from left to right: Marker, normal control group, T2DM group, AD group and T2DM + AD group. Markers from top to bottom: 700 bp, 600 bp, 500 bp, 400 bp, 300 bp, 200 bp, 100 bp.
Table 4.
Comparison of gene expressions in the hippocampal regions among the group (x̅±s)
| Group | N | mTOR mRNA | PI3K | Total Tau protein mRNA | PKB | S6K1 |
|---|---|---|---|---|---|---|
| Normal control | 11 | 0.62±0.07 | 0.396±0.0336 | 0.18±0.02 | 0.158±0.0111 | 0.49±0.0017 |
| T2DM | 10 | 0.71±0.12● | 0.342±0.0309◆,▼ | 0.22±0.06 | 0.130±0.0097● | 0.472±0.0002▲ |
| AD | 9 | 0.61±0.10▲ | 0.373±0.0221◆,▲ | 0.36±0.09◆,▲▲ | 0.138±0.0067● | 0.521±0.0009●,▼ |
| T2DM + AD | 9 | 0.88±0.05●,▲▲,▼ | 0.310±0.0240◆,▼,▲ | 0.54±0.05◆,▲▲,★ | 0.089±0.0162▼,▲▲,◆ | 0.556±0.0002●,▼,▲ |
Note: Compared with the normal control group;
P<0.05.
Compared with the normal control group;
P<0.01.
Compared with the AD group;
P<0.05.
Compared with the AD group;
P<0.01.
Compared with the T2DM group;
P<0.05.
Compared with the T2DM group;
P<0.01.
Discussion
The studies had shown that [12,13] T2DM had the co-existence risk with AD, the diabetes was the independent risk factor for the cognitive impairment, which could increase the risk of AD, besides the high blood sugar, the pathogenesis of diabetes-induced AD was also associated with IR and insulin signal transduction abnormality. The PI3K/PKB/mTOR/S6K1 was the key signaling pathway of insulin in regulating the glucose metabolism, among which the mammalian target of rapamycin (mTOR) was the central part of insulin signaling pathway, and an effector protein in the downstream of PI3K/PKB signaling pathway, playing the key roles of regulating the cell metabolism, growth and proliferation, and it could also feedback-regulate the insulin sensitivity and maintain the β-cell functions [14]. S6K1 was the downstream regulator of mTOR in the insulin signaling pathway, mTOR adjusted the activity of S6K1 in its downstream, thus negatively feedback-inhibiting this pathway. When the body had the excessive nutrients (long-term high blood sugar, high cholesterol, obesity, etc.), the overexpression of mTOR/S6K1, in the downstream of this pathway, would be activated, thus inhibiting the insulin signal transmission, seriously interfering with the insulin signal transduction, inducing the body to produce IR. The in vitro study [15] demonstrated that the inhibition of mTOR could improve IR.
Among the pathological changes of AD, the hyperphosphorylated Tau protein initiated the occurrence and development of AD, and was the critical event of AD pathogenic process [16]. In the drosophila model, Khurana et al. [17] found that the highly phosphorylated tau protein could induce the activation of mTOR, thus further activated the cell cycle regulator, and eventually led to the death of neurons, the occurrence of AD was accompanied by the enhanced activities of mTOR/S6K1 pathway, so that the overall pathological process of AD was accompanied with the increased expression levels of neurotoxic Tau protein. An et al. [18] found that after treated with the high concentration of Zn2+, the hippocampal neurons exhibited the phosphorylation and activation of S6K1, resulting in the increased phosphorylation levels of intracellular Tau protein. This suggested that mTOR and S6K1 might be the kinases that led to the hyperphosphorylation of Tau protein. In this experiment, the expressions of mTOR, S6K1 and phosphorylated Tau protein in the hippocampal tissues of the T2DM + AD group were significantly increased than the normal control group, suggesting that the excessive activation of mTOR and S6K1 in the brain might promote the abnormal phosphorylation of Tau protein, thus leading to the occurrence of AD.
In order to explore the roles of PI3K/PKB/mTOR/S6K1 signal transduction pathway disorder in the pathogenesis of T2DM-increased AD, this study established the T2DM + AD rat model, studied the possible mechanisms of increased AD risk because of the T2DM concurrence.
The experiment showed that [19] the T2DM animal model established by the high-sugar high-fat diet + intraperitoneal injection of small dose of STZ exhibited the features of IR and relatively deficient secretion of insulin, which was similar to the pathogenesis of human T2DM, and this modeling approach had been very mature, and was the most commonly used method when establishing an animal T2DM model. Therefore, this study used this method to establish the rat T2DM model. In this experiment, FPG of the T2DM group and the T2DM + AD group were greater than 16.7 mmol/L, and kept steady, showed no “self-healing” phenomenon, which meant that the T2DM model was successfully established.
The study found [20] that under the cerebral stereotaxis, the one-step injection of Condensed Aβ1-40 in to the hippocampal region could better simulate the pathological features of AD such as SP, gliosis and partial neuronal damages, thus resulting in the modeled animals exhibited such AD symptoms as learning and memory disorders. In this study, we reviewed extensive literatures, and referred to the AD modeling method of Arnal et al. [21]. In this experiment, the results of Morris water maze test showed that the mean escape latency of the AD group and the T2DM + AD group was significantly longer than the normal control group, and the times of crossing the former platform were significantly reduced than the control group, the rats exhibited the significant disorders of memory and cognitive functions, indicating that the AD modeling was successful.
In this study, the immunohistochemistry and RT-PCR methods were performed to detect the expression levels of mTOR and its upstream and downstream factors (PI3K, PKB and S6K1) in the hippocampal tissues of each group from the protein and molecular levels. The results showed that: compared with the normal control group, the expression levels of mTOR and S6K1 of the T2DM group were significantly increased, while those of PI3K and PKB were decreased because of the feedback inhibition, indicating that T2DM might result in the increased activities of mTOR in the brain through the disorders of PI3K/PKB/mTOR/S6K1 pathway conduction, thus inducing the intracerabral IR. Compared with the T2DM model group, the expression levels of mTOR and S6K1 in the hippocampal tissues of the T2DM + AD group were significantly increased, while the expression levels of PI3K and PKB were decreased because of the feedback inhibition, indicating that T2DM could induce the excessive activation of mTOR/S6K1 inside the cerebral tissues, aggravated the intracerabral IR, thus inducing the occurrence of AD.
Through the immunohistochemistry method, this experiment detected the amount of hyperphosphorylated Tau protein in the hippocampal tissues of each group, and used the RT-PCR method to detect the amount of total Tau protein. The results showed that compared with the normal control group, the AD group and the T2DM group, the expression levels of hyperphosphorylated Tau protein and total Tau protein in the hippocampal tissues of the T2DM + AD group were significantly increased, indicating that T2DM could activate the activities of mTOR and S6K1 in the hippocampal tissues, thus aggravated the hyperphosphorylation degrees of Tau protein, and increased the severity of AD. Compared with the normal control group, the expressions of phosphorylated Tau protein in the hippocampal tissues of the T2DM group had no significant difference, which might because the time of T2DM modeling was short, or the mTOR activity was not increased enough to cause the hyperphosphorylation of Tau protein, and the specific reasons were still being further studied.
In the possible mechanisms of T2DM-increased risk of AD, the disorder of insulin signal transduction pathway was an important cause that led to the hyperphosphorylation of Tau protein, among which mTOR was the key regulator protein of this pathway, T2DM would lead to the excessive activation of mTOR and S6K1 through the insulin signal transduction disorder, insulin resistance, hyperinsulinism, which would then feedback-inhibit the expression of PI3K and PKB, the excessive activation of mTOR/S6K1 would lead to the increasing of abnormal phosphorylation of Tau protein in the AD rats, thus prompting the occurrence of AD. The abnormality of IR-related P13K/PKB/mTOR/S6K1 signal transduction pathway was the important reason that resulted in the increased risk of T2DM patients towards AD. through exploring the relationships of IR, T2DM and AD, it was found that the mTOR inhibitors could be expected to be the new effective therapeutic targets to reduce the AD risk of T2DM patients.
Acknowledgements
This study was supported by the National Natural Science Foundation of China (No. 81041046).
Disclosure of conflict of interest
None.
References
- 1.Zhu XY, Niu BF, Dong ZX, Huang HY. Studies of the relationship between type 2 diabetes and Alzheimer’s disease. Med Rev. 2011;17:1528–1531. [Google Scholar]
- 2.Chen YJ, Tian JZ. Alzheimer’s disease is another form of diabetes. Chin J Gerontology. 2008;28:402–406. [Google Scholar]
- 3.Li Y. The awareness of the relationship between central insulin resistance and Alzheimer’s disease. J Diagn Pract. 2009;8:248–251. [Google Scholar]
- 4.Yuan SH, Gao SZ, Liu XP, Hou L, Xu S, Wang MX, Dong CF. The change of cognitive function in insulin resistance rats and its brain tissues with Alzheimer-Like disease. Stroke Nerv Dis. 2010;17:139–143. [Google Scholar]
- 5.Moroz N, Tong M, Longato L, Xu H, de la Monte SM. Limited Alzheimer-type neurodegeneration in experimental obesity and type 2 diabetes mellitus. J Alzheimers Dis. 2008;15:29–44. doi: 10.3233/jad-2008-15103. [DOI] [PMC free article] [PubMed] [Google Scholar]
- 6.Leibowitz G, Cerasi E, Ketzinel-Gilad M. The role of mTOR in the adaptation and failure of beta-cells in type 2 diabetes. Diabetes Obes Metab. 2008;10:157–169. doi: 10.1111/j.1463-1326.2008.00952.x. [DOI] [PubMed] [Google Scholar]
- 7.Wang S, Wu J, Nie SD, Bereczki E, Pei JJ. Dysregulated mTOR-dependent signaling in neurodegeneration or carcinogenesis: implication for Alzheimer’s disease and brain tumors. J Alzheimers Dis. 2013;37:495–505. doi: 10.3233/JAD-130641. [DOI] [PubMed] [Google Scholar]
- 8.Ma YQ, Wu DK, Liu JK. mTOR and tau phosphorylated proteins in the hippocampal tissue of rats with type 2 diabetes and Alzheimer’s disease rats. Mol Med Rep. 2013;7:623–627. doi: 10.3892/mmr.2012.1186. [DOI] [PubMed] [Google Scholar]
- 9.Ahmed T, Van der Jeugd A, Blum D, Galas MC, D’Hooge R, Buee L, Balschun D. Cognition and hippocampal synaptic plasticity in mice with a homozygous tau deletion. Neurobiol Aging. 2014;35:2474–2478. doi: 10.1016/j.neurobiolaging.2014.05.005. [DOI] [PubMed] [Google Scholar]
- 10.Schiavon AP, Soares LM, Bonato JM, Milani H, Guimarães FS, Weffort de Oliveira RM. Protective effects of cannabidiol against hippocampal cell death and cognitive impairment induced by bilateral common carotid artery occlusion in mice. Neurotox Res. 2014;26:307–316. doi: 10.1007/s12640-014-9457-0. [DOI] [PubMed] [Google Scholar]
- 11.Wang W, Yang L, Tan L, Wu X, Jiang B, Shen X. Arg972 insulin receptor substrate-1 polymorphism and risk and severity of Alzheimer’s disease. J Clin Neurosci. 2014;21:1233–1237. doi: 10.1016/j.jocn.2013.09.028. [DOI] [PubMed] [Google Scholar]
- 12.Kamal MA. Editorial: Current updates on association between Alzheimer’ s diseaseand type 2 diabetes mellitus--volume II. CNS Neurol Disord Drug Targets. 2014;13:377–382. doi: 10.2174/18715273113126660165. [DOI] [PubMed] [Google Scholar]
- 13.Fan H. The research progress of risk-related between diabetes and Alzheimer’s disease. J Practical Geriatrics. 2010;24:342–345. [Google Scholar]
- 14.Glynn EL, Lujan HL, Kramer VJ, Drummond MJ, DiCarlo SE, Rasmussen BB. A chronic increase in physical activity inhibits fed-state mTOR/S6K1 signaling and reduces IRS-1 serine phosphorylation in rat skeletal muscle. Appl Physiol Nutr Metab. 2008;33:93–101. doi: 10.1139/h07-149. [DOI] [PMC free article] [PubMed] [Google Scholar]
- 15.Vila-Bedmar R, Lorenzo M, Fernández-Veledo S. Adenosine 5’-monophosphate-activated protein kinase-mammalian target of rapamycin cross talk regulates brown adipocyte differ-entiation. Endocrinology. 2010;151:980–992. doi: 10.1210/en.2009-0810. [DOI] [PubMed] [Google Scholar]
- 16.Grammas P, Tripathy D, Sanchez A, Yin X, Luo J. Brain microvasculature and hypoxia-related proteins in Alzheimerr’s disease. Int J Clin Exp Pathol. 2011;4:616–627. [PMC free article] [PubMed] [Google Scholar]
- 17.Khurana V, Lu Y, Steinhilb ML, Oldham S, Shulman JM, Feany MB. TOR-mediated cell-cyele activation causes neurodegeneration in a Drosophila tauopathy model. Curr Biol. 2006;16:230–241. doi: 10.1016/j.cub.2005.12.042. [DOI] [PubMed] [Google Scholar]
- 18.An WL, Cowburn RF, Li L, Braak H, Alafuzoff I, Iqbal K, Iqbal IG, Winblad B, Pei JJ. Up-regulation of phosphorylated/activated p70 S6 kinase and its relationship to neurofibrillary pathology in Alzheimer’s disease. Am J Pathol. 2003;163:591–607. doi: 10.1016/S0002-9440(10)63687-5. [DOI] [PMC free article] [PubMed] [Google Scholar]
- 19.Hisayama M, Oka S, Leon J, Ninomiya T, Honda H, Sasaki K, Iwaki T, Ohara T, Sasaki T, LaFerla FM, Kiyohara Y, Nakabeppu Y. Altered expression of diabetes-related genes in Alzheimer’s disease brains: The Hisayama Study. Cerebral Cortex. 2014;24:2476–2488. doi: 10.1093/cercor/bht101. [DOI] [PMC free article] [PubMed] [Google Scholar]
- 20.Passos GF, Figueiredo CP, Prediger RD, Silva KA, Siqueira JM, Duarte FS, Leal PC, Medeiros R, Calixto JB. Involvement of phosphoinositide 3-kinase [gamma] in the neuro-inflammatory response and cognitive impairments induced by [beta] -amyloid l-40 peptide in mice. Brain Behav Immun. 2010;24:493–501. doi: 10.1016/j.bbi.2009.12.003. [DOI] [PubMed] [Google Scholar]
- 21.Arnal N, Morel GR, de Alaniz MJ, Castillo O, Marra CA. Role of copper and cholesterol association in the neurodegenerative process. Int J Alzheimers Dis. 2013;2013:411817. doi: 10.1155/2013/414817. [DOI] [PMC free article] [PubMed] [Google Scholar]