

Abstract
To choose the best ultrasound scoring system for clinic practice, ultrasound was performed for 94 cases with suspected primary Sjogren’s syndrome (pSS) and 3 US scoring systems created by Hocevar, Salaffi, Millic were employd to assess for bilateral parotid glands and submandibular glands. The US evaluation was blinded to the final diagnosis of pSS according to 2002 classification criteria. 44 cases were finally diagnosed with pSS, 14 were diagnosed with secondary Sjogren’s syndrome, and 36 were diagnosed with Sicca syndromes. Hocevar’s method had the best likelihood ratio and accuracy, but Milic’s scoring system was recommended for its excellent balance between the diagnostic value and inter/intra observation agreement value.
Keywords: Ultrosonography, Sjogren’s syndrome, US scoring systems, parotid glands, submandibular glands, diagnosis
Introduction
Sjogren’s syndrome (SS) is the second most common chronic systemic autoimmune disease and is characterized by autoimmune responses directed primarily against exocrine glands [1]. The key clinical manifestation of pSS is dysfunction of the lacrimal and salivary glands, thus leading to symptoms of kerato-conjunctivitis sicca and xerostomia [2]. Many sets of criteria for diagnosing SS have been proposed in the past few decades. In spite of classification criteria proposed by the American-European Consensus group (AECG) in 2002 [4], the evaluation of salivary glands involvement in pSS is still a matter of debate. Besides standard tests, namely the unstimulated salivary flow test, salivary gland scintigraphy and sialography, other invasive methods have been studied (ultrasonography, magnetic resonance imaging, computed tomography) [5,6]. Among them, ultrasonography (US) of the major salivary glands seems the most attractive as a non-invasive, inexpensive and non-irritating investigation.
Several studies have evaluated the role of salivary gland US in diagnosing SS [7-11]. Thought all evidences confirmed that ultrosonography (US) on parotid glands and submandibular glands had quite equivalent sensitivity and specificity to other examinations of major salivary glands, comparisons between different studies is rather difficult due to the different diagnostic criteria and different inclusion and exclusion criteria of patients in different studies [12-17].
The purpose of this corss-sectional study was to compare the invalidity and accuracy of pSS diagnosis elevated by 3 representative US scoring systems including the most complicated one-Hocevar’s, the simpliest one-Milic’s and the classical one-Salaffi’s method [15-17], It was expected to to find out the best assessment for pSS diagnosis by US according to the 2002 AECG criteria.
Method
Patients
94 subjects diagnosed with Sjogren’s syndrome were successfully enrolled in in-patient department of Rheumatology, the 3rd Affiliated Hospital of Sun Yet-Sen Univeristy in 2003-2005. The suspicion was based on the patient’s history, clinical or laboratory data. Exclusion criteria were: a history of hepatitis C, HIV, sarcoidoosis sarcoidosis, previous head and neck radiation therapy, surgery of salivary glands and treatment with antidepressants, parasympatholytic drugs, or other drugs that may affect salivary gland function. Patients who had been treated during last 12 months or with other drugs known potentially to that might cause a reduction in salivary and lacrimal secretions during last 12 months were not included in the study. All subjects gave their informed consent and the study was approved by the institutional review boards for human research.
Clinical assessment
6 questions to assess both ocular and oral involvement were given to each patient. Information on disease duration, comorbidities, related treatment and drug history were collected at the same time. All patients underwent salivary gland biopsy, ultrasonography, and scintigraphy, Schirmer-I test, rose Bengal socre determination, and serological tests. If necessary, unstimulated salivary flow test test was carried out until 4 of 6 American-European Consensus group classfiction criteria for SS had been shown to be negative or until SS was diagnosed. The patients were diagnosed as primary SS according to AECG classification criteria of 2002. The remaining subjects with sicca symptoms who did not meet AECG criteria for SS or with the diagnosis of secondary SS were grouped as non-pSS control.
Labial salivary gland (LSG) biopsy samples were observed in 4 mm2 of salivary gland, the score was rated from 0 to 4 according to the semi quantitative scoring method of Chisholm and Mason (18). Grade 3 or 4 was defined as a pathological finding with a focus score ≥1 (the focus score is defined as more than 50 lymphocytes per 4 mm2 of tissue).
Antinuclear antibodies were assessed by immunofluorescence on Hep-2 cell lines (Euroimmum, China). ANA >1:160 were considered to be positive. Anti-Ro/SSA and anti-La/SSB antibodies were tested by immunoblotting (YHLO Biotech, China).
Salivary gland scintigraphy was performed with 370MBq radio-active technetium-99m (Tc99m) pertechnetate and images were obtained immediately after the accumulation phase. A 30-min dynamic study with 60 seconds per frame was carried out. Stimulation with vitamin C was performed 15 min later, after that the secretory phase was carried out for 15 min. The uptake index (UI) and the excretion fractions (EF) of four major salivary glands (submandibular and parotid glands) were calculated and the criteria comprised three stages: (1) Stage 0 (normal)-rapid uptake, progressive increase in concentration and prompt excretion into the oral cavity after stimuli; (2) Stage 1 (moderate)-decreased uptake and concentration and slow excretion into the oral cavity after stimuli; (3) Stage 2 (severe)-markedly decreased uptake and concentration and absence of excretion into the oral cavity by 15 min. Stage 1 or more were considered abnormal.
Ultrasonographic examination
US examination of parotid and submandibular salivary glands was performed simultaneously with the SS diagnostic procedure. Greyscale images were obtained using a Philip HD9 Ultasound System with a 5-12 MHz linear array transducer. Each patient was scanned in the supine position with the neck hyperextended and the head to the opposite side. The parotid glands were examined in both axial and coronal planes while the submandibular glands only examined in coronal one. Above 3 US scoring systems were employd and the relative variables were investigated and the observed parameters were assessed semiquantitaively for both paried glands for each participant [15-17]. Parenchymal echogenicity was compared to adjacent masseter muscle. The Final scores would be calculated independently by 2 experienced rheumatologists with the same US training course and more than 2-year muscloskeletal US experience. An US expert (more than 5-year experience in the muscloskeletal US field in US department) was employed to make the final decision once the 2 observers gained different scores. All of them were blinded to the diagnosis.
In terms of the evaluation of US features, the inter-observer validity of parenchymal echogenicity, homogeneity, hypoechogenic, hyperechogenic reflections, and border clearness were determined between one of the observers and the US expert by comparing the 60 pictures of 10 patients in random sequence. Intra-observer validity was assessed by rescoring the images in the same subset 2 months after the original US assessment.
Statistical analysis
Data was submitted for statistical analysis using SPSS (version17.0 for mac). Parametric techniques were applicable for certain ordinal level data, and non-parametric techniques were for the data which was not normally distributed (Kolmogorov-Smirnov test for normal distribution). Where appropriate, median and interquartile ranges are given, as well as mean and S.D. Inter-observer reliablility was determined by the unweighted κ-statistics. Discriminant validity was assessed by ROC curve analysis to compare the ability of US to discriminate between pSS and non-pSS patients, in comparison with different salivary gland US scoring systems. ROC curves were plotted for each model to determine the area under the curve (AUC) and the sensitivity, specificity, positive likelihood ratio (LR) and accuracy. The AUC was used to evaluate the diagnostic performance of the systems.
Results
Clinical features
44 patients were classified as pSS, 14 as secondary SS (sSS) and 36 as non-SS. The non-pSS control group included sSS and non-SS patients. The diseases of non-pSS patients are listed in Table 1.
Table 1.
The diagnosis and classification of control groups (unit: case)
| Secondary SS | Rheumatic arthritis | 5 |
| Systemic lupus erythematosus | 5 | |
| Systemic lupus Erythematosus overlapping with Rheumatic arthritis | 2 | |
| Rheumatic arthritis overlapping with polymyoitis | 1 | |
| Systemic sclerosis | 1 | |
| Non-SS | IgG4 related disease | 2 |
| Systemic lupus erythematosus | 7 | |
| Rheumatic disease | 7 | |
| Askylosing spondylitis | 1 | |
| Undifferent connective disease | 5 | |
| Mutiple connective disease | 2 | |
| Autoimmune hepatitis | 1 | |
| Primary biliary cirrhosis | 1 | |
| Antiphospholipid syndrome | 1 | |
| Diabetes mellitus and gout | 1 | |
| Xerostomia | 3 | |
| Xerophthalmia | 1 | |
| Osteoporosis | 1 | |
| Osteoarthritis | 3 |
Table 2 summarizes the main characteristics of the cohorts, including the diagnostic procedures used to verify the diagnosis of SS. Among the patients with pSS, 39 patients (88.6%) had positive LSG biopsy results, whereas 30 (83.3%) in non-SS had negative LSG biopsy results. The exceptions in control group were 2 patients with IgG4 related disease judged as Grade IV distinguished by large number of IgG4 positvie cells infiltration. Almost all the sSS are rated as Grade I and II (12/14, 85.7%), except 2 sSS secondary cases who had no xerostomia, xerophthalmia, and negative eye exmanination.
Table 2.
Main characteristics of patients
| Primary SS | Controls | ||
|---|---|---|---|
|
| |||
| Secondary SS | Non-SS | ||
| No. femal/male | 38/6 | 14/0 | 30/6 |
| Mean age ± S.D, years | 46.3±13.1 | 50.5±16.1 | 44.5±16.1 |
| Age range, years | 21-82 | 18-77 | 24-70 |
| Ocular symdrones | 26 (59.1%) | 11 (78.6%) | 16 (44.4%) |
| Oral syndromes | 36 (86.4%) | 9 (64.3%) | 26 (72.2%) |
| Keratoconjunctivitis sicca* | 22 (52.3%) | 10 (71.4%) | 5 (13.9%) |
| Histopathology of minor salivary gland biopsy# | |||
| Negative | 0 | 0 | 30 (83.3%) |
| Grades I and II | 5 (11.4%) | 12 (85.7%) | 4 (11.1%) |
| Grade III | 26 (59.1%) | 2 (14.3%) | 0 |
| Grade IV | 13 (29.5%) | 0 | 2 (5.6%) |
| Anti-Ro or anti-La antibodies or both | 28 (63.6%) | 7 (50.0%) | 8 (22.2%) |
n.d, not deteminedValues given as n (%) of patients.
Quantitative Rose Bengal score of Schirmer’s test.
Determined by focus score >1.
Inter-observer validity in imaging assessment
The inter-observer reliability showed an overall agreement of 86%, 90%, 89%, 82% and 77% for the presence/absence of parenchymal echogenicity, homogeneity, hypoechogenic, hyperechogenic relfections and border clearness, with k-values of 0.862, 0.892, 0.847, 0.823, 0.798. There was a great agreement between the inter-observer and intra-observer in staging of the disease by 3 US scoring systems (Hoceva’s, Salaffi’s, Millic’s) with k-values of 0.791, 0.808, 0.823 and 0.858, 0.872, 0.883.
Analysis of US features of major salivary glands by different scoring systems
Structural changes in salivary glands recorded in US were found in 38/44 (92.7%) pSS patients, in 11/14 (78.6%) sSS patients, and in 22/36 (61.1%) with non-SS. The diagnostic value of inhomogeneity, hypoechogeneity zone and hyperechogenic inflection the major salivary glands were shown in Table 3. We detect inhomogeneity had the highest sensitivity and second highest specificity ratios in patients with pSS respectively.
Table 3.
Diagnostic accuracy of US features of the major salivary glands in patinets with pSS
| Sensitivity (%)/specificity (%) | ||
|---|---|---|
|
|
||
| Abnormal US feature | Parotid glands | Submandibular glands |
| Echogeneity | 83/60 | 82/66 |
| Inhomogeneity | 93/81 | 94/82 |
| Hypoechogenic zone | 78/80 | 78/80 |
| hyperechogenic relfections | 87/82 | 72/96 |
| Posterior border | 68/96 | n.a |
The AUC-ROC for each method (Hocevar’s, Salaffi’s, Millic’s) was satisfied as 0.888±0.036 (95% CI 0.816, 0.959), 0.851±0.041 (95% CI 0.771, 0.931), 0.866±0.038 (95% CI 0.790, 0.941) respectively compared to 0.092±0.031 for labial biopsy (Figure 1). The cut-off scores proved to be the same as previous studies indicated. As indicated above, Hocevar’s mathod is of the best accruacy (Table 4).
Figure 1.
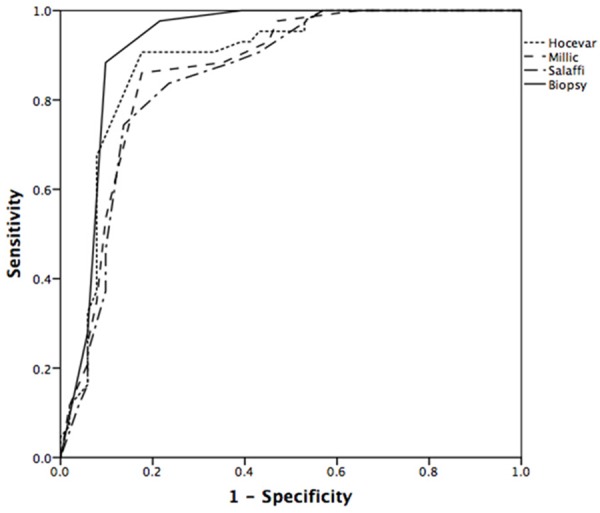
ROC curves for the performance of the scores by scoring systems and labial biopsy in discriminating between patients with primary SS and non-pSS controls.
Table 4.
Diagnostic accuracy of US features of the major salivary glands in patients with pSS according to each US scoring systems and labial biopsy
| Scoring systems | Sensitivity/specificity (%) | AUC-ROC ± S.E | Likelihood Ratio | Accuracy |
|---|---|---|---|---|
| Hocevar et al | 91/92 | 0.888±0.036 | 10 | 0.86 |
| Salaffi et al | 80/78 | 0.851±0.041 | 3.8 | 0.79 |
| Millic et al | 86/84 | 0.866±0.038 | 6.3 | 0.85 |
| Labial biopsy | 89/92 | 0.092±0.031 | 7.8 | 0.90 |
Discussion
In comparison with the other diagnostic method such as CT and MRI, US scoring systems testified the considerable diagnostic value with sensitivity and specificity ranging from 43% to 90% and from 84% to 100%, respectively [7,9,15,17,19]. It is widely discussed that which system we should apply for clinic use. De Vita et al proposed an echographic score (0-6), which represents a sum of single scores for each pair of parotid and submandibular glands, with a sensitivity of 88.8% and a specificity of 84.6% [7]. Wernicke et al reported that US evident parenchymal inhomogeneity in at least two major salivary glands showed a specificity of 96.1% and a sensitivity of 63% [19]. However, Hocevar et al investigated several US variables and proposed a novel US scoring system (0-48) with a sensitivity of 58.8% and a specificity of 98.7% [15], while a US scoring system (0-16) by Salaffi et al a showed sensitivity of 90.0% and a specificity of 53.3% for primary SS [9]. Milic et al recommended the efficient US scoring system (0-12) with a sensitivity of 90% and a specificity of 95% [17]. At last, Theander et al presented a simplified Sallaffi’s scoring system (0-12) with sensitivity of 98% and a specificity of 52% last year [20]. These variable results varies with each other due to (1) the application of different classification criteria sets for SS; (2) different scoring systems for salivary gland morphological changes; (3) US scanning transducers with different resolutions; (4) inadequate objectivity in assessing US images; (5) different inclusion and exclusion criteria in different studies. Hocevar’s, Salaffi’s and Millic’s scoring system were selected in our study because all the representative scoring systems included the scores for bilateral paritod and submedicular glands. In terms of evaluation technics, Hocevar’s method assessed all US features of pSS while Salaffi’s system focused on the major 2 features and Millic inherited De Vita, Wernicke’s methods with a focus on most typical feature. In terms of study-level analysis, health control were included in Millic’s study but not in Salaffi’s and Hocevar’s. Salaffi’s study required the patients with sicca symtoms but Hocevar’s has included the SS patients without sicca symtoms. The inclusion criteria of Hocevar’s was adopted in our study for it is more closer to the actual clinical circumstance for our another unpublished multicentric Considering the occult onset, we believed the suspected ones without sicca symptoms should be embodied in our trial. 6 of 12 (50%) patients without sicca symptoms were verified as pSS as a result. It seemed US might be helpful for early diagnosis of pSS, however, Theander’s study found low sensitivity in early pSS with their scoring system. Therefore, more research should be required in future.
200 patients were expected to be recruited for the trial but only less than half were successfully enrolled in last 2 years due to self-supported monocentric research, limited personnel resource, and low ratio of recruitment for invasive labial biopsy. However, the data was still quiet convinced. Our results were as equal as Hocevar’s and Salaffi’s though low accuracy than Millic’s. The reason might be the fact that the health group was not included in the control group. Parenchymal inhomogeneity showed the sensitivity to specificity ratio of 93/81 for parotid and 94/82 for submandibular glands in the case of primary SS patients, which is in good accordance with the study of Milic et al [17] and De Vita et al [7]. As indicated in Milic’s study, parenchymal inhomogeneity was frequently found in patients with SS, with a lower sensitivity to specificity ratio (81.5/88.5) than in our study. AUC-ROC for all the scoring systems came within the range of high diagnostic accuracy, and specificity and sensitivity. Milic’s US scoring system was recommended to be used in practical work on account of the best inter-observer validity due to the single observation indicator.
It is noteworthy that two cases of IgG4 related disease patients were rated as high scores for diagnosis of pSS by all three US scoring systems. It’s no surprise the errors because the disease was taken as pSS for several years until 2005 [21]. Recently some research claimed that US feature of IgG4 related disease was unique with small data set [22]. During our follow-up for IgG4 related patients, we found the most prominent feature was the shrunken size and speed of parotid gland during glucocorticoid therapy, but there is no significant distinction between these two diseases in proposed US scoring systems. Therefore, we emphasized the importance of distinguishing labial IgG4 staining from pSS, US could not substitute for labial biopsy. But on the other hand, US might be included new 2012 ACR classification for its improved sensitivity from 64.4% to 84.4% [24].
Conclusion
In conclusion, we confirmed the diagnostic value of three representative US scoring systems for pSS and recommended the application of Milic’s scoring system in daily clinic practice. However, its role in early diagnosis of pSS should be further studied.
Disclosure of conflict of interest
None.
References
- 1.Fox RI, Stern M, Michelson P. Update in Sjogren’s syndrome. Curr Opin Rheumatol. 2000;12:391–398. doi: 10.1097/00002281-200009000-00007. [DOI] [PubMed] [Google Scholar]
- 2.Jonson R, Haga HJ, Gordon TP. Current concepts on diagnosis,autoantibodies and therapy in Sjoegren’s syndrome. Scand J Rheumatol. 2000;29:341–348. doi: 10.1080/030097400447525. [DOI] [PubMed] [Google Scholar]
- 3.Moutsopoulos HM. Sjögren’s syndrome: autoimmune epithelitis. Clin Immunol Immunopathol. 1994;72:162–165. doi: 10.1006/clin.1994.1123. [DOI] [PubMed] [Google Scholar]
- 4.Vitali C, Bombardieri S, Jonsson R, Moutsopoulos HM, Alexander EL, Carsons SE, Daniels TE, Fox PC, Fox RI, Kassan SS, Pillemer SR, Talal N, Weisman MH European Study Group on Classification Criteria for Sjögren’s Syndrome. Classification criteria for Sjogren’s syndrome: a revised version of the European criteria proposed by the American–European Consensus Group. Ann Rheum Dis. 2002;61:554–558. doi: 10.1136/ard.61.6.554. [DOI] [PMC free article] [PubMed] [Google Scholar]
- 5.Niemelä RK, Takalo R, Pääkkö E, Suramo I, Päivänsalo M, Salo T, Hakala M. Ultrasonography of salivary glands in primary Sjögren’s syndrome. A comparison with magnetic resonance imaging and magnetic resonance sialography of parotid glands. Rheumatology (Oxford) 2004;43:875–879. doi: 10.1093/rheumatology/keh187. [DOI] [PubMed] [Google Scholar]
- 6.Tonami H, Matoba M, Yokota H, Higashi K, Yamamoto I, Sugai S. CT and MR findings of bilateral lacrimal gland enlargement in Sjögren syndrome. Clin Imaging. 2002;26:392–396. doi: 10.1016/s0899-7071(02)00455-2. [DOI] [PubMed] [Google Scholar]
- 7.DeVita S, Lorenzon G, Rossi G, Sabella M, Fossaluzza V. Salivary gland echography in primary and secondary Sjögren’s syndrome. Clin Exp Rheumatol. 1992;10:351–356. [PubMed] [Google Scholar]
- 8.Makula E, Pokorny G, Rajtar M, Kiss I, Kovacs A, Kovacs L. Parotid gland ultrasonography as a diagnostic tool in primary Sjogren’s syndrome. Br J Rheumatol. 1996;35:972–977. doi: 10.1093/rheumatology/35.10.972. [DOI] [PubMed] [Google Scholar]
- 9.Salaffi F, Argalia G, Carotti M, Giannini FB, Palombi C. Salivary gland ultrasonography in the evaluation of primary Sjögren’s syndrome. Comparison with minor salivary gland biopsy. J Rheumatol. 2000;27:1229–1236. [PubMed] [Google Scholar]
- 10.Yonetsu K, Takagi Y, Sumi M, Nakamura T. Sonography as a replacement for sialography for the diagnosis of salivary glands affected by Sjögren’s syndrome. Ann Rheum Dis. 2002;61:276–286. doi: 10.1136/ard.61.3.276. [DOI] [PMC free article] [PubMed] [Google Scholar]
- 11.Mandel L, Orchowski YS. Using ultrasonography to diagnose Sjögren’s syndrome. J Am Dent Assoc. 1998;129:1129–1133. doi: 10.14219/jada.archive.1998.0388. [DOI] [PubMed] [Google Scholar]
- 12.Ariji Y, Ohki M, Eguchi K, Izumi M, Ariji E, Mizokami A, Nagataki S, Nakamura T. Texture analysis of sonographic features of the parotid gland in Sjögren’s syndrome. Am J Roentgenol. 1996;166:935–941. doi: 10.2214/ajr.166.4.8610577. [DOI] [PubMed] [Google Scholar]
- 13.Takashima S, Morimoto S, Tomiyama N, Takeuchi N, Ikezoe J, Kozuka T. Sjogren syndrome: comparison of sialography and ultrasonography. J Clin Ultrasound. 1992;20:99–109. doi: 10.1002/jcu.1870200203. [DOI] [PubMed] [Google Scholar]
- 14.Ahuja AT, Metreweli C. Ultrasound features of Sjögren’s syndrome. Australas Radiol. 1996;40:10–14. doi: 10.1111/j.1440-1673.1996.tb00336.x. [DOI] [PubMed] [Google Scholar]
- 15.Hocevar A, Ambrozic A, Rozman B, Kveder T, Tomsic M. Ultrasonographic changes of major salivary glands in primary Sjögren’s syndrome. Diagnostic value of a novel scoring system. J Rheumatol. 2005;44:768–772. doi: 10.1093/rheumatology/keh588. [DOI] [PubMed] [Google Scholar]
- 16.Salaffi F, Carotti M, Iagnocco A, Luccioli F, Ramonda R, Luccioli F, Ramonda R, Sabatini E, De Nicola M, Maggi M, Priori R, Valesini G, Gerli R, Punzi L, Giuseppetti GM, Salvolini U, Grassi W. Ultrasonography of salivary glands in primary Sjögren’s syndrome: a comparison with contrast sialography and scintigraphy. J Rheumatol. 2008;47:1244–1249. doi: 10.1093/rheumatology/ken222. [DOI] [PubMed] [Google Scholar]
- 17.VD Millic, RR Petrovic, IV Boricic, Radunovic GL, Pejnovic NN, Soldatovic I, Damjanov NS. Major salivary gland sonography in Sjögren’s syndrome: diagnositc value of a novel ultrasonography score (0-12) for parenchymal inhomogeneity. Scand J Rheumatol. 2010;39:165. doi: 10.3109/03009740903270623. [DOI] [PubMed] [Google Scholar]
- 18.Chisholm DM, Mason DK. Labial salivary gland biopsy in Sjögren’s syndrome. J Clin Pathol. 1968;21:656–660. doi: 10.1136/jcp.21.5.656. [DOI] [PMC free article] [PubMed] [Google Scholar]
- 19.Wernicke D, Hess H, Gromnica-Ihle E, Krause A, Schmidt A. Ultrasonography of salivary glands: A highly specific imaging procedure for diagnosis of Sjogren’s syndrome. J Rheumatol. 2008;35:285–293. [PubMed] [Google Scholar]
- 20.Theander E, Mandl T. Primary Sjogren’s syndrome: diagnostic and prognostic value of salivary gland ultrasonography using a simplified scoring system. Arthritis Care Res (Hoboken) 2014;66:1102–1107. doi: 10.1002/acr.22264. [DOI] [PubMed] [Google Scholar]
- 21.Yamamoto M, Suzuki C, Naishiro Y, Yamamoto H, Takahashi H, Imai K. Clinical and pathological differences between Mikulicz’s disease and Sjogren’s syndrome. Rheumatology (Oxford) 2005;44:227–234. doi: 10.1093/rheumatology/keh447. [DOI] [PubMed] [Google Scholar]
- 22.Lin Q, Li JL, Wang J, Zhang SX, Liu C, Cao XL. The value of ultrasound in diagnosis of IgG4-related sialadenitis. Shanghai Kou Qiang Yi Xue. 2014;23:744–748. [PubMed] [Google Scholar]
- 23.Takagi Y, Iwamoto N, Horai Y, Kawakami A, Nakamura T. Ultrasonography as an additional item in the American College of Rheumatology classification of Sjogren’s syndrome. Rheumatology (Oxford) 2014;53:1977–83. doi: 10.1093/rheumatology/keu238. [DOI] [PubMed] [Google Scholar]
- 24.Cornec D, Jousse-Joulin S, Marhadour T, Pers JO, Boisramé-Gastrin S, Renaudineau Y, Saraux A, Devauchelle-Pensec V. Salivary gland ultrasonography improves the diagnostic performance of the 2012 American College of Rheumatology classification criteria for Sjogren’s syndrome. Rheumatology (Oxford) 2014;53:1604–1607. doi: 10.1093/rheumatology/keu037. [DOI] [PubMed] [Google Scholar]