Abstract
The objective of this work is to prepare and evaluate Poly (D, L-Lactide-co-glycolide) (PLGA) Nanoparticles (NPs) of Capecitabine, an anticancer agent loaded by solvent displacement method using stabilizer (poly vinyl alcohol). The prepared NPs were characterized by FT-IR, DSC, drug loading, entrapment efficiency, particle size, surface morphology by Atomic force microscopy (AFM), X-ray diffraction and in-vitro studies. FT-IR and DSC studies indicated that there was no interaction between the drug and polymer. The morphological studies performed by AFM showed uniform and spherical shaped discrete particles without aggregation and smooth in surface morphology with a nano size range of 144 nm. X-ray diffraction was performed to reveal the crystalline nature of the drug after encapsulation. The NPs formed were spherical in shape with zeta potentials (-14.8 mV). In vitro release studies were carried and showed drug release up to 5 days. The drug release followed zero order kinetics and a Fickian transport mechanism. Nanoparticles obtained a high encapsulation efficiency of 88.4% and drug loading of 16.98%. Drug released from Capecitabine loaded PLGA NPs (84.1%) was for 5 days. It is concluded from the present investigation that PLGA NPs of Capecitabine may effectively deliver the drug to the prostate for the treatment of prostate cancer.
Keywords: Nanoparticles, PLGA, capecitabine, prostate cancer, sustained release, target delivery
Introduction
Among the cancer related disease, the most prevalent would be prostate cancer and statistically it is the third leading cause of cancer related death in men [1-3]. The treatment includes surgery, chemotherapy, radiation, prostate specific membrane antigen (PSMA) targeted therapy, and combination therapies [4-10].
Chemotherapy, with which both natural and synthetic drugs could be used, is considered to be the choice of therapy. The limitations with conventional chemotherapeutic approaches are their low therapeutic index, severe side effects, poor pharmacokinetic and pharmacodynamics performance [11-14]. Androgen dependent prostate cancers could be treated with these chemotherapeutics but androgen-independent and metastatic prostate cancers are limited with the same [15-17]. Hence, novel therapeutics is in need to be developed so that all types of prostate cancers could be treated. Nanoparticle drug delivery systems (NDDS) may be the effective way of delivering the drug for prostate cancer for better cure [18-20].
In the present study, a site specific delivery of the anticancer drug, Capecitabine using PLGA polymers was prepared. Capecitabine has largely replaced 5-fluorouracil in several indications, including gastric cancer. Capecitabine is an antineoplastic antimetabolite prodrug that is enzymatically converted to 5-fluorouracil in the tumor. It inhibits DNA synthesis and slows growth of tumor tissue. Poloxamer is an effective nonionic surfactant for prolonging the circulation time of hydrophobic nanoparticles. RES uptake of drug is reduced by poloxamer and such particles have a better chance for accumulation at the target site.
PLGA offers unique properties for drug delivery purposes like world-wide approval for medical use, biodegradability, biocompatibility, and controlled release. However, some issues are not manageable by a single polymer e.g. targeting the diseased tissue, cellular uptake together with pre-programmed intracellular trafficking, and escaping the reticuloendothelial system (RES). As the contact with the body and the consequences thereof are mediated via the surface of the device, surface modification of PLGA-particles by grafting with selected biomimetic ligands can meet some of these ambitious challenges to pave the way towards a more efficacious medication with reduced side effects and improved patient’s compliance.
In most cases, capecitabine produce side effects like myocardial infarction, angina, hand-foot syndrome, diarrhea, nausea, stomatitis, anemia, thrombocytopenia, hyperbilirubinemia in conventional dosage form. This can be overcome by delivering capecitabine as nanoparticles. Nanoparticles can deliver the drug in controlled manner throughout the prostate by using a much reduced dosing schedule to increase the therapeutic efficiency.
Materials and methods
Chemicals
Capecitabine was obtained from Naprod Life Sciences Pvt. Ltd (Mumbai, India), Resomer ®RG 503 H-PLGA (50:50) were purchased from Boehringer Inglhem (Ingelheim, Germany), PVA, dialysis bag (cellophane membrane , molecular weight cut off 10000-12000Da) were purchased from Hi-Media, Mumbai, India. All other reagents and chemicals used in the study were of analytical grade.
Preparation of nanoparticles
Solvent displacement technique is made used in preparing the drug loaded PLGA nanoparticles [21-23]. 10 mg of capecitabine and 50 mg of polymer were dissolved in 5 ml acetone. The organic phase with a constant flow rate of 0.3 ml/min was added up into 15 ml of aqueous phase containing 1% of PVA or hydrophylic stabilizer 1.5% of poloxamer 188 under magnetic stirring. With the help of a rotavapor, the organic solvent was evaporated under vacuum. The suspension was filtered by using 0.2 μm membrane and centrifuged at 15,000 rpm for 1 hr at 5°C (Refrigerator centrifuge, Remi C-24). The sediment obtained is again dissolved in distilled water and centrifuged with the same conditions in triplicate. The final product was dried using a freeze dryer overnight [24].
Characterization of nanoparticles
The PLGA NPs loaded with drug were evaluated for its characterization with FTIR, Particles size, surface charge, surface morphology, drug encapsulation efficiency, percent drug loading, DSC, X-ray Diffraction, in vitro drug release and in vitro anticancer potential.
Encapsulation efficiency and drug loading
Encapsulation efficiency and drug loading was measured. Nanoparticles (10 mg) of known weights were soaked in 10 ml of phosphate buffer for 30 mints. The whole solution was centrifuged using a centrifuge at 16000 rpm in cooling centrifuge at 15°C for 30 min to remove the polymeric debris and polymeric debris was washed twice with fresh solvent to extract any adhered drug. The clear supernatant solution was analyzed for capecitabine content by UV spectrophotometer (UV Pharmaspec 1700, SHIMADZU) at λ max value of 304 nm. The complete extraction of drug was confirmed by repeating the extraction process on the already extracted polymeric debris. The percentage of encapsulation efficiency of the semi-IPN matrix was calculated as reported before. The standard curve of the capecitabine was obtained by plotting the concentration from 1 μg/ml to 5 μg/ml against its respective absorbance at 304 nm.
The percentage of drug loading and entrapment efficiency was calculated by using the following formula.
Encapsulation efficiency (%) = Amount of drug released from the lyophilized PLGA NPs / Amount of drug initially taken to prapare the NPs × 100
Drug loading (%) = Amount of drug found in the lyophilized NPs / Amount of lyophilized NPs × 100
Particle size measurement and surface charge analysis
Particle size analysis was performed by dynamic light scattering (DLS) with a Malvern Zetasizer 3 000 HSA (Malvern Instruments, UK). DLS yields the mean diameter and the polydispersity index (PI) which is a measure of the width of the size distribution. The mean diameter and PI values were obtained at an angle of 90° in 10 mm diameter cells at 25°C. Prior to the measurements all samples were diluted with double distilled water to produce a suitable scattering intensity.
Zeta potential
The zeta potential, reflecting the electric charge on the particle surface and indicating the physical stability of colloidal systems, was measured by determining the electrophoretic mobility using the Malvern Zetasizer 3 000 HSA (Malvern Instruments, UK). The sample was measured in double distilled water and adjusted to a conductivity of 50 IS/cm with sodium chloride solution (0.9% w/v). The pH was in the range of 5.5-7.5 and the applied field strength was 20 V/cm.
Fourier transform infrared spectroscopy
Infrared spectrum of any compound or drug gives information about the groups present in that particular compound. IR spectrum of Capecitabine, PLGA and nano formulation were obtained. Nanoparticle formulations were freeze dried and the powder Samples were mixed with KBr to make pellets. FT-IR spectra in the absorbance mode were recorded using FT-IR spectrometer (Perkin Elmer). Various peaks in IR spectrum were interpreted for the presence of different groups.
Differential scanning calorimetry (DSC)
Differential Scanning Calorimetry (DSC-60, SHIMADZU, Kyoto, Japan) was performed to characterize the physical state of Capecitabine in nanosphere. About 5 mg of sample was weighed, crimped into an aluminum pan and analyzed at a scanning temperature range from 50 to 300°C at a heating rate of 10°C/min [25,26].
X-ray diffraction study
X-ray diffraction analysis was employed to detect the crystallinity of the pure drug and the nanoparticle formulation, which was conducted using a Philips PW 3710 x-ray diffractometer (XRD) with a copper target and nickel filter (Philips Electronic Inst, Holland). Powders were mounted on aluminium stages with glass bottoms and smoothed to a level surface. The XRD pattern of each sample was measured from 10 to 50 degrees 2-theta using a step increment of 0.1 2-theta degrees and a dwell time of 1 second at each step [27].
Atomic force microscopy (AFM)
Atomic Force Microscopy (AFM) topography of surface was taken using Shimadzu 9500-2J, and Innova, Veeco operated in contact mode. The scanning tip was Si micro cantilever, 220 µm in length with force constant of 12 N/m. A 10 µl sample drop (1-50 µg/ml NPs in distilled water) was spotted on freshly cleaved mica and spread over about 12 mm in diameter. The sample solution was allowed to stay on the substrates for about 1 min, blown off with air, and immediately observed by AFM. AFM images were analyzed using SPM lab analysis software.
In vitro drug release studies
In vitro release study of Capecitabine from nanoparticles was carried out in PBS medium. 10 mg of each formulation was filled in the dialysis bag cut off size of 12 kDa and put into 200 ml of phosphate buffer solution at a pH of 7.4 and stirred at 100 rpm. At fixed time interval 2 ml of the buffer solution was withdrawn and replaced with fresh buffer. The drug release was assayed UV-visible spectrophotometerically (UV Pharma spec 1700, SHIMADZU) at the λ max value of 240 nm. The experiments were made triplicate and average values were taken.
Cell lines and culture medium
HepG2 cell line was procured from National Centre for Cell Sciences (NCCS), Pune, India. Stock cells were cultured in DMEM supplemented with 10% inactivated Fetal Bovine Serum (FBS), penicillin (100 IU/ml), streptomycin (100 µg/ml) and amphotericin B (5 µg/ml) in an humidified atmosphere of 5% CO2 at 37°C until confluent. The cells were dissociated with TPVG solution (0.2% trypsin, 0.02% EDTA, 0.05% glucose in PBS). The stock cultures were grown in 25 cm2 culture flasks and all experiments were carried out in 96 microtitre plates (Tarsons India Pvt. Ltd., Kolkata, India).
Preparation of test solutions
The test solutions were prepared in such a way that the weighed test drugs were separately dissolved in distilled DMSO. To obtain a stock solution of 1 mg/ml concentration, the volume was then made up with DMEM supplemented with 2% inactivated FBS. For cytotoxic studies, two fold serial dilutions were made.
Determination of cell viability by MTT assay [28]
The cell count was adjusted to 1.0×10⁵ cells/ml using DMEM containing 10% FBS. A 96 well microtitre plate was used. To each well, 0.1 ml of the diluted cell suspension (approximately 10,000 cells) was added and let it as such for 24 h. Upon the formation of the partial monolayer, the supernatant was flicked off. The monolayer was then washed once with medium and 100: l of different test concentrations of test drugs were added on to the partial monolayer in microtitre plates. The plates were then incubated at 37°C for 3 days in 5% CO2 atmosphere, and microscopic examination was carried out and observations were noted every 24 h interval. After 72 h, the drug solutions in the wells were discarded and 50: l of MTT in PBS was added to each well. The plates were gently shaken and incubated for 3 h at 37°C in 5% CO2 atmosphere. The supernatant was removed and 100: l of propanol was added and the plates were gently shaken to solubilize the formed formazan. The absorbance was measured using a microplate reader at a wavelength of 540 nm. The percentage growth inhibition was calculated using the following formula and concentration of test drug needed to inhibit cell growth by 50% (CTC50) values is generated from the dose-response curves for each cell line.
Results and discussion characterization of nanoparticles (NPs) encapsulation efficiency and drug loading
Encapsulation efficiency & drug loading of PLGA NPs were 88.4±0.17% and 16.98±0.7%. PLGA NPs shows maximum encapsulation efficiency, after that there was no change in encapsulation efficiency due to saturation of the polymer dispersion.
Particle size measurement
The formulation and process variables were optimized for getting small spherical Shape NPs with high drug encapsulation efficiency. The particle size noticed for the PLGA NP was 144.5±2.5 nm and the same is represented in Figure 1. Particle size is one of the most important parameters determining biocompatibilities and bioactivities of nanoparticles. Particle size is an important parameter because it has a direct relevance to the stability of the formulation.
Figure 1.
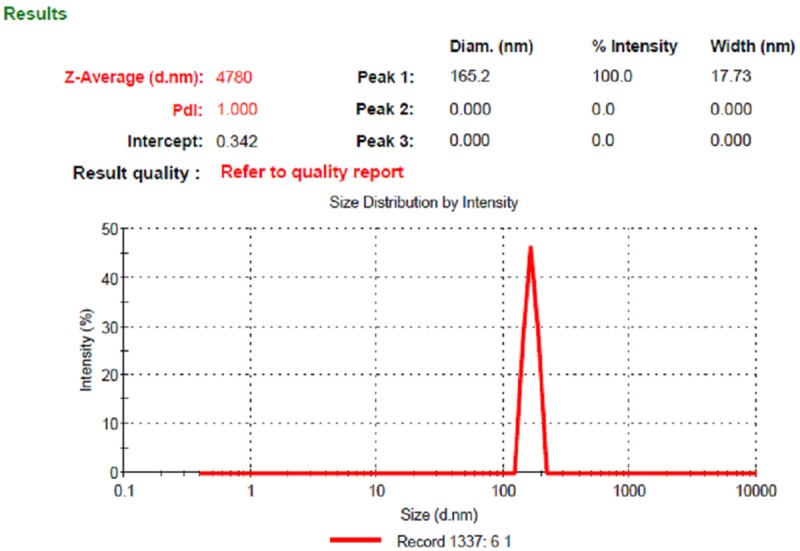
Particle size of PLGA NP formulation.
Zeta potential
The zeta potential (mV) of PLGA NPs was found to be --14.8±0.5 mV and the same is represented in Figure 2. Higher negative values of zeta potential were obtained for NPs formulation due to the presence of terminal carboxyl groups in the polymer. In case of charged particles, as the zeta potential increases, the repulsive interaction will be larger, leading to the formation of more stable particles with a more with more uniform size distribution. The negative zeta potential is lowered, means increasing the NPs stability. These results indicate that drug was not adsorbed on the surface of the NPs .Since most tumor cell membranes are negatively charged, nanoparticles have recently been studied to develop tumor-specific delivery of anticancer drugs.
Figure 2.
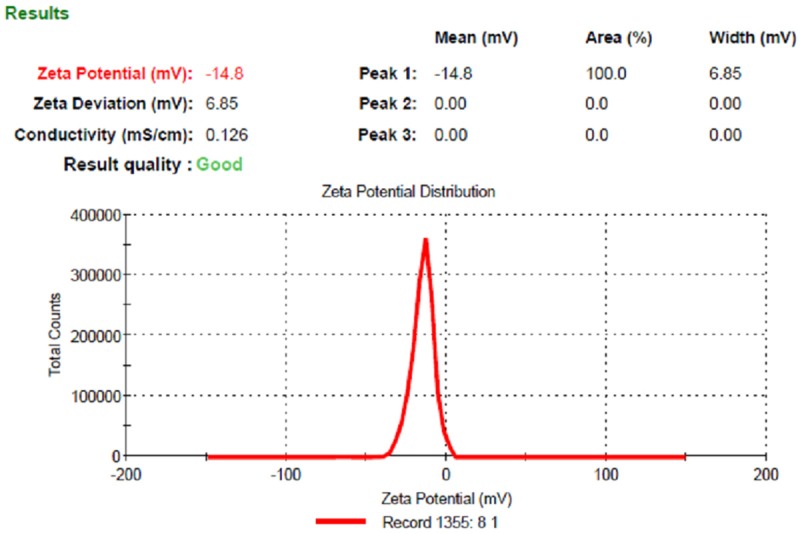
Zeta potential of PLGA NP formulation.
Fourier transform infrared spectroscopy (FTIR) study
F.T.I.R. study was carried out to confirm the compatibility between the selected polymer PLGA drug Capecitabine and nanoparticle formulation are presented in Figure 3. The spectra obtained from the I.R. studies are from 3600 cm-1 to 400 cm-1. The major peaks assigned to the drug capecitabine confirm the presence of different groups. The peak at 3421.78 cm-1 due to presence of O-H (stretching), 2959.46 cm-1 due to presence of N-H (stretching), 1758.72 cm-1 due to presence of N-C=O-N (IMIDE) and (C=O, stretching), 1624.07 cm-1 due to presence of NH-C=O, C=O, (stretching, amide), 1501.12 cm-1 due to presence of NH (bending), 1391.05-1340.48 cm-1 due to presence of C-N (stretching) and 210.67 cm-1 due to presence of O=C=O (carboxylate). It was confirmed that the peak of 3421.78 cm-1 became wider and flatter, indicating that hydrogen bond was enhanced, there are no major shifting as well as no loss of functional peaks between the spectra of drug, polymer and drug loaded NPs.
Figure 3.
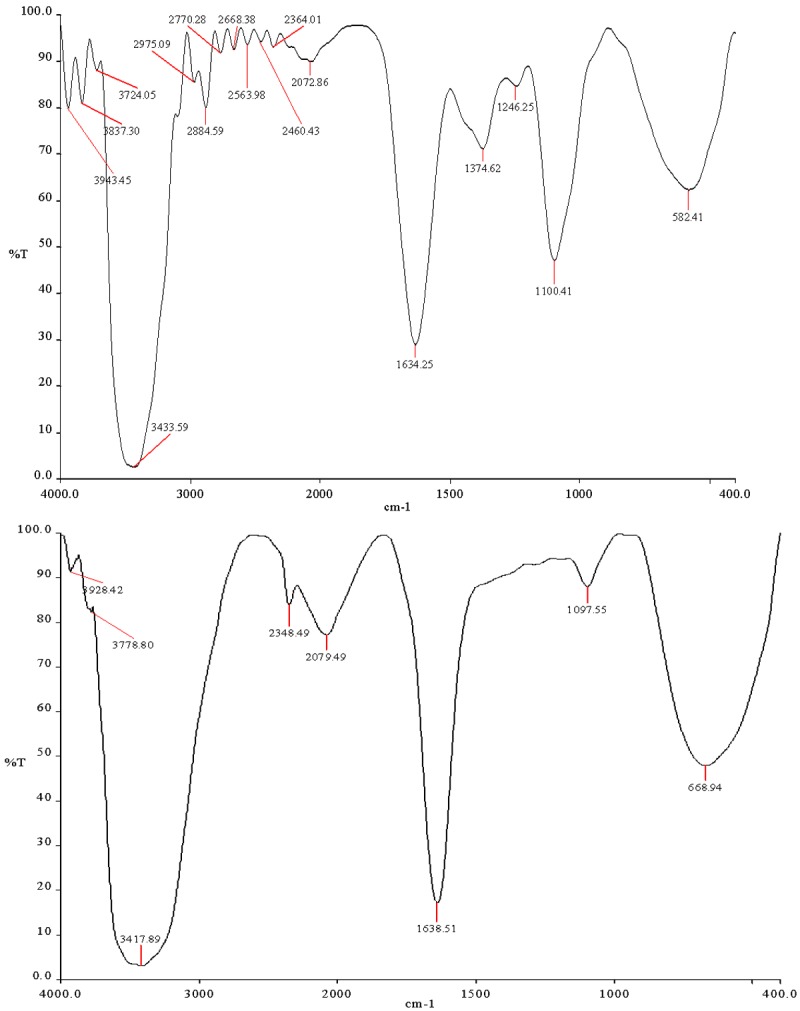
FTIR Spectrum of PLGA and PLGA NP formulation.
Differential scanning calorimetry (DSC)
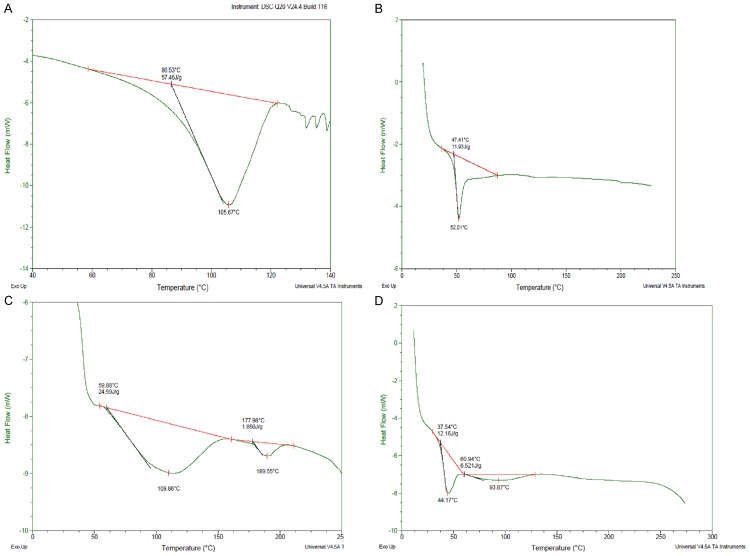
Figure 4 shows DSC thermo grams of free Capecitabine, unloaded plain PLGA NPs, and Drug loaded PLGA NPs. The obtained thermograms define the physical state of the drug and the polymer in the NPs and are useful in detecting any drug-polymer interactions within the polymeric network of the NPs. The Capecitabine thermo grams show an endoderm peak at 119.78°C. The thermo grams peaks for plain PLGA NPs was obtained at 109.86°C, 189.55°C, Capecitabine loaded surface modified PLGA NPs at 44.17°C, 93.87°C. The other minor peaks obtained were due to the presence of surfactant (PVA) in small amount in the formulation. There was no peak observed at the temperature of 119.78°C Capecitabine in PLGA NPs formulation. Hence it is evident from DSC studies did that there was no crystalline drug material in the nanosphere samples. This shows the crystallinity of the drug has been reduced significantly in the nanoparticles. Hence it could be concluded that in the prepared PLGA nanoparticles the drug was present in the amorphous phase and may have been homogeneously dispersed in the PLGA matrix.
Figure 4.
DSC thermograms of (A) Capicetabine (B) PLGA (C) Plain NP (D) PLGA NP.
XRD analysis
XRD pattern of the Capecitabine, PLGA and selected PNP-2 nanoparticle formulation are shown in Figure 5. Characteristic diffraction peaks were observed for commercial Capecitabine. On the other hand, the nanoparticles prepared with PLGA were characterized by less intensity of the diffraction peak when compared to that of Capecitabine. This clearly indicates the reduction in the crystallinity of the precipitated Capecitabine nanoparticles.
Figure 5.
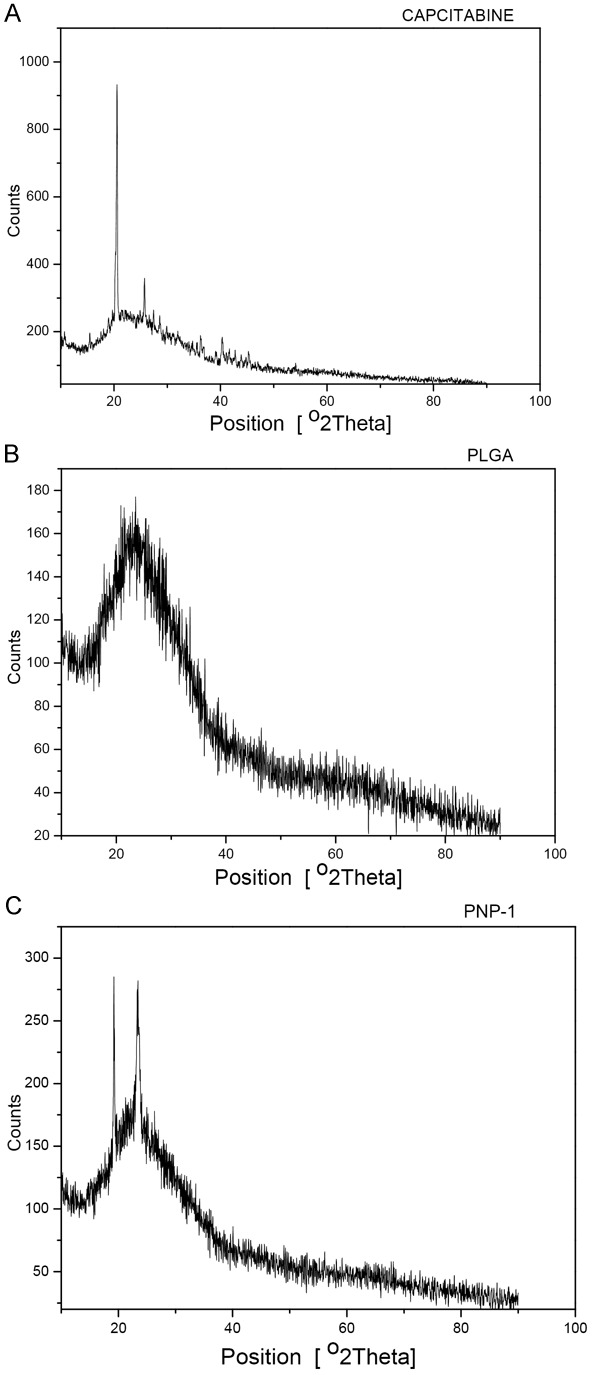
XRD Analysis (A) Capcitabine (B) PLGA and (C) PLGA NP.
Atomic force microscopy (AFM)
The morphological studies performed by AFM showed uniform and spherical shaped discrete particles without aggregation and smooth in surface morphology with a nano size range of 144 nm to 205 nm as Figure 6. Line analysis of AFM images using SPM lab analysis software reveals the size of the particles to be in the range of nm. The small polydispersity index suggested the size distribution of the products is fairly monomodal.
Figure 6.
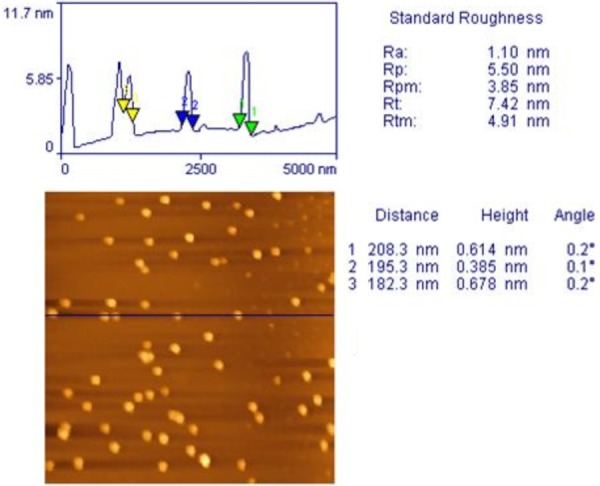
Atomic Force Microscopic image of PLGA NP formulation.
In-vitro release studies
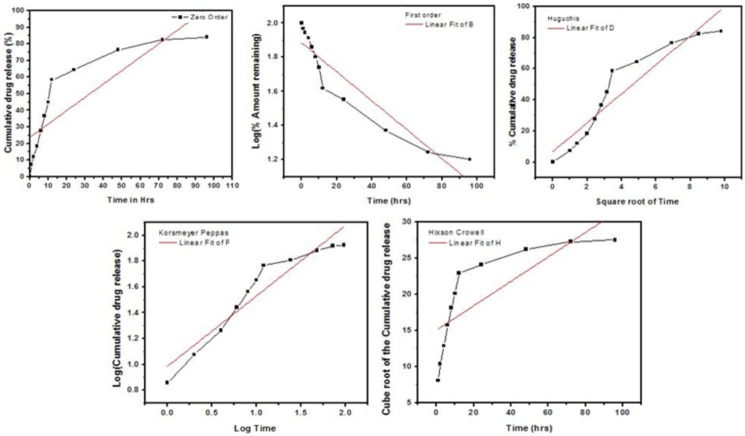
The release behavior of drug from the polymer matrix exhibited a biphasic pattern that is characterized by an initial burst, followed by a slower sustained release. Drug release of PLGA NPs formulation showed 84.1% at the end of 96th hr as depicted in Figure 7. An initial burst drug release (23%) was observed up to 6 hr, there is a constant slow drug release was observed up to 5 days. The initial burst drug release may be due to the presence of surface drug on the surface area of the NPs. The drug release followed zero order kinetics and a Fickian transport mechanism. Drug release was because it had the polymer content and this has the effect of retarding drug release as a result of increased particle size and reduced surface area available for drug release.
Figure 7.
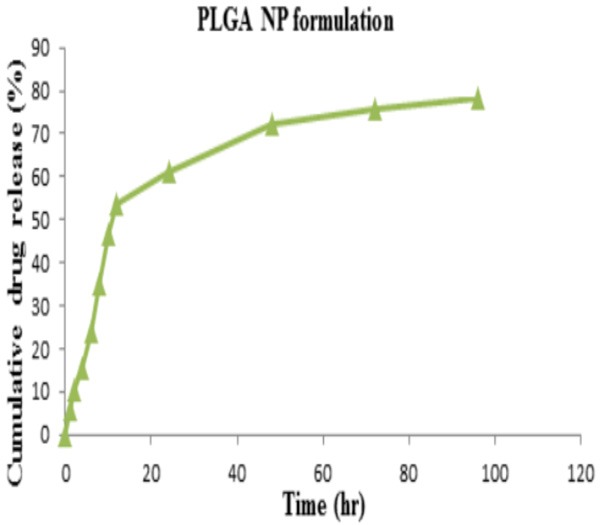
Cumulative drug release of capecitabine from PLGA NP formulation.
Release kinetics
Log percent cumulative drug released, plotted as a function of log time yielded curves, the slope of is the diffusional release exponent (n). The results of linear regression analysis data was given in Table 1. When the regression coefficient values of Zero order and First order were compared it was observed that the R2 values of Zero order plot was 0.8077 and first order plot was 0.866 indicates that the drug release was found to follow Zero order as well as First order kinetics. It is notable that values R2 of Higuchi plots were found to be 0.882 Korsemeyer peppas were found to be 0.901. This implies that the drug release was predominantly controlled by diffusion process. The drug release from the formulations followed a Fickian pattern too [29]. The values of diffusional n were 0.547.
Table 1.
Release kinetic data of the PLGA NP formulation
| Formulation | Zero order | First Order | Higuchi | Korsemeyer peppas | Hixson crowell | |
|---|---|---|---|---|---|---|
|
|
||||||
| R2 | R2 | R2 | R2 | n | R2 | |
| PNP | 0.8077 | 0.866 | 0.882 | 0.901 | 0.547 | 0.576 |
If n value is 0.5 or less, the release mechanism follows “Fickian diffusion”. The drug release follows zero-order drug release and case II transport if the n value is 1. The model fitting was represented in Figure 8.
Figure 8.
In-vitro release kinetic profile of PLGA NP formulation.
In-vitro anticancer potential
The cytotoxicity of capecitabine, PLGA NPs against Hep G2 Cell line by MTT Assay was determined. The inhibiting activity was increased in PLGA NPs against Hep G2 cells when compared to capecitabine and represented in Table 2 and Figures 9 and 10.
Table 2.
Cytotoxic properties of test drugs against HepG2 cell line
| Sl. No | Name of Test sample | Test Conc. (µg/ml) | % Cytotoxicity | CTC50 (µg/ml) |
|---|---|---|---|---|
| 1 | PLGA NP | 1000 | 75.42±4.02 | 101±20.21 |
| 500 | 71.67±5.00 | |||
| 250 | 57.14±4.72 | |||
| 125 | 57.08±6.15 | |||
| 62.5 | 42.98±0.84 | |||
| 2 | CAPE | 1000 | 18.31±4.43 | >1000.00 |
| 500 | 13.57±0.22 | |||
| 250 | 10.51±2.13 | |||
| 125 | 7.75±6.09 | |||
| 62.5 | 6.69±0.00 |
Figure 9.
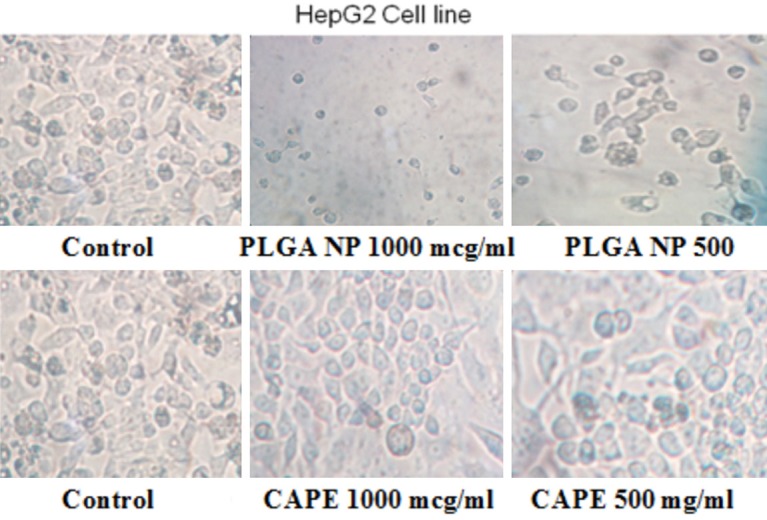
The tumors treated with capecitabine and PLGA NP formulation.
Figure 10.

Cytotoxic effect of PLGA NP formulation and capecitabine against HEPG2 cell line by MTT assay.
Conclusion
It is therefore concluded that Oral administration surface modified PLGA NPs containing Capecitabine may effectively deliver the drug to the prostate and formulation will significantly improve patient compliance by reducing dosing frequency from conventional doses and help in better management of prostate cancer. The lyophilized stable surface modified PLGA NPs preparation containing Capecitabine be a beneficial delivery system for controlled and targeted drug delivery for prostate cancer because of its lower particle size and good release profile. This particle size favors uptake into all the prostate cells. The best formulations based on in-vitro release were further used for in-vivo studies prostate cancer.
Disclosure of conflict of interest
None.
References
- 1.Centers for disease control and prevention, National program of cancer registries (NPCR) [Accessed April 25, 2011] Top ten cancers in United States. 2007. http://apps.nccd.cdc.gov/uscs/toptencancers.aspx.
- 2.Jemal A, Siegel R, Ward E, Hao Y, Xu J, Thun MJ. Cancer statistics. CA Cancer J Clin. 2009;59:225–249. doi: 10.3322/caac.20006. [DOI] [PubMed] [Google Scholar]
- 3.Teiten MH, Gaascht F, Eifes S, Dicato M, Diederich M. Chemopreventive potential of curcumin in prostate cancer. Genes Nutr. 2010;5:61–74. doi: 10.1007/s12263-009-0152-3. [DOI] [PMC free article] [PubMed] [Google Scholar]
- 4.Al-Mamgani A, Lebesque JV, Heemsbergen WD, Tans L, Kirkels WJ, Levendag PC, Incrocci L. Controversies in the treatment of high-risk prostate cancer--what is the optimal combination of hormonal therapy and radiotherapy: a review of literature. Prostate. 2010;70:701–709. doi: 10.1002/pros.21102. [DOI] [PubMed] [Google Scholar]
- 5.Dal Pra A, Cury FL, Souhami L. Combining radiation therapy and androgen deprivation for localized prostate cancer-a critical review. Curr Oncol. 2010;17:28–38. doi: 10.3747/co.v17i5.632. [DOI] [PMC free article] [PubMed] [Google Scholar]
- 6.Kohli M, Tindall DJ. New developments in the medical management of prostate cancer. Mayo Clin Proc. 2010;85:77–86. doi: 10.4065/mcp.2009.0442. [DOI] [PMC free article] [PubMed] [Google Scholar]
- 7.Moore CM, Pendse D, Emberton M. Photodynamic therapy for prostate cancer--a review of current status and future promise. Nat Clin Pract Urol. 2009;6:18–30. doi: 10.1038/ncpuro1274. [DOI] [PubMed] [Google Scholar]
- 8.Peschel RE, Robnett TJ, Hesse D, King CR, Ennis RD, Schiff PB, Wilson LD. PSA based review of adjuvant and salvage radiation therapy vs. observation in postoperative prostate cancer patients. Int J Cancer. 2000;90:29–36. [PubMed] [Google Scholar]
- 9.Quon H, Loblaw DA. Androgen deprivation therapy for prostate cancer-review of indications in 2010. Curr Oncol. 2010;17:38–44. doi: 10.3747/co.v17i0.698. [DOI] [PMC free article] [PubMed] [Google Scholar]
- 10.Roscigno M, Sangalli M, Mazzoccoli B, Scattoni V, Da Pozzo L, Rigatti P. Medical therapy of prostate cancer. A review. Minerva Urol Nefrol. 2005;57:71–84. [PubMed] [Google Scholar]
- 11.Beer TM, Bubalo JS. Complications of chemotherapy for prostate cancer. Semin Urol Oncol. 2001;19:222–230. [PubMed] [Google Scholar]
- 12.Heidenreich A, von Knobloch R, Hofmann R. Current status of cytotoxic chemotherapy in hormone refractory prostate cancer. Eur Urol. 2001;39:121–130. doi: 10.1159/000052426. [DOI] [PubMed] [Google Scholar]
- 13.Pomerantz M, Kantoff P. Advances in the treatment of prostate cancer. Annu Rev Med. 2007;58:205–220. doi: 10.1146/annurev.med.58.101505.115650. [DOI] [PubMed] [Google Scholar]
- 14.Rauchenwald M, De Santis M, Fink E, Holtl W, Kramer G, Marei IC, Neumann HJ, Reissigl A, Schmeller N, Stackl W, Hobisch A, Krainer M. Chemotherapy for prostate cancer. Wien Klin Wochenschr. 2008;120:440–449. doi: 10.1007/s00508-008-1008-3. [DOI] [PubMed] [Google Scholar]
- 15.Amato RJ, Teh BS, Henary H, Khan M, Saxena S. A retrospective review of combination chemohormonal therapy as initial treatment for locally advanced or metastatic adenocarcinoma of the prostate. Urol Oncol. 2009;27:165–169. doi: 10.1016/j.urolonc.2007.12.004. [DOI] [PubMed] [Google Scholar]
- 16.Letsch M, Schally AV, Szepeshazi K, Halmos G, Nagy A. Effective treatment of experimental androgen sensitive and androgen independent intraosseous prostate cancer with targeted cyto-toxic somatostatin analogue AN-238. J Urol. 2004;171:911–915. doi: 10.1097/01.ju.0000105101.77884.06. [DOI] [PubMed] [Google Scholar]
- 17.Small EJ. Advances in prostate cancer. Curr Opin Oncol. 1999;11:226–235. doi: 10.1097/00001622-199905000-00016. [DOI] [PubMed] [Google Scholar]
- 18.Fitzpatrick JM. The application of nanotechnology for the treatment of metastatic prostate cancer. BJU Int. 2009:104. doi: 10.1111/j.1464-410X.2009.08825.x. [DOI] [PubMed] [Google Scholar]
- 19.Gommersall L, Shergill IS, Ahmed HU, Arya M, Grange P, Gill IS. Nanotechnology in the management of prostate cancer. BJU Int. 2008;102:1493–1495. doi: 10.1111/j.1464-410X.2008.08120.x. [DOI] [PubMed] [Google Scholar]
- 20.Michael A, Syrigos K, Pandha H. Prostate cancer chemotherapy in the era of targeted therapy. Prostate Cancer Prostatic Dis. 2009;12:13–16. doi: 10.1038/pcan.2008.32. [DOI] [PubMed] [Google Scholar]
- 21.Fessi H, Devissaguet JP, Puisieux F, Thies C. Preparation and characterization of poly--caprolactone nanoparticles containing griseofulvin. French Patent. 1988;2:608. [Google Scholar]
- 22.Fessi H, Devissaguet JP, Puisieux F, Ammoury N, Benita S. Nanocapsule formation by interfacial polymer deposition following solvent displacement. Int J Pharm. 1989;55:1–4. [Google Scholar]
- 23.Musumeci T, Ventura CA, Giannone I, Ruozi B, Montenegro L, Pignatello R, Puglisi G. PLA/PLGA nano particles for sustained release of docetaxel. Int J Pharm. 2006;325:172–9. doi: 10.1016/j.ijpharm.2006.06.023. [DOI] [PubMed] [Google Scholar]
- 24.Claudia G, Claudio B, Adrina M, Donatella P, Vandelli MA, Giovanni P. Influence of Preparation Conditions on Acyclovir-Loaded Poly-d, l-Lactic Acid Nanospheres and Effect of PEG Coating on Ocular Drug Bioavailability. Pharma Research. 2003;20:1–4. doi: 10.1023/a:1023290514575. [DOI] [PubMed] [Google Scholar]
- 25.Gurny R, Peppas NA, Harrington DD, Gurny GSR, Peppas NA, Harrington DD. Injectable latices for controlled release of potent drugs. Drug Development and Industrial Pharmacy. 1981;7:1–25. [Google Scholar]
- 26.Magdassi S, Margulis GK. Formation of simvastatin nanoparticles from micro emulsion Nanotechnology. Biology and Medicine in Nanomedicine. 2009;5:274–281. doi: 10.1016/j.nano.2008.11.004. [DOI] [PubMed] [Google Scholar]
- 27.Aukunuru J, Bonepally CR. In: Liver targeting drug delivery. Madhusudan Rao., editor. Hyderabad: Pharma Book Syndicate; 2012. pp. 267–315. [Google Scholar]
- 28.Denizot F, Lang R. Rapid colorometric assay for cell growth and survival modifications to the tetrazolium dye procedure giving improved sensitivity and reliability. J Immunol Methods. 1986;89:271–277. doi: 10.1016/0022-1759(86)90368-6. [DOI] [PubMed] [Google Scholar]
- 29.Gautam S, Mahaveer S. In-vitro drug release characterization models. Int J Pharm Studies Res. 2011;2:77–84. [Google Scholar]


