Abstract
This study examines the effectiveness of a current Airborne Infection Isolation Room (AIIR) in protecting health-care workers (HCWs) from airborne-infection (AI) exposure, and compares HCW AI exposures within an AIIR and a traditional patient room. We numerically simulated the air-flow patterns in the rooms, using room geometries and layout (room dimensions, bathroom dimensions and details, placement of vents and furniture), ventilation parameters (flow rates at the inlet and outlet vents, diffuser design, thermal sources, etc.), and pressurization corresponding to those measured at a local hospital. A patient-cough was introduced into each simulation, and the AI dispersal was tracked in time using a multi-phase flow simulation approach.
The measured data showed that ventilation rates for both rooms exceeded 12 air-changes per hour (ACH), and the AIIR was at almost 16 ACH. Thus, the AIIR met the recommended design criteria for ventilation rate and pressurization. However, the computed results revealed incomplete air mixing, and not all of the room air was changed 12 (or 16) times per hour. In fact, in some regions of the room, the air merely circulated, and did not refresh. With the main exhaust flow rate exceeding the main supply, mass flow rate conservation required a part of the deficit to be accounted for by air migration from the corridor through the gaps around the main door. Hence, the AIIR was effective in containing the “infectious aerosol” within the room. However, it showed increased exposure of the HCW to the AI pathogens, as the flow from the ceiling-mounted supply louver first encountered the patient and then the HCW almost directly on its way to the main exhaust, also located on the ceiling. The traditional patient room exhibited a similar flow path. In addition, for the traditional patient room, some cough-generated aerosol is observed very close to the gaps around the door to the corridor, indicating that the aerosol may escape to the corridor, and spread the infection beyond the room. The computational results suggest that ventilation arrangement can have an important role in better protecting the HCW from exposure to airborne infectious pathogens.
INTRODUCTION
The U.S Department of Health and Human Services defines Pandemic Flu (Pan Flu) as a virulent human flu that causes a global outbreak, or pandemic, or serious illness. As the natural immunity level is generally inadequate for resisting the virus, the disease can spread easily from person to person. In the case of a Pan-Flu outbreak, health-care workers (HCWs) are a high-risk group as they come in close contact with Pan-Flu patients. In addition, HCWs can be carriers of the virus, exposing non-flu patients to the virus since an infected person can be contagious prior to onset of symptoms.
In Federal and State pandemic contingency plans, an Airborne Infection Isolation Room (AIIR) is prescribed when HCWs conduct aerosol-generating procedures on Pan-Flu patients. Example procedures include intubation, nasopharyngeal aspiration, tracheostomy care, bronchoscopy, and nebulizer therapy. A properly designed and operating AIIR can be an effective control measure for preventing the spread of infectious aerosol outside of the patient room. In an AIIR, infectious aerosols are contained within the room, and their concentration is reduced via dilution ventilation. Construction guidelines for AIIRs require at least 12 air changes per hour (ACH) of ventilation supply/exhaust within the room (new construction), and maintaining a negative pressure in the room compared to the adjacent areas.
Computational Fluid Dynamics (CFD) is being increasingly used in health-care studies as an efficient method to predict infectious aerosol transport. The present research aims to reduce HCW exposure to Pan-Flu virus during aerosol-generating procedures on infected patients, and is directed at better engineering design of hospital ventilation systems.
OBJECTIVES
The first objective of this research is to examine the ventilation effectiveness of an AIIR and a traditional patient room in a local hospital, with the goal to evaluate HCW exposures to infectious aerosol while conducting aerosol-generating procedures on the flu-affected patients. This evaluation is achieved by numerically simulating the air-flow pattern in both of these rooms. The geometric dimensions, spatial location of the bed and other appliances/furniture, types and characteristics of the inlet and exhaust vent diffusers correspond to the actual configurations in these rooms. Similarly, the flow rates at the inlet and exhaust vents, temperature, pressure, pressure differential between the room and the hospital corridor, and pressure at the exhaust vent also correspond to the prevailing room conditions. The virus movement is tracked by simulating the dispersal of aerosol introduced via the patient cough.
METHODOLOGY
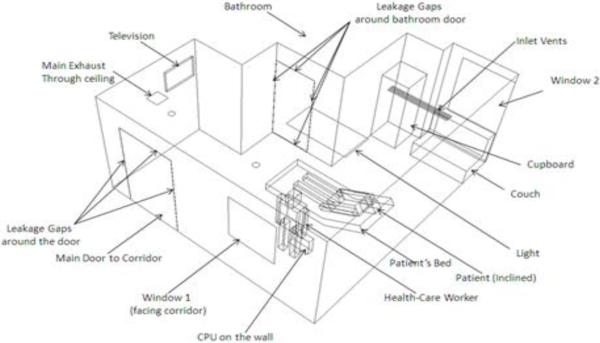
Airflow measurements were made in the AIIR and the traditional patient room at a local hospital, and are summarized in Table 1. Room dimensions were also measured (length = 192” (4.88 m), width = 216” (5.49 m), height = 101” (2.57 m)), as were dimensions of the furniture and other appliances (not reported here). Figure 1 shows an isometric view of the AIIR; a similar view of the traditional patient room was also generated, but is not included here due to space limitations. A corresponding CAD model was constructed for each room, and a computational grid was generated using the GridGen software (Pointwise Inc., 2011).
Table 1.
Measured air-flow rates and temperatures in AIIR and normal patient room
| AIIR | Regular Patient Room | |
|---|---|---|
| Volume Flow Rates: ACFM - actual cubic ft per min (m3/s) | Bathroom door closed: | |
| Main Supply Vent 202 (0.0950) | 227 (0.107) | |
| Main Exhaust Vent 502 (0.236) | 170 (0.080) | |
| Bathroom Exhaust Vent 64 (0.030) | 72 (0.034) | |
| Deficit −364 (−0.171) | −16 (−0.008) | |
| Bathroom door open: | ||
| Main Supply Vent 202 (0.089) | 218 (0.102) | |
| Main Exhaust Vent 503 (0.212) | 159 (0.244) | |
| Bathroom Exhaust Vent 64 (0.0310) | 68 (0.0320) | |
| Deficit −364.132 (−0.153) | −9 (−0.004) | |
| Inflow velocities around main door | RHS Gap: 340 ft/min (1.73 m/s) | Too low to measure |
| LHS Gap: 390 ft/min (1.98 m/s) | ||
| Top Gap: 350 ft/min (1.78 m/s) | ||
| Hallway Pressure | 28.9187 inches Hg (0.735 m Hg) | 28.9075 in Hg (0.734 m Hg) |
| Temperatures | Supply Air: 68.2 °F (20.1°C) | 68.2 °F (20.1°C) |
| Exhaust Air: 70.5 °F (21.4°C) | 70.5 °F (21.4°C) | |
| Room: 70 °F (21.1°C) | 71.5 °F (22.0 °C) | |
| Hallway: 71.7 °F (22.0°C) | 71.6 °F (22.0 °C) | |
Figure 1.
Isometric view of the AIIR
Boundary Conditions
Supply and Exhaust Vents
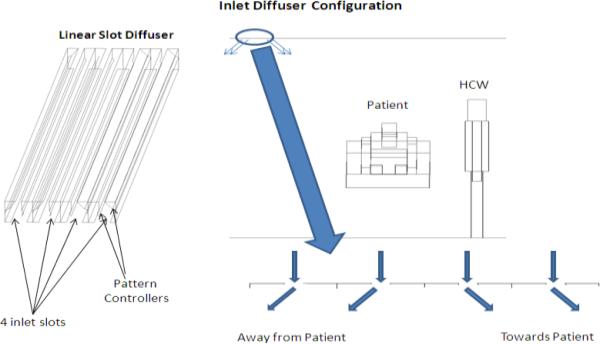
Flow rates, in terms of Actual Cubic Feet per Minute (ACFM), and temperatures were specified at the inlet and exhaust vents. The velocity direction at the supply vent was assigned based on the diffuser-slot geometry (Fig.2). The velocity at the exhaust vent is calculated using the measured exhaust flow rate and exhaust-vent area.
Figure. 2.
Inlet diffuser design
Leakage(s)
For the AIIR, the measured velocities were specified at the gaps around the main door. The bathroom was uncoupled from the main room by closing the bathroom door. Of the total bathroom exhaust (64 ACFM (0.030 m 3/s)), approximately 40% (24 ACFM (0.0110 m3/s)) was assumed to be “satisfied” by leakage from the main room into the bathroom. The remaining 40 ACFM (0.0188 m3/s) was taken to be inflow leakage through the bathroom ceiling and wall penetrations. In the main room, the total inflow is from the main supply and through the door gaps, whereas the total outflow is through the main exhaust. The total inflow deficit (in ACFM) = 202 (main supply) + 73 (door gap inflow) − 502 (Main Exhaust) = − 250 (−0.118 m3/s). This deficit was accounted as uniform inflow leakage through the false ceiling. The average velocity for this leakage is calculated as 1.24 ft/min, (0.00628 m/s).
For the traditional patient room, the measured pressure (28.9075 in. Hg (0.734 m Hg)) was specified at the gaps around the main door. For the boundary condition at the gaps around the bathroom door, two scenarios were considered. For Case 1, like the AIIR, 40% of the bathroom exhaust flow rate was specified as the flow from the main room into the bathroom. This led to air leaving (outflow) from the room through the gaps around the main door. For Case 2, air enters the main room through the gap around the main door. The total bathroom exhaust flow rate (72 ACFM(0.034 m3/s)) was specified at the gap around the bathroom door. The deficit in the main room (in ACFM) = 227 (Main Supply) − 170 (Main Exhaust) − 72 (Leakage to bathroom) = 16 (0.008 m3/s). This flow rate deficit in the main room is “satisfied” by the inflow from the hallway, through the gaps around the main door. Both scenarios were considered to enable the examination of the flow pattern differences for the two cases. However, since Case 2 mimicked the situation observed in the hospital room, results for only Case 2 are presented here.
Patient and HCW Geometry and Temperatures
Patient and HCW bodies were modeled using 50% anthropometric data (NASA, 2010), with dimensions given in Table 2. A temperature of 101°F (38.7°C) was specified for the patient’s head to account for a “fever”; the patient’s sheet-covered body was assumed to be at room temperature. A temperature of 98°F (38.3°C) was specified to the HCW’s head; the rest of the “clothed body” was at room temperature. The HCW stood at a distance of 1.640 feet (0.5 m) from the patient on the side of the monitoring instrumentation location.
Table 2.
Patient and HCW dimensions (NASA 2010)
| Head | 1.25×0.53×0.93 ft (0.38 × 0.16 × 0.28 m) |
| Arms | 0.33×0.32×2.57 ft (0.10 × 0.10 × 0.78 m) |
| Body | 1.64×0.82×2.139 ft (0.5 × 0.25 × 0.652 m) |
| Legs | 0.41×0.41×3.45 ft (0.13 × 0.13 × 1.05 m) |
| Mouth | 0.0980 ft (3cm) diameter |
Furniture
Furniture comprised of a couch, cupboard, patient bed and television, and these (except the television) were modeled using the measured data and locations in the actual hospital rooms. These items were considered “isothermal walls” at room temperature. For the television (Digital BedMate II HCI), the power rating was 0.142 BTU/s (150 W). Around 20-30% of the power consumed was dissipated as heat, according to industrial design. Therefore, 7.414×10⁻³-11.121×10⁻³ BTU/ft2 sec (84 - 126 W/m2) was specified as the heat flux at the television.
Ceiling Lights
One light with a power rating of 0.171 BTU/s (180W) was located above the patient bed. Assuming 70% of the power is given off as heat, 0.0150 BTU/ft2s (169.5W/m2) was the net heat flux at this light. Two circular lights, of 0.0470 BTU/sec (50W) rating, were also present on the ceiling. A 70% heat dissipation results in 0.309 BTU/ft2s (3500W/m2) heat flux for these lights.
Windows
The two windows in the room were considered as isothermal walls. One window faced the outside environment, and had a temperature of 62.2°F (16.8°C) on the day the measurements were conducted. The second window faced the corridor, and was considered to be at room temperature.
Turbulence Quantities
The boundary values for the turbulence intensity, kinetic energy, and dissipation rate, at the main supply and exhaust vents and at the gaps around the bathroom door and the main door are listed in Table 3 for both rooms. These were estimated using the flow Reynolds numbers at these boundaries; (FLUENT Inc. 2006).
Table 3.
Boundary values of turbulence quantities
| AIIR | Regular Patient Room | |||||||
|---|---|---|---|---|---|---|---|---|
| Re | Intensity | k ft2/s2 (m2/s2) | ε ft2/s3 (m2/s3) | Re | Intensity | k ft2/s2 (m2/s2) | ε ft2/s3 (m2/s3) | |
| Main Supply | 2600 | 5.90% | 0.0340 (0.00320) | 0.034 (0.00320) | 2950 | 5.89 % | 0.0430 (0.00400) | 0.130 (0.0121) |
| Main Exhaust | 5900 | 4.10 % | 0.372 (0.0346) | 0.640 (0.0594) | 21000 | 4.60 % | 0.0828 (0.00770) | 1.259 (0.117) |
| Gap around Bathroom Door | 260 | 7.90 % | 0.0120 (0.00110) | 0.0820 (0.00760) | 780 | 6.96 % | 0.0624 (0.00580) | 1.002 (0.0931) |
| Gap around Main Door | 703 | 7.05 % | 0.260 (0.0242) | 16.65 (1.55) | 105 | 5.00 % | 0.000907 (0.0000843) | 0.00196 (0.000182) |
Cough characteristics
The cough event (one instance of patient cough) in both the AIIR and the traditional patient room was modeled using data from the literature. The mouth diameter is taken to be 0.0980 feet (3 cm) (Vansciver et al. 2011). The duration of the cough and the velocity of the air-droplet mixture are obtained from Mahajan et al. 1994. The mean peak flow rate is 10.6 ft3/min (300 L/min). The average velocity of cough is taken to be 22.6 feet/s (6.9 m/s). The stroke length is 11.45 feet (3.5 m). The average cough volume is 0.0784 feet3 (2.47 L). The time duration of one cough occurrence was identified to be 0.5 seconds, so the air-droplet mixture was “injected” from the patient’s mouth for this duration. The diameter of the cough-generated aerosol was selected to be 1 μm, as this was a size of particular interest due to its capability for deep-lung disposition (www.agius.com/hew/resource/lung.htm).
Diffuser design
Air at the inlet vents was supplied into the room through a linear slot diffuser (Srebric and Chen 2002) with four slots. Two of the slots direct the air towards the patient’s bed, while the other two slots direct air away from the patient. The velocity directions used in the model mimic this behavior (Fig. 2).
Materials
The materials used in the model and their properties are listed in Table 4.
Table 4.
Material properties
| Material | Conductivity BTU/s ft °F (W/mK) | Specific Heat BTU/lb°F (kJ/kg-K) | Density lb/ft3 (kg/m3) |
|---|---|---|---|
| Window Glass | 1.66 (0.96) | 0.20 (0.84) | 156.07 (2500) |
| Human Skin (Ref. 6) | 0.36 (0.209) | 0.85 (3.56) | 64.11 (1027) |
| Plastic | 1.74 (1.01) | 0.40 (1.67) | 78.03 (1250) |
| Wood | 1.26 (0.17) | 551 (2310) | 43.70 (700) |
Solution Procedure
The unsteady, 3D, incompressible, Navier-Stokes equations, including gravity, were solved, with the pressure-velocity coupling achieved using the Semi-Implicit Pressure-Linked equations (SIMPLE) algorithm. The energy equation was also solved, to account for temperature variations. The transport equations were discretized using a second-order upwind scheme, with second-order implicit discretization for the temporal (“time”) terms. Turbulence was modeled using the realizable k-ε model. The finite-volume based CFD software, FLUENT, was used to solve these equations. The time step chosen for the transient simulation was 0.001 seconds. The solution at each time step was considered converged when the scaled residuals of continuity, momentum, energy and turbulence equations reached the order of 10−6.
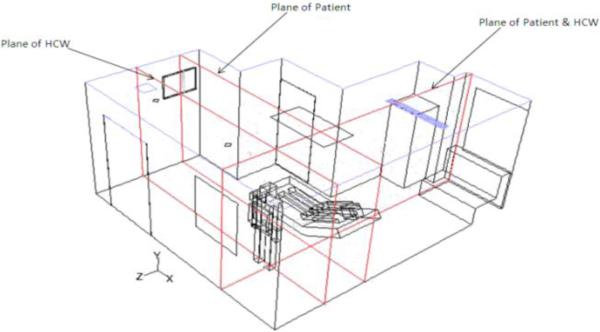
The steady-state flow field was determined prior to the occurrence of the cough. Convergence criteria for the steady state flow field were set at 10−6 for all equations. A mixture of cough aerosol and air was then injected from the patient’s mouth for 0.5 seconds. The mixture consisted of approximately 6000-7000 cough aerosol particles in each room, given that the number of aerosol particles in a cough is of the order of 1000-10000 (Kowalski and Bahnfleth 1998, Chaoa, Wana and Toa 2008). The Lagrangian Discrete Phase Model (DPM) was used to track the discrete cough aerosol. The aerosols were allowed to “coalesce” or “bounce”, based on angle of collision. Evaporation effects upon aerosol size were not considered as this consideration was part of the original aerosol size selection. Aerosol is “trapped” on striking solid surfaces, and “escaped” on reaching the exhaust locations. After the injection was “switched off”, the transient movement of the discrete cough droplets was tracked for a period of 35 seconds. The results show the position of individual cough aerosols at various time instants in a plane through the patient, and another plane crossing the HCW (Fig. 3).
Figure 3.
Planes of results shown in an AIIR
RESULTS
Flow Pattern in AIIR
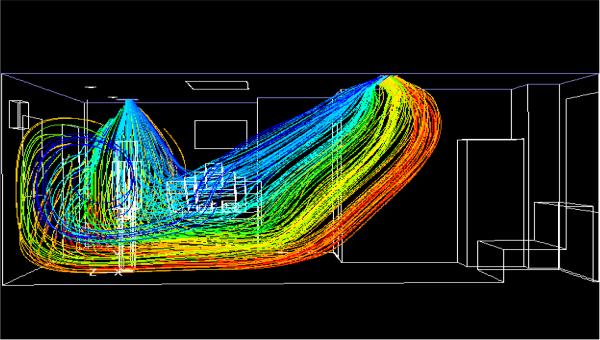
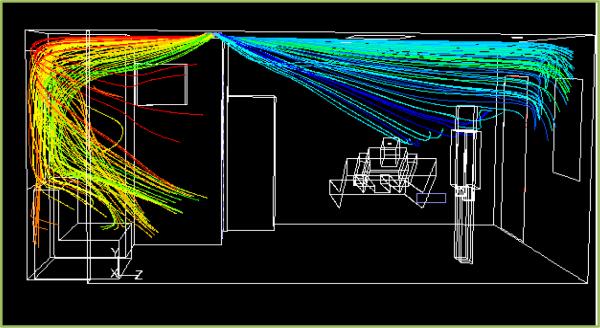
Figure 4 shows the pathlines of the flow in the AIIR. The air jets issue from the main supply on the ceiling at an angle of 45° to the ceiling. Two slots in the diffuser direct air towards the patient’s bed, while the other two slots direct air away from the patient. The air travels down the room, crosses the HCW, recirculates behind the HCW, and is then pulled by the exhaust on the ceiling. Due to the negative pressure inside the room, air enters the room from the corridor through the door gaps. Both air supplies are pulled by the ceiling exhaust without having a chance to circulate throughout the room. Due to the positioning of the main supply, the planes of the HCW and the patient show higher velocity gradients near the ceiling, towards the right. Similarly, the strong main exhaust pulls the air continuously, leading to a high velocity near the ceiling towards the left in the plane of the HCW. The temperature contours (not shown) indicate the temperature gradients in the planes of the patient and the HCW. The highest temperature in the patient plane is 78.8°C (173.9°F), and occurs behind the television. The heat dissipated from the ceiling light causes the light to be at 51.8°C (125.3°F).
Fig. 4.
Pathlines, colored by origination location in AIIR
Flow Pattern in Traditional Patient Room
For the traditional patient room, Fig. 5 shows that the main supply inlet jets of air emerge at 45° to the ceiling. As in the AIIR, two slots direct air towards the patient bed, and two slots direct air away from the patient bed. The jets align nearly parallel to the ceiling after they emerge from the slots in the two opposite directions, until they reach the walls and deflect downwards. The jets then meet the floor, spreading horizontally throughout the room before being pulled towards the main exhaust. Regions of recirculation are seen in the planes of the patient and the HCW. The higher velocity gradient at the ceiling is due to the presence of main supply at that location. The flow is driven primarily by the main inflow supply. Temperature contours (not included here) show a temperature gradient at the ceiling above the patient, due to the heat flux dissipated from the light above the patient bed.
Fig. 5.
Pathlines, colored by origination location in patient room
Introduction of Cough and Tracking of Cough-Aerosol Dispersal
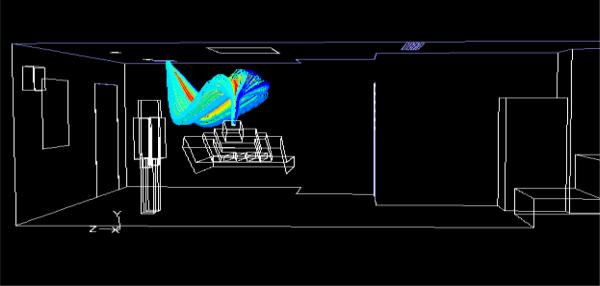
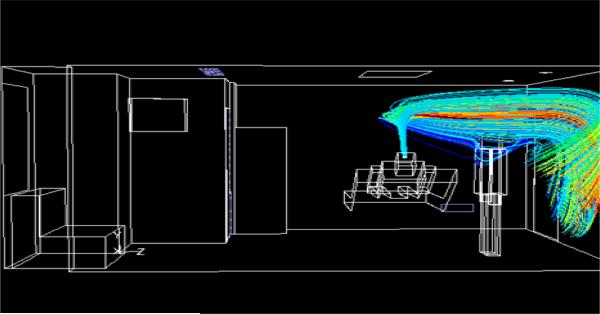
First, the steady air flow is simulated inside the rooms. Next, a mixture of air and cough aerosol of 1 μm diameter is injected for 0.5 seconds from the patient’s mouth. In the AIIR, the patient cough travels towards the main exhaust without spreading around the room (Fig. 6). In the traditional patient room, the main exhaust is not “strong” enough to directly draw the patient cough, and allows it to spread around the room (Fig. 7). With uniform static pressure specified at the gap around the traditional patient room main door, the results show that the flow is inward at most locations but outward at some, so that aerosol can leave the room at the latter locations. However, the net flow at the main door gap is inward.
Fig. 6.
Pathlines emanating from patient’s mouth in AIIR
Fig. 7.
Pathlines emanating from patient’s mouth in patient room
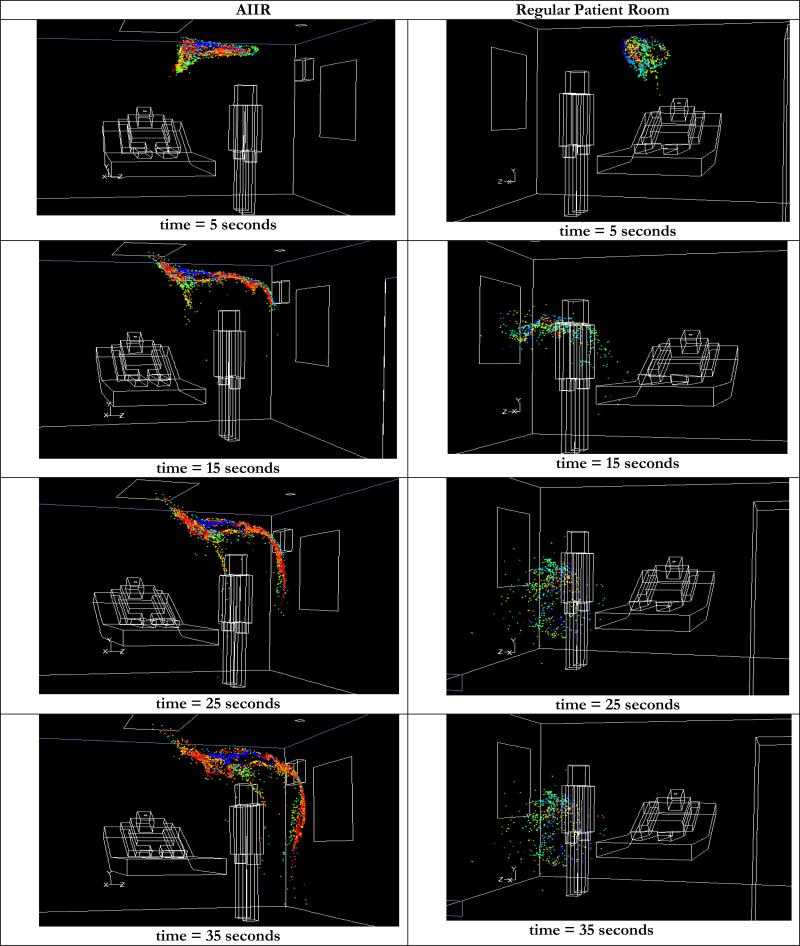
The cough aerosol is tracked for 35 seconds in both rooms. Initially, the cough dispersal is similar in both rooms, but the aerosol trajectories begin to differ as time progresses. Figure 8 shows a comparison of the cough aerosol dispersal in both rooms at times from 5 seconds to 35 seconds after the patient cough. In the AIIR, the aerosol moves from the patient to the HCW. At t = 15 seconds, cough aerosol is above the HCW, slightly below the ceiling. Owing to their initial close proximity, coalescence is predominant at early time periods. The coalescence probability decreases significantly with aerosol dispersion. Over time, the aerosol descends into the region of the HCW. Most of the aerosol is still airborne at t = 35 seconds; a limited amount moves toward the floor. The mean aerosol diameter was 2.98 μm at this time.
Figure 8.
Comparison of transient dispersal of cough droplets in AIIR and regular patient room
In the traditional patient room, the cough aerosol emerges from the patient’s mouth, but the prevailing flow deflects it back to the region of the patient and the HCW. Subsequently, a portion of the aerosol cloud begins to move towards the main exhaust, and towards the door, while most of the aerosol is located close to the patient and the HCW. As in the AIIR, aerosol coalescence occurs predominantly at early times and decreases as the aerosols disperse. Due to coalescence, the mean diameter of the aerosol is increased from 1 μm, at the start of the cough to 2.46 μm at 35 seconds following the end of the cough.
CONCLUSION
This study simulated cough-aerosol dispersal in both an AIIR and a traditional patient room at a local hospital, in order to evaluate the effectiveness of the existing ventilation configurations in protecting an attending HCW from patient-generated cough-aerosol. The operating conditions in these rooms were measured, and used in the simulations.
In the AIIR, the exhaust draws most of the cough aerosol towards it (Fig. 4), and the flow pattern is effective in containing the airborne cough aerosol within the room. However, the air carrying the patient-emitted aerosol flows from the patient towards the HCW. Cough aerosol, though slightly diluted, is not immediately removed from the vicinity of the HCW, and the HCW is thus susceptible to exposure to airborne contagion originating from the patient.
In the traditional patient room, the main exhaust is much weaker than that in the AIIR, and does not force (“pull”) the jets from the supply towards it (Fig. 5). Air flows from the patient, towards the HCW, and over the duration of the simulation, the cough aerosol does not spread to the hallway of the hospital (though it is seen moving in this direction). Some of the cough aerosol is seen very close to the gap around the main door. The HCW is exposed to cough aerosol, as in the AIIR. Most of the cough aerosol is in the vicinity of the HCW and the patient. Unlike in the AIIR, aerosol reaches the floor or is suspended in the air at the level of the patient’s bed.
The cough aerosol in both rooms is seen to move towards the HCW position, thus exposing the HCW to any virus carried by the aerosol. For the tested scenario, moving the HCW to the opposite side of the patient bed might mitigate the exposure, although the exposure observed with the presently evaluated HCW position could still occur depending upon treatment requirements and worker awareness. Additional simulations are planned to evaluate alternate ventilation configurations, including interchanging the main inlet and exhaust locations, with the goal to better protect the HCW.
Acknowledgments
The University of Cincinnati (UC) authors gratefully acknowledge NIOSH sponsorship of this research, and the high-performance computing resources of the Ohio Supercomputer Center, and thank Santosh Roopak Dungi, Graduate Student in Mechanical Engineering, UC, for valuable assistance with manuscript preparation.
Footnotes
Disclaimer: The findings and conclusions in this paper are those of the authors, and do not necessarily represent the views of NIOSH. Mention of any company or product does not constitute endorsement by NIOSH
Contributor Information
U. Ghia, University of Cincinnati, Cincinnati, Ohio.
M. Gressel, the National Institute for Occupational Safety and Health (NIOSH), Cincinnati, OH 45226.
S. Konangi, University of Cincinnati, Cincinnati, Ohio, 45213.
K. Mead, the National Institute for Occupational Safety and Health (NIOSH), Cincinnati, OH 45226.
A. Kishore, University of Cincinnati, Cincinnati, Ohio, 45213.
G. Earnest, the National Institute for Occupational Safety and Health (NIOSH), Cincinnati, OH 45226.
REFERENCES
- Chaoa CYH, Wana MP, Sze Toa GN. Transport and Removal of Expiratory Droplets in Hospital Ward Environment. Aerosol Science and Technology. 2008;42(5):377–394. [Google Scholar]
- Fluent Inc. Modeling Turbulence. 2006 Fluent 6.3 documentation. [Google Scholar]
- Holmes KR. Occupational and Environmental Skin Disease. Unpublished Data, http://users.ece.utexas.edu/~valvano/research/Thermal.pdf http://www.agius.com/hew/resource/lung.htm.
- Kowalski W, Bahnfleth WP. Airborne respiratory diseases and mechanical systems for control of microbes. HPAC: Heating, Piping, Air Conditioning. 1998 Jul; [Google Scholar]
- Mahajan RP, Singh P, Murthy GE, Aitkenhead AR. Relationship Between Expired Lung Volume, Peak Flow Rate and Peak Speed Time During a Voluntary Cough Maneuver. British Journal of Anesthesia. 1994;72(3):298–301. doi: 10.1093/bja/72.3.298. [DOI] [PubMed] [Google Scholar]
- NASA/SP-2010-3407, Man-Systems Integration Standard . Anthropometrics and Biomechanics. Vol. 1. Human Integration Design Handbook (HIDH); 2010. [Google Scholar]
- Pointwise Inc. Gridgen Version 15. 2011 [Google Scholar]
- Srebric J, Chen Q. Simplified Numerical Models for Complex Air Supply Diffusers. Int. J. of HVAC&R Research. 2002;8(3):277–294. [Google Scholar]
- VanSciver M, Miller S, Hertzberg J. Particle Image Velocimetry of Human Cough. Aerosol Science and Technology. 2011;45(3):415–422. [Google Scholar]


