
Figure 4. Validation of miRNAs expression in HCC on the TCGA dataset.
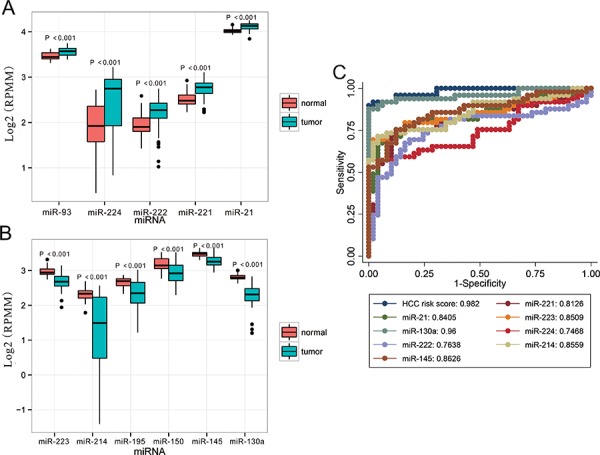
A. Upregulated miRNAs expression. B. Downregulated miRNAs expression. C. Performances of the miRNAs in HCC tissue classification. For boxplots, expression values of miRNAs were log2-transformed and box width was proportional to the square root of sample size in each variant. HCC risk score was built using LASSO regression model by R software: 0.180E_miR-221 + 0.0262E_miR-21 - 0.007E_miR-223 - 0.185E_miR-130a. E_miR-n = Log 2 (expression of microRNA n). HCC, hepatocellular carcinoma; miRNA, microRNA; TCGA, Tumor Cancer Genome Atlas.