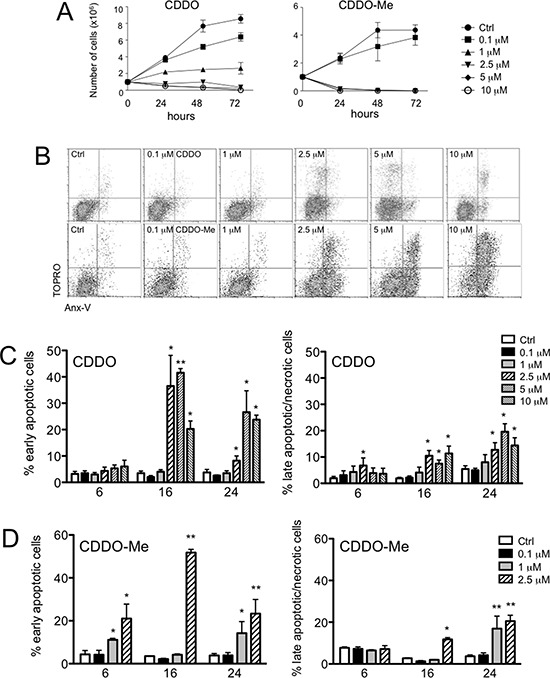
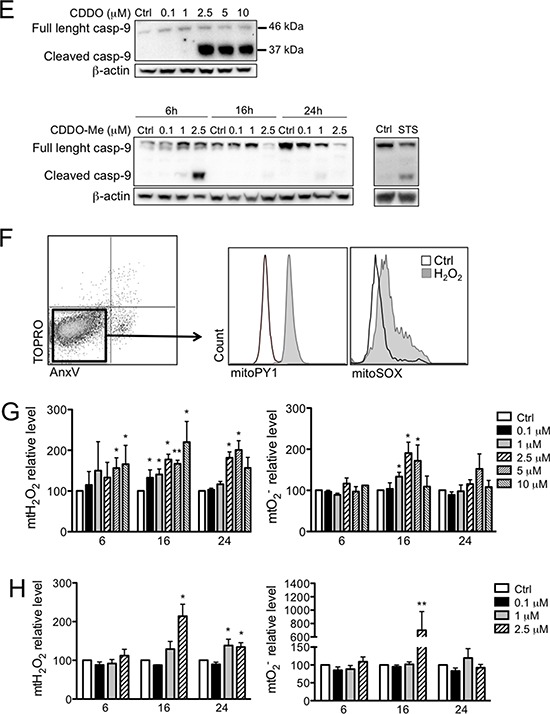
Figure 1. CDDO and CDDO-Me are anti-proliferative and induce apoptosis in RKO cells.


A. Growth curve of RKO cells incubated with the indicated concentrations of CDDO (left panel) or CDDO-Me (right panel) for up to 72 hours; DMSO-treated cells were considered as controls (Ctrl). B. Representative flow cytometric dot plots combining Annexin-V (AnxV) Alexa Fluor Pacific Blue and TO-PRO-3 iodide (TOPRO) staining in RKO cells treated with DMSO (Ctrl), or with increasing concentrations of CDDO or CDDO-Me for 24 hours. C. Percentage of early apoptotic cells (AnxV+/TOPRO- cells) and late apoptotic/necrotic cells (AnxV-/TOPRO+ and AnxV+/TOPRO+ cells) after treatment with the indicated concentrations of CDDO for up to 24 hours. Values represent the mean ± SD of five independent experiments, *P < 0.05 and **P < 0.01 vs. Ctrl. D. Percentage of early apoptotic cells and late apoptotic/necrotic cells after treatment with the indicated concentrations of CDDO-Me for up to 24 hours. Values represent the mean ± SD of five independent experiments, *P < 0.05 and **P < 0.01 vs. Ctrl. E. Western blot analyses showing caspase-9 activation in RKO cells after treatment with CDDO and CDDO-Me at the indicated concentrations. Cells treated with 1 μM staurosporine (STS) for 4 hours were used as positive controls for caspase-9 activation. F. Representative histograms showing MitoSOX Red Superoxide Indicator (mitoSOX) and Mitochondria Peroxy Yellow 1 (mitoPY1) to detect mitochondrial anion superoxide and mitochondrial hydrogen peroxide in living cells (i.e., those that were AnxV-/TOPRO- cells, indicated by the square). H2O2 was used as positive control. G. Quantification of mitochondrial hydrogen peroxide (mtH2O2) and mitochondrial anion superoxide (mtO2−) in RKO cells treated with CDDO up to 24 hours. Data are expressed as percentage of increase in median fluorescence intensity (MFI) and represent the mean ± SD of four independent experiments; *P < 0.05 and **P < 0.01 vs. Ctrl. H. Quantification of mtH2O2 and mtO2− in RKO cells treated with CDDO-Me for up to 24 hours. Data are expressed as percentage of increase in MFI and represent the mean ± SD of four independent experiments; *P < 0.05 and **P < 0.01 vs. Ctrl.
