
Figure 4. Inhibition of cell proliferation and expression of ADO receptors in CD4+ T cell subsets.
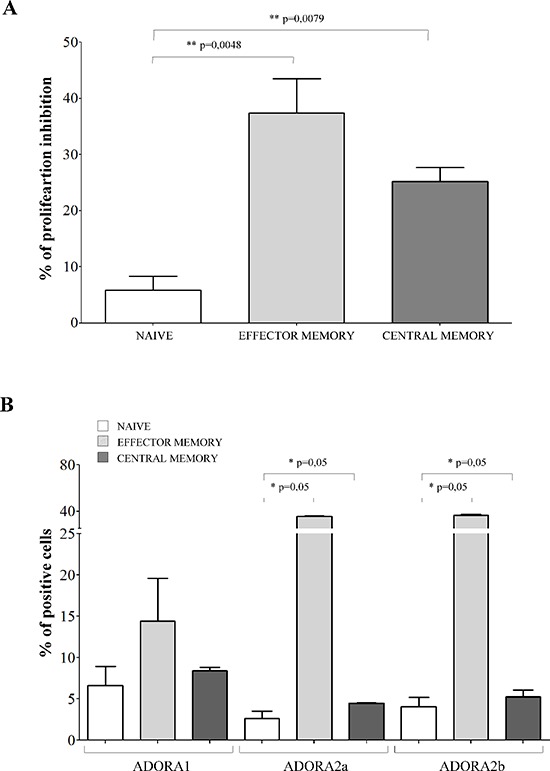
Panel A. Naïve (white bars), effector memory (light grey bars) and central memory (grey bars) CD4+ T lymphocytes were isolated and stimulated with anti-CD3/CD28 beads in the presence or absence of melanoma cell lines at 1:16 melanoma:T cell ratio. T cell proliferation was assessed by CFSE dilution using a flow cytometer. Results are expressed as % of inhibition, calculated as follows: % of proliferating cells in the absence of melanoma cells - % of proliferating cells in the presence of melanoma cells/% of proliferating cells in the absence of melanoma cells. Mean of 6 experiments ± SD is shown. p values are indicated where differences are statistically significant. Panel B. ADORA1, A2a, A2b was investigated by flow cytometry on purified CD4+ T cells, gating on naïve (white bars), effector memory (light gray bars) and central memory (grey bars). Data are expressed as % of positive cells. Mean of four different experiments ± SD is shown. p values are indicated where differences are statistically significant.