
Figure 4. NOP14 inhibits migration and invasion via NRIP1.
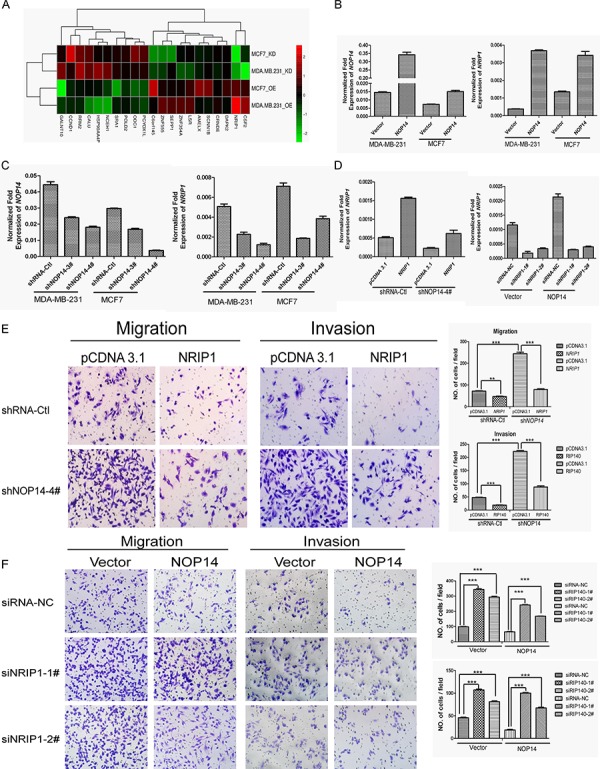
A. Gene expression array results for NOP14-overexpressed and NOP14-knockdown cells compared with corresponding control cells. OE, overexpression group; KD, knockdown group. B, C. qPCR of NOP14 and NRIP1 in NOP14 stable and control cell lines. D. qPCR of NRIP1 in transiently transfected cells. E, F. Transwell assays. The results are summarized as the mean ± 3SD of three independent experiments as shown in the right panel (***P < 0.001, independent Student's t test).