
Figure 6. Cancer patients exhibiting low tumoural CALR levels show poor clinical prognosis in response to paclitaxel and radiotherapy.
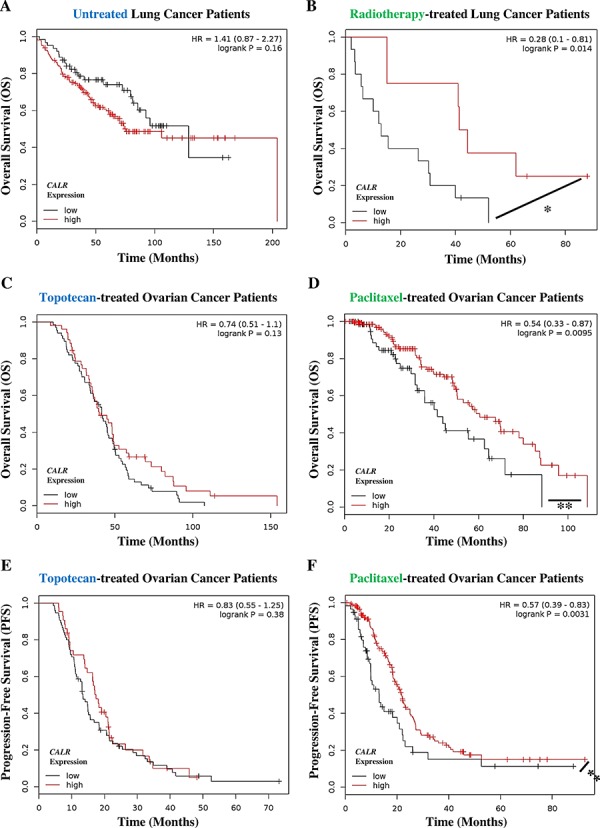
A, B. Lung cancer patients not treated with any therapy (i.e. untreated, n = 227) (A) or treated with radiotherapy only (n = 23) (B) were stratified into high (red lines) or low (black lines) expression-based “risk-groups” by considering the median of the overall transcript-expressions of CALR (untreated – low n = 63, high n = 164; radiotherapy – low n = 15, high n = 8). This was followed by Kaplan-Meier plotting of the patient's overall survival (OS) (Y-axis). C–D. Ovarian cancer patients treated with topotecan only (n = 119) (C) or treated with paclitaxel only (n = 220) (D) were stratified into high (red lines) or low (black lines) expression-based “risk-groups” by considering the median of the overall transcript-expressions of CALR (topotecan – low n = 67, high n = 52; paclitaxel – low n = 69, high n = 151). This was followed by Kaplan-Meier plotting of the patient's OS (Y-axis). E–F. Ovarian cancer patients treated with topotecan only (a = 118) (E) or treated with paclitaxel only (n = 229) (F) were stratified into high (red lines) or low (black lines) expression-based “risk-groups” by considering the median of the overall transcript-expressions of CALR (topotecan – low n = 75, high n = 43; paclitaxel – low n = 57, high n = 172). This was followed by Kaplan-Meier plotting of the patient's progression-free survival (PFS) (Y-axis). In all the above graphs, respective log-rank test p-values and hazard ratios (HR; with its 95% confidence interval in parenthesis) are displayed. Statistical significance (i.e. p < 0.05 or p < 0.001) is indicated through an asterisk (* or **).