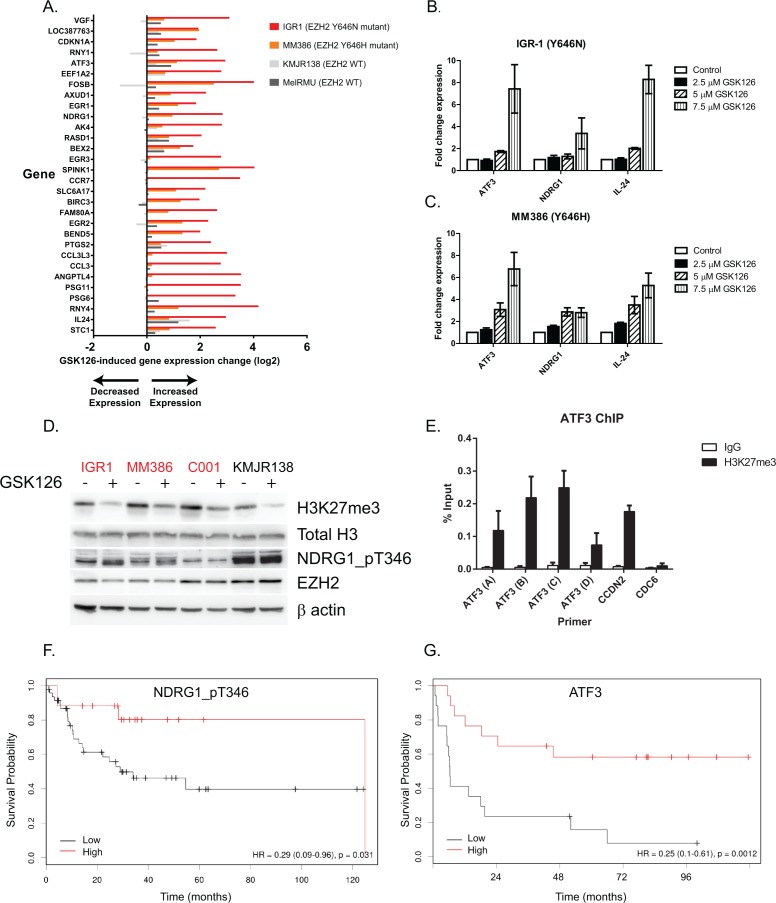
Figure 5. GSK126 causes cell growth inhibition via de-repression of tumor suppressor genes.
Microarray analysis of the top 30 most differentially expressed genes following 48 hr of 7.5 μM GSK126 treatment. Two sensitive (apoptosis) EZH2Y646 mutant cell lines were selected (IGR1 and MM386) along with a sensitive WT (KMJR138) and an insensitive cell line (MEL-RMU) performed in duplicate. A. The top candidates with known tumor suppressor gene functions were validated by RT-qPCR in IGR1 B. and MM386 C. mutant cells. Western blot of cell lines treated for 48 hr with 7.5 μM GSK126 showing the effect on NDRG1_pT346 protein D. ChIP-qPCR (n = 2) in MM386 cells showing enrichment of H3K27me3 upstream of the transcription start site (primers (A–C) but not downstream (primer D) of the ATF3 gene promotor. CCND2 was used as a positive control and CDC6 as a negative control E. Survival analysis (Cox proportional hazard model) of reverse phase protein array (RPPA) data from 31 TCGA melanoma patients divided into high (>0.2963) or low (<0.2963) NDRG1_pT346 protein expression F. Survival analysis (Kaplan-Meier) of microarray data from 34 stage III melanoma patients [55] divided into high (upper 75th percentile) or low (lower 25th percentile) ATF3 mRNA expression G. Mutants are indicated in red.

