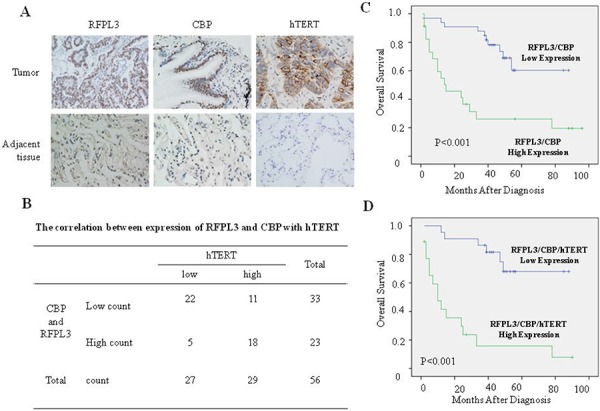
Figure 3. High expression of RFPL3, CBP and hTERT in lung adenocarcinomas tissues and their correlation with poor prognosis of patients with lung cancer.

A.The expression of RFPL3, CBP and hTERT protein in lung tumor tissues and corresponding adjacent normal lung tissues by immunohistochemistry analysis (magnification, × 200). If the final score was equal or bigger than four, the protein was considered high expression; otherwise, the protein was considered low expression. B. The relative quantitative analysis of hTERT protein expression in lung tumor tissues with both RFPL3 and CBP high expression or low expression. C. Kaplan–Meier analysis of overall survival of lung cancer patients with different RFPL3 and CBP expression (p < 0.001, log-rank test). D. Kaplan–Meier analysis of overall survival of lung cancer patients with different RFPL3, CBP and hTERT expression (p < 0.001, log-rank test).
