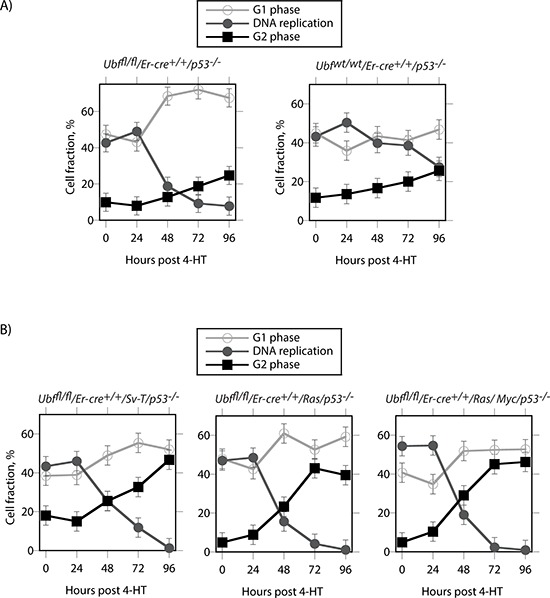
Figure 8. Cell cycle distribution of p53-null cells during UBF depletion.

A. Untransformed Ubffl/fl/Er-cre+/+/p53−/− and Ubfwt/wt/Er-cre+/+/p53−/− MEFs. B. The same p53-null MEFs after transformation with SV40Tt, Ras or Ras plus Myc oncogenes. The graphics show the cell cycle distributions obtained from FACS analyses for active DNA replication (Click-iT® EdU) and G1 and G2 DNA content (propidium iodide, PI).
