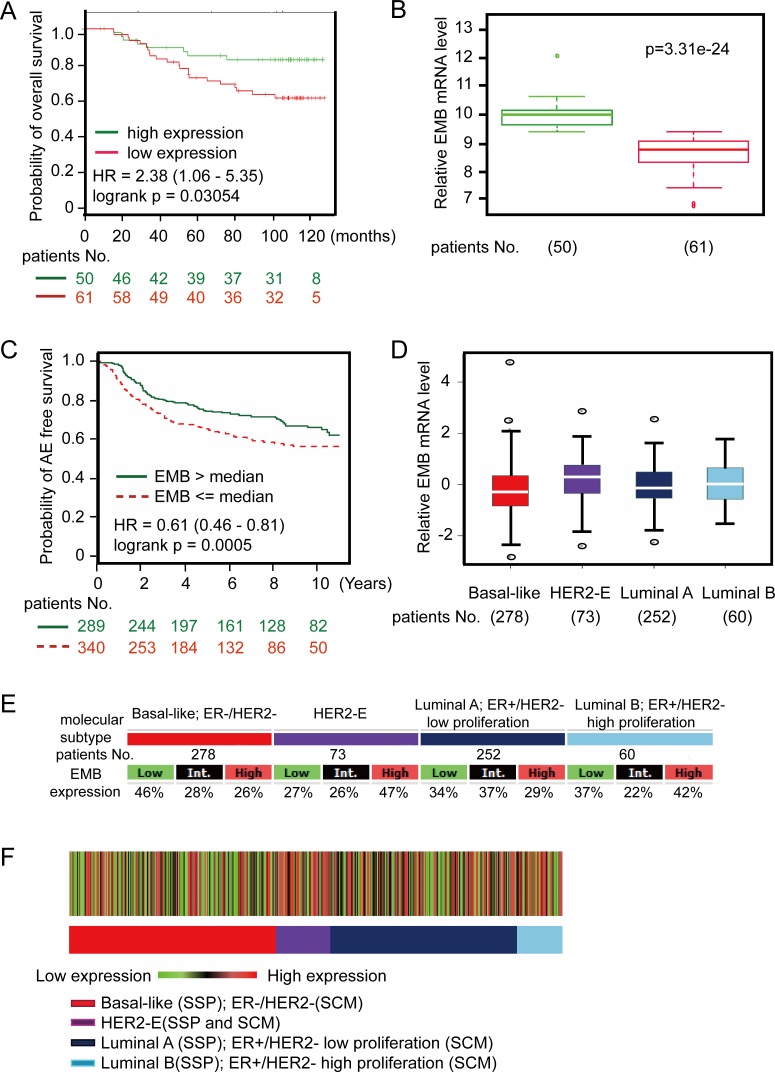
Figure 7. Embigin expression is low in basal-like breast cancer clinical samples and are negatively associated with survival of patients with basal-like cancers.
A. Kaplan-Meier curve showing overall survival of breast cancer patients with high or low embigin expression (logrank p = 0.003054). Data were analyzed using SurvExpress web program with GSE19536, and the patient samples were split into two groups according prognostic index (PI). B. Box plot shows embigin expression between high risk group (red, 61 patients) and low risk group (green, 50 patients). Data were analyzed using SurvExpress web program with GSE19536. C. Kaplan-Meier curve showing any-event free survival of basal-like tumors with high or low embigin expression (logrank p = 0.0005). Data were analyzed using bc-GenExMiner web application, and the patient samples (629 samples) were split into two groups according to median expression of embigin (high expression group: 289 samples; low expression group: 340 samples). D. The graph shows embigin expression levels on breast cancer subtype with patients No. indicated. E. Embigin expression table. For each breast cancer subtype, the number of samples and the percentages of tumors with low, intermediate, or high embigin mRNA expression are indicated. F. Heatmap of embigin gene expression on patients based on robust single sample predictor (SSP) classification with the three SSPs. Percentage of tumors with high, intermediate, and low embigin expression per molecular subtype are given in the gene expression table.

