

Abstract
Low molecular weight chitosan (LMWC) is a promising polymer for surface modification of nanoparticles (NPs), which can impart both stealth effect and electrostatic interaction with cells at mildly acidic pH of tumors. We previously produced LMWC-coated NPs via covalent conjugation to poly(lactic-co-glycolic) acid (PLGA-LMWC NPs). However, this method had several weaknesses including inefficiency and complexity of the production as well as increased hydrophilicity of the polymer matrix, which led to poor drug release control. Here, we used the dopamine polymerization method to produce LMWC-coated NPs (PLGA-pD-LMWC NPs), where the core NPs were prepared with PLGA that served best to load and retain drugs and then functionalized with LMWC via polydopamine layer. The PLGA-pD-LMWC NPs overcame the limitations of PLGA-LMWC NPs while maintaining their advantages. First of all, PLGA-pD-LMWC NPs attenuated the release of paclitaxel to a greater extent than PLGA-LMWC NPs. Moreover, PLGA-pD-LMWC NPs had a pH-dependent surface charge profile and cellular interactions similar to PLGA-LMWC NPs, enabling acid-specific NP-cell interaction and enhanced drug delivery to cells in weakly acidic environment. Although the LMWC layer did not completely prevent protein binding in serum solution, PLGA-pD-LMWC NPs showed less phagocytic uptake than bare PLGA NPs.
Keywords: Nanoparticles, drug delivery, low molecular weight chitosan, pH-sensitive, sustained release, dopamine polymerization
1. Introduction
Delivering drugs specifically to tumors remains a major challenge in chemotherapy. Once administered intravenously, chemotherapeutic agents spread to the whole body, causing adverse effects to healthy tissues [1]. Polymeric nanoparticles (NPs) have been developed as way of improving tumor-specificity of drug delivery. The popularity of NPs is mainly attributable to the so-called `enhanced permeability and retention (EPR) effect' based on the leaky vasculature and impaired lymphatic drainage of tumors, which provides a selective advantage for small particles in accessing tumors compared with free drugs [2–4]. To take advantage of the EPR effect, NPs should be able to circulate avoiding immune surveillance, until they reach tumors. Upon arrival at target tumors, NPs should be stably retained in the tissues and/or taken up by cancer cells to release the loaded drug. Traditionally, NPs are coated with hydrophilic neutral polymers such as polyethylene glycol (PEG), which sterically stabilizes the NPs and delays adsorption of plasma proteins to the surface [5, 6], to achieve long-term circulation. However, the PEG surface can also limit cellular interactions with target cells and cellular internalization, creating a `PEG dilemma' [7, 8].
As a way of overcoming the dilemma, we previously proposed a low molecular weight chitosan (LMWC) as an alternative surface layer [9]. Chitosan is a linear polyaminosaccharide with a pKa value close to 6.5, which helps establish electrostatic interactions with negatively charged cell membrane in weakly acidic microenvironment of tumors (pH 6.8–7.2) [10]. At neutral pH, chitosan coated on polymeric NPs protects them from phagocytic uptake [11] and prolongs their circulation time [12]. By reducing the MW to <6.5 kDa, we intended to increase hydrophilicity of the polymer and reduce pH-independent interactions with cells mediated by polymer chain entanglement, further improving its protective effect at neutral pH [9]. We obtained the proof of concept in the previous study, using NPs produced with poly(lactic-co-glycolic) acid (PLGA) covalently conjugated to LMWC via an amide bond (PLGA-LMWC) [9]. The PLGA-LMWC NPs, consisting of PLGA core and LMWC surface, showed a pH-sensitive surface charge profile, which translated to NP-cell interactions at weakly acidic pH with reduced phagocytic uptake and little non-specific NP-cell interactions at neutral pH [9].
However, the covalent conjugation of LMWC to PLGA had several drawbacks. First, the chemical conjugation procedure is lengthy and inefficient and requires reactive reagents and catalysts that need to be completely removed after the reaction. Moreover, the conjugation process reduces the potential of NPs as a drug carrier. LMWC conjugation requires a sufficient number of carboxyl termini, which necessitates the use of a low molecular weight PLGA (4 kDa, PLGA4). This polymer is relatively hydrophilic and, thus, has an inherent limitation in encapsulating hydrophobic drugs. Covalent conjugation of LMWC makes the product even more hydrophilic, further compromising the ability of the formed NPs to load and retain a drug. Prolonged reaction in basic pH also accelerates degradation of the polymer and aggravates the problem. Consequently, PTX-loaded PLGA4-LMWC NPs showed a rapid drug release in PBS with 0.1% Tween 80 in 24 hours [9]. NPs showing high initial burst release are likely to release the drug in circulation and not contribute to improving tumor-specific drug delivery; therefore, these shortcomings should be overcome for the LMWC-coated NPs to make further contribution to chemotherapy.
In an attempt to overcome this challenge, we have employed a new surface modification method based on dopamine polymerization [13], which has been used to functionalize several nanostructures including nanowires [14], carbon nanospheres [15], gold nanoclusters [16] and gold nanorods [17], and validated that the new method can effectively functionalize polymeric NPs with different types of ligands [18, 19]. The dopamine polymerization method depends on oxidation of dopamine catechol, followed by the formation of polydopamine (pD) layer on the NP surface, where functional ligands with amine or thiol are covalently conjugated. This method can be implemented in mild conditions such as brief exposure to pH 8.5, UV light [20], or oxidants [21], does not require reactive reagents or lengthy reaction, and can be applied to a broad range of surface modifiers and NP platforms [13, 18]. Once dopamine polymerizes, it loses its dopaminergic activity [18], and the resulting pD is biodegradable and biocompatible with a LD50 of 483.95 mg/kg in mice after intravenous injection [22].
In this study, we use the dopamine polymerization method to produce LMWC-coated NPs (Fig.1) based on the flexibility in controlling drug release. Here, LMWC molecules are incorporated into the pD layer on PLGA NPs via multiple amine groups. Since LMWC is introduced as an addendum to pre-formed NPs via the pD layer, the core NPs can be prepared with polymers that serve best to load and retain drugs, not constrained by the needs for carboxyl termini or the hydrophilicity of the modified polymer. We demonstrate that PLGA NPs modified with LMWC via dopamine polymerization method overcome the previously observed limitations of PLGA4-LMWC NPs and show the desired pH-sensitivity in cell interaction and drug delivery and the tendency to avoid phagocytic uptake, similar to PLGA4-LMWC NPs. We also investigate NP-cell interactions at acidic pH and their intracellular trafficking and discuss their implications in drug delivery to tumor tissues.
Fig. 1.
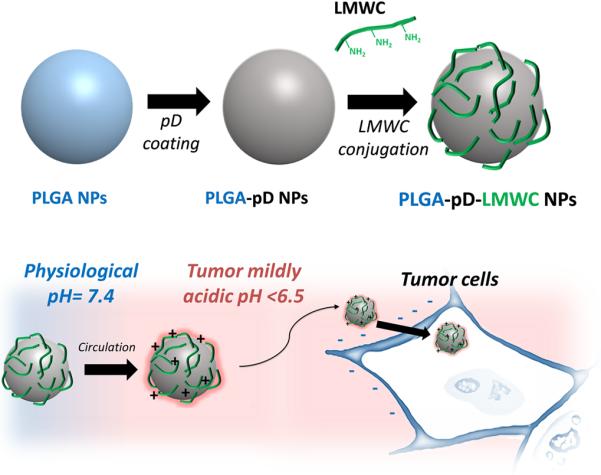
Schematic diagram of PLGA-pD-LMWC NPs preparation and pH-dependent cell-NP interaction.
2. Methods
2.1. Materials
Chitosan (90-150 kDa) was purchased from Sigma-Aldrich (MO, USA). PLGA (acid end cap, 4 kDa, LA:GA=50:50, PLGA4) was purchased from Durect Corp (AL, USA). PLGA (118 kDa, LA:GA= 65:35, PLGA118) was purchased from Lakeshore Biomaterials (AL, USA). PLGA (150 kDa, LA:GA=85:15, PLGA150) and fluorescein-conjugated PLGA (7 kDa, LA:GA=50:50, *PLGA) were purchased from Akina Inc. (IN, USA). Paclitaxel (PTX) was a gift from Samyang Genex Corp (Seoul, Korea). LysoTracker Red DND-99, CellMask Deep Red plasma membrane stain, and Hoechst 33342 were purchased form Life Technologies (CA, USA). Methoxy PEG amine, HCl salt (5 kDa, mPEG-NH2) was purchased from JenKem Technology USA (TX, USA). Dopamine hydrochloride was purchased from Alfa Aesar (MA, USA). Coomassie Brillant blue G-250 protein stain and sodium dodecyl sulfate-acrylamide gel electrophoresis (SDS-PAGE) molecular weight standards were purchased from Bio-Rad (CA, USA).
2.2. Preparation and characterization of LMWC
LMWC was prepared by as previously described [9]. Briefly, 25 mg/mL of chitosan solution was incubated in 33% hydrogen peroxide for 3.5 hours, dialyzed against water with a molecular weight cut-off (MWCO) of 3500 Da, and freeze-dried. The molecular weight of LMWC was estimated by matrix-assisted laser desorption ionization time-of-flight/time-of-flight (MALDI-TOF/TOF) analysis and analytical ultracentrifugation (AUC). For mass spectrometry, 1 mg/mL LMWC solution was prepared in acidified water (pH 5), filtered with a 0.2 μm syringe filter, and mixed with a matrix (sinapinic acid solution in acetonitrile/water (50:50) containing 0.1% trifluoroacetic acid) in 1:1 ratio. Mass analysis was performed with a 4800 MALDI TOF/TOF instrument (Applied Biosystems, USA) in 2000–8000 m/z range. For AUC, LMWC solution in sodium acetate buffer (pH 4.3, 10 mM) was prepared in 1, 0.5 and 0.25 mg/mL and analyzed with a Beckman Optima XL-I ultracentrifuge (Beckman Coulter Inc., CA, USA). The sedimentation coefficients and apparent molecular weights were calculated from size distribution analysis with SEDFIT v.12.0. The pH dependence of water solubility of LMWC was estimated by measuring the transmittance of LMWC solution (0.5 mg/mL) varying the pH from 2.5 to 10 with NaOH. % Transmittance (%T) was calculated as 10−A ×100, where A was the absorbance of the solution at 500 nm.
2.3. Preparation of particles
2.3.1. PLGA4-LMWC NPs
A covalent conjugate PLGA4-LMWC was prepared as described previously [9]. Briefly, 200 mg of LMWC was dissolved in acidified water (20 mL, pH 5) and added to 40 mL dimethyl sulfoxide (DMSO). Five hundred milligrams of PLGA4 was dissolved in 2 mL of dichloromethane (DCM), to which hydroxybenzotriazole (HOBT) (74.3 mg), 1-Ethyl-3-(3-dimethylaminopropyl) carbodiimide (EDC) (106.2 μL), and tetramethylethylenediamine (TEMED) (269.9 μL) were sequentially added. The activated PLGA4 was added to LMWC solution dropwise and stirred overnight. The formed conjugate, PLGA4-LMWC, was purified by dialysis (MWCO: 3500 Da) against a mixture of DMSO and water (50:50) and then water, freeze-dried, and stored at −20°C.
PLGA4-LMWC NPs were prepared using the single emulsion solvent evaporation method. Twenty milligrams of PLGA4-LMWC were dissolved in a mixture of 0.5 mL DMSO, 0.5 mL DCM and 0.1 mL water, optionally with 1.2 mg of paclitaxel (PTX). The organic phase was emulsified in 5 mL of aqueous phase containing 5% polyvinyl alcohol (PVA) using a Vibra-Cell probe sonicator (Sonics, Newtown, CT, USA) at 80% amplitude with a 4-s on and 2-s off pulse mode. The emulsion was dispersed in 10 mL of deionized water and stirred for 3 hours to evaporate DCM. NPs were collected via centrifugation at 10,000 rpm for 30 minutes and washed three times. Fluorescently labeled PLGA4-LMWC NPs (*PLGA4-LMWC NPs) were prepared by replacing 25% of polymer with *PLGA.
2.3.2. PLGA-pD-LMWC and PLGA-pD-PEG particles
PLGA-pD-LMWC NPs were prepared by coating pre-formed particles with LMWC via the dopamine polymerization method [18]. First, the core NPs were prepared with PLGA polymers with different molecular weights and LA:GA ratios (PLGA118: 118 kD, LA:GA=65:35 and PLGA150: 150 kD, LA:GA=85:15) by the single emulsion solvent evaporation method as described in section 2.3.1. PLGA microparticles (MPs) were prepared in a similar way except that the emulsification process was performed with a Silverson L4R Laboratory Mixer (East Longmeadow, MA, USA) for 1 minute at 5,000 rpm. The core particles were then prime-coated with polymerized dopamine (pD) by incubation in 1 mg/mL dopamine solution in Tris buffer (pH 8.5, 10 mM) for 3 hours at room temperature. The pD-coated particles were collected by centrifugation, washed two times, and incubated with LMWC aqueous solution (pH 7.5, 0.5 mg/mL) for 40 minutes to produce PLGA-pD-LMWC particles. For comparison, PEG-modified (PLGA-pD-PEG) particles were created by incubating the pD-coated particles in mPEG-NH2 solution (pH 8.5, 2 mg/mL). The particles were collected by centrifugation and washed two times to remove excess LMWC or mPEG-NH2. Throughout this study, PLGA particles refer to PLGA150 particles unless stated otherwise.
2.4. Particle characterization
Particle size and zeta potential of particles were determined using a Malvern Zetasizer Nano ZS90 (Worcestershire, UK). The size was measured with particles dispersed in phosphate buffer (2.2 mM, pH 7.4). The zeta potential was determined at different pHs with particles dispersed in phosphate buffer (2.2 mM, pH 7.4) or MES buffer (5 mM, pH 6.2). Particle morphology was observed by transmission electron microscopy (TEM). An aqueous suspension of freshly prepared NPs (0.5–1 mg/mL) was spotted on a formvar-coated carbon grid (400 mesh) and negatively stained with 2% uranyl acetate solution. The grid was air-dried and examined with a FEI Tecnai T20 transmission electron microscope (OR, USA).
The LMWC content in PLGA-pD-LMWC NPs was quantified by the ninhydrin assay. The ninhydrin reagent was prepared by dissolving ninhydrin and hydrindantin in lithium acetate buffer [9, 23]. 0.5 mg of freeze-dried NPs were dispersed in 0.5 mL water and combined with 0.5 mL of fresh reagent. The mixture was heated in boiling water for 30 minutes, then cooled and quenched with 15 mL of 50% ethanol solution. The absorbance of the solution was read at 570 nm using SpectraMax M3 microplate reader (Molecular Device, Sunnyvale, CA). The amount of LMWC per NP sample was calculated after subtracting the background absorbance of PLGA-pD NPs, using a calibration curve drawn with LMWC solutions of known concentrations.
2.5. In-vitro PTX release kinetics from PLGA4-LMWC and PLGA-pD-LMWC NPs
To determine PTX loading in NPs, freeze-dried NPs were accurately weighed and dissolved in 0.5 mL acetonitrile. After precipitating polymer with the addition of 0.5 mL deionized water, the sample was centrifuged, and the supernatant analyzed via high pressure liquid chromatography (HPLC). The drug loading in NPs (DL%) was calculated as the amount of PTX per NP mass. For in-vitro release studies, NPs equivalent to 8.75 μg PTX were dispersed in 1 mL of phosphate-buffered saline (PBS, pH 7.4) containing 0.2% Tween 80 and shaken at 37°C. At regular time points, NP suspension was centrifuged at 12,000 rpm for 15 min, 0.8 mL of supernatant was sampled and replaced with 0.8 mL of fresh buffer, and the pellet was resuspended and returned for continued incubation. The sampled supernatant was filtered with a 0.45 μm syringe filter and analyzed by HPLC. HPLC analysis was performed with an Agilent 1100 HPLC system (Palo Alto, CA), equipped with Ascentis C18 column (25 cm × 4.6 mm, particle size 5 μm). The mobile phase was a 50:50 mixture of water and acetonitrile run at a flow rate of 1 mL/min. PTX was detected by a UV detector (227 nm).
2.6. Protein adsorption to NP surface
NPs were incubated with 50% fetal bovine serum (FBS) in PBS at 37°C with shaking for 1 or 24 hours. NPs were collected by centrifugation at 13,200 rpm and washed 3 times with water to remove excess and loosely bound proteins. To strip off hard corona proteins from NP surface, NPs were boiled in sample buffer containing 5-mercaptoethanol and 2% SDS for 5 minutes. The sample was analyzed with SDS-PAGE. The resolved protein bands were stained with Coomassie brilliant blue G-250. The molecular weight of band of interest was determined using GelAnalyzer 2010a software (www.GelAnalyzer.com). Briefly, a calibration curve was constructed with a plot of the relative migration distance (Rf) of standard bands versus their MWs and used to determine the MW of resolved bands in each gel. The intensity of different bands was quantified using ImageJ 1.48v software densitometry analysis (National Institute of Health, MD, USA).
2.7. NP-cell interactions
2.7.1. Cell culture
SKOV-3 human ovarian cancer cells (ATCC, Manassas, VA, USA) were grown in RPMI-1640 medium containing 10% FBS, 100 units/mL of penicillin and 100 μg/mL of streptomycin. J774A.1 mouse macrophages (ATCC) were grown in DMEM medium supplemented with 10% FBS, 100 units/mL of penicillin and 100 μg/mL of streptomycin. All cell experiments were performed in the FBS-supplemented medium.
2.7.2. Quantitative analysis of cell-particle interactions
SKOV-3 cells and J774A.1 macrophages were seeded in 6-well plates at a density of 500,000 cells per well and incubated overnight. Next day, the medium was replaced with fresh medium that contained 0.1 mg/mL of fluorescently labeled NPs or MPs (*NPs or *MPs). For SKOV-3 cells the medium pH was adjusted to 6.2 or 7.4. After 3 hours, cells were harvested by trypsinization (SKOV-3) or scraping (J774A.1), dispersed in fresh medium of corresponding pH, and analyzed with a FC500 flow cytometer (Beckman Coulter, Indianapolis, IN, USA). At least 10,000 gated events were acquired, and data was analyzed with the FlowJo software (Treestar, CA, USA).
2.7.3. Visualization of cell-particle interactions
NP interaction with SKOV-3 cells was observed with confocal microscopy. SKOV-3 cells were seeded in a 35 mm glass bottomed dish (MatTek) at a density of 500,000 cells per dish. After overnight incubation, the medium was replaced with fresh RPMI medium adjusted to pH 6.2 or 7.4, which contained 0.1 mg/mL of *NPs. After 3 hours of incubation, the medium was removed, and the cells were washed with fresh medium twice to remove free and loosely-bound *NPs. Cells were incubated with Hoechst 33342 nuclear staining dye at 5 μg/mL for 10 minutes, and imaged with a Nikon-A1R confocal microscope (Nikon America Inc., NY, USA). The *NPs were excited with a 488 nm laser, and the emission was read from 500 to 550 nm. The cell nuclei were excited with a 407 nm laser, and the emission was read from 425 to 475 nm.
To locate NPs in SKOV-3 cells, cells were further stained with CellMask Deep Red (Life Technologies) or LysoTracker Red DND-99 (Life Technologies) for labeling the plasma membrane or acidic intracellular organelles (late endosomes and lysosomes), respectively. Cells were incubated with *NPs in the same manner as above. After removing *NPs, CellMask Deep Red was added at 5 μg/mL or LysoTracker Red at 30 nM. Cells were incubated with each marker for 40 min, washed twice with fresh medium at corresponding pH, stained with Hoechst 33342, and imaged with a Nikon A1R confocal microscope. Stained plasma membrane was excited at 639 nm, and emission was collected from 663 to 738 nm. LysoTracker stained organelles were excited at 561 nm, and the emission was collected from 570 to 620 nm.
Time-lapse confocal microscopy was performed to examine the time course of cellular uptake and intracellular trafficking of *PLGA-pD-LMWC NPs. SKOV-3 cells were seeded in a glass bottomed dish at a density of 500,000 cells per dish. After overnight incubation, the medium was replaced with 1 mL of fresh medium adjusted to pH 6.2, and cells were stained with LysoTracker Red DND-99 and Hoechst 33342. The dish was put in an environmental chamber, supplied with 5% CO2, and mounted on Nikon A1R confocal microscope. The chamber, microscope stage, and objective lens were heated to 37°C. *PLGA-pD-LMWC NPs (0.1 mg) was added to the dish, and the cells were imaged over 4.5 hours.
Macrophage uptake of *MPs was visualized with fluorescence microscopy. J774A.1 macrophages were seeded in a 24-well plate at a density of 100,000 cells per well and incubated overnight. The medium was replaced with fresh one containing 0.1 mg/mL *MPs. After 3 hours, the medium was removed, and cells were washed with fresh medium twice. The cells were stained with Hoechst 33342 and imaged with a Cytation-3 imaging system (BioTek, USA).
2.8. Paclitaxel delivery to cancer cells by NPs
Cellular uptake of PTX delivered by NPs was estimated at different pHs. SKOV-3 were seeded at a density of 200,000 cells per well in a 12-well plate. Next day, the medium was replaced with 0.8 mL of fresh medium of pH 6 or 7.4, which contained PTX-loaded PLGA-pD-LMWC- or PLGA-pD-PEG NPs equivalent to 4.8 μg of PTX. Free PTX dissolved in DMSO solution was added at the same concentration to a control group. The total amount of DMSO added to 0.8 mL of medium was 12 μL and non-toxic to the cells. After 2.5 hours at 37°C, the medium was removed, and cells were trypsinized, suspended in fresh medium of corresponding pH, and centrifuged at 2,000 rpm to separate cells from NPs. The cell pellet was lysed by three freeze-thaw cycles, suspended in 0.5 mL PBS, and probe sonicated. The cell lysate was spiked with 35 μg of carbamazepine as an internal standard, extracted with 1.5 mL of ethyl acetate for 40 min, and centrifuged at 4,000 rpm for 25 minutes to separate ethyl acetate layer. 1.3 mL of ethyl acetate were dried under vacuum in a glass tube and reconstituted with 1:1 acetonitrile/water solution and analyzed with HPLC. A PTX calibration curve was drawn with different amounts of PTX added to cell suspension in PBS and treated in the same way.
3. Results
3.1. Particle preparation and characterization
LMWC was produced by H2O2 digestion. Three and a half hour digestion in 33% H2O2 reduced the chitosan molecular weight from 90-150 kDa to 4.8 kDa, consistent our the previous study [9]. The MALDI spectrum of LMWC showed a peak at ~4800 m/z (Supporting Fig.1). The AUC analysis confirmed the result with additional insight into the structure. The global analysis of fitted data identified two species with apparent MWs of 2.5 and 7.3 kDa, existing in a dynamic mixture in solution. The frictional coefficient ratio (f/fo) was ~2.2, which indicated that LMWC had a semi-flexible rod shape, in agreement with existing studies [24]. LMWC was soluble in water over a wide range of pH including 7–9, where the parent chitosan was not soluble (Supporting Fig. 2).
LMWC-coated NPs were produced with a polymer pre-conjugated with LMWC (PLGA4-LMWC NPs) or by LMWC conjugation via pD to the pre-formed PLGA NPs (PLGA-pD-LMWC NPs). PLGA4-LMWC NPs or pre-formed core PLGA NPs showed similar sizes, 160 nm and 158 nm, respectively (Fig. 2a). LMWC or PEG-NH2 coating via pD increased the size to 209 nm (Fig. 2a). The size increase is likely due to the aggregation by additional centrifugation rather than the thickness of the conjugated layer, given that the polydispersity increased with coating (Fig. 2a) and individual NPs observed with TEM showed similar sizes irrespective of the coating (Fig. 3, Supporting Fig. 4). TEM of negatively stained NPs revealed thin layer of pD coating on the NP surface. However, no other difference was observed in NPs further conjugated with LMWC or PEG-NH2.
Fig. 2.
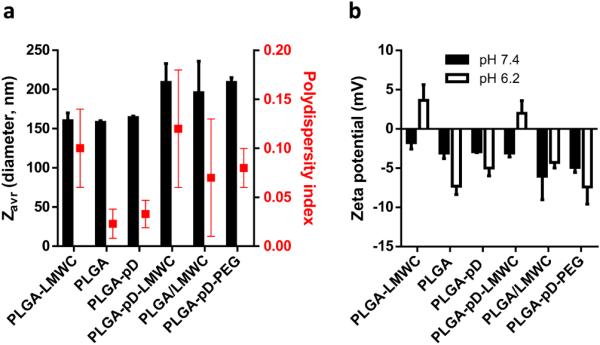
Particle size and surface charge of NPs: (a) Average diameter (Zavg) and polydispersity index and (b) zeta potential at pH 7.4 and 6.2.
Fig. 3.
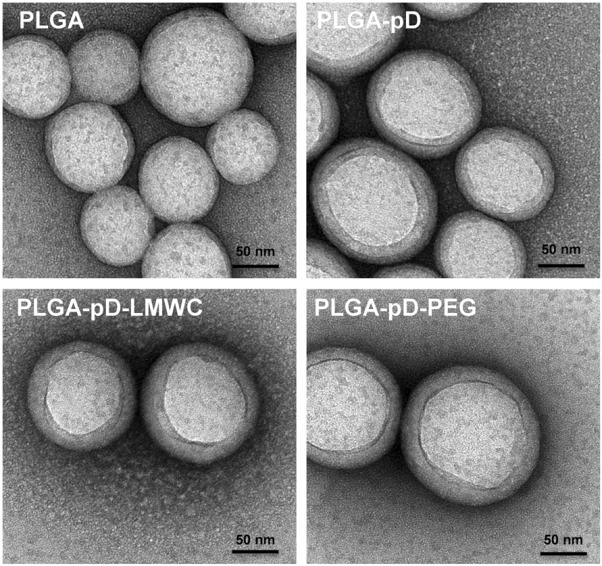
Transmission electron microscopy (TEM) images of NPs negatively stained with 2% uranyl acetate. Scale bar: 50 nm.
Although the presence of LMWC or PEG conjugated to pD were not visually identified in TEM images, their immobilization was confirmed by the altered surface properties. PLGA-pD-LMWC NPs showed a characteristic pH-dependent charge profile, negative at pH 7.4 and positive at pH 6.2, similar to PLGA4-LMWC NPs. PLGA NPs, PLGA-pD NPs, and PLGA-pD-PEG NPs remained negatively charged irrespective of the pH (Fig. 2b, Supporting Fig. 3b). PLGA NPs incubated with LMWC without pD prime coating (PLGA/LMWC NPs) did not show the pH-dependent charge profile, indicating that LMWC did not physically adsorb to PLGA and the LMWC immobilization depended on the pD layer. The LMWC content in PLGA-pD-LMWC NPs was determined to be 4.7±3% according to the ninhydrin assay, lower than the estimated value for PLGA4-LMWC NPs (8.7±1.5%) [9].
3.2. In-vitro PTX release kinetics from NPs
PLGA4-LMWC NPs and PLGA-pD-LMWC NPs were compared with respect to the DL of PTX and in-vitro PTX release. PLGA4-LMWC NPs showed a DL of 27.9±7.9%, higher than the theoretical DL (5.7%), which suggested partial loss of PLGA4-LMWC polymer during NP preparation [9]. PLGA-pD-LMWC NPs made of PLGA118 and PLGA150 showed DL's of 12.8±5.3% and 8.6±3.4%, corresponding to 77.0% and 51.7% of the theoretical DL (16.7%), respectively. In-vitro PTX release kinetics study was performed in PBS containing 0.2% Tween 80 (pH 7.4). PLGA4-LMWC showed initial burst release in this medium, releasing 90.4±8.5% of the loaded dose in 7 hours. On the other hand, PLGA118-pD-LMWC and PLGA150-pD-LMWC NPs released PTX more slowly: 54.2±5.5% and 39.9±9.0% of the total dose in 7 hours, reaching ~80% release in 48 hours (Fig. 4). Since PLGA150-pD-LMWC NPs retained PTX most stably, they were used in the rest of the study, referred to as PLGA-pD-LMWC NPs without a subscript.
Fig. 4.
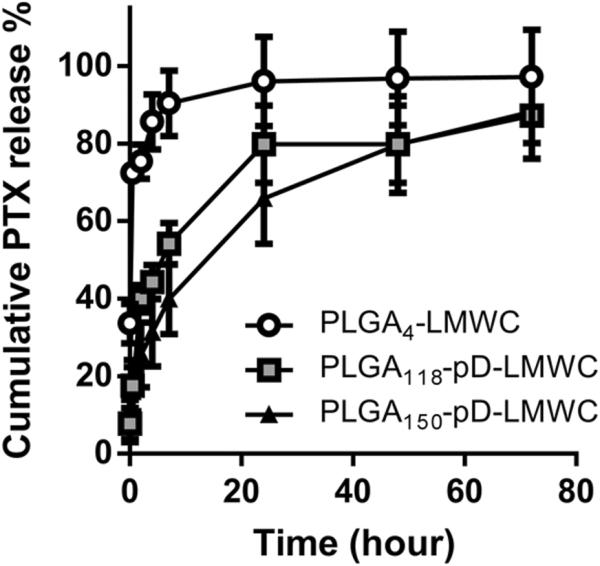
In-vitro drug release of PTX from different NPs in PBS (0.2% Tween 80) at 37°C. At 7th hour, there was significant difference in % cumulative release among three types of NPs (p<0.005, one-way ANOVA, n=3).
3.3. Protein adsorption to NP surface
To identify proteins binding to the NPs during incubation in serum-containing medium and correlate them with NP-cell interactions, the NPs were incubated in 50% FBS solution for 1 or 24 hours, and the proteins tightly bound to NPs (“hard corona”) were analyzed by gel electrophoresis. Proteins bound to NPs were recovered with a detergent (SDS) and a reducing agent (5-mercaptoethanol), combined with heating [25, 26], and analyzed with SDS-PAGE. The intensity of protein bands increased with time (Figs. 5a and 5b), indicating the increase of protein binding to NPs, as previously observed [27]. Three major bands were identified at 66 kDa, 61 kDa, and 52 kDa, likely corresponding to bovine serum albumin, fetuin-A [28, 29], and IgG [30], respectively. Albumin and fetuin-A made up dominant fractions, reflecting their abundance in FBS (Fig. 5c) [31]. The relative intensity of IgG band increased with time in all NPs tested, irrespective of the coating polymers (LMWC vs. PEG) (Fig. 5c). Consistent with the protein adsorption, the NPs with hard corona showed relatively more negative zeta potential than those in buffer (Supporting Fig. 5).
Fig. 5.

Analysis of the composition of protein hard corona formed on NP surface after incubation in 50% FBS for 1 or 24 hours. Hard corona proteins were stripped off NPs and resolved via SDS-PAGE on a 12% gel along with size standards and 200 fold diluted FBS. Gels were stained with Coomassie blue G-250. (a) A representative gel of resolved hard corona proteins. Arrow heads indicate three prominent bands. (b) Band intensity of three proteins pointed with arrow heads in (a). (c) Relative band intensity (% of band intensity divided by the sum of three prominent band intensities). The gel image was analyzed via ImageJ 1.48v software. (b) and (c) show averages and standard deviations of 4 independently and identically run gels with 4 different batches.
3.4. NP-cell interactions
Given that PLGA-pD-LMWC NPs did not completely avoid protein binding in serum solution, we were curious if PLGA-pD-LMWC NPs would maintain the intended advantage of pH-sensitive surface in serum-containing medium. Fluorescently labeled NPs (*PLGA-pD-LMWC NPs and other control *NPs) had similar sizes and surface charges to those of unlabeled NPs (Supporting Fig. 3a and b). The labeled *NPs were incubated with SKOV-3 cells in medium containing 10% FBS at pH 7.4 and 6.2. From flow cytometry analysis, only the cells incubated with *PLGA-pD-LMWC and *PLGA-LMWC NPs at pH 6.2 showed increased geometric mean, indicating NP-cell interaction (Fig. 6a). Those incubated with *PLGA-pD-LMWC or *PLGA-LMWC NPs pH 7.4 did not show such increase, which means that LMWC-coated NPs can preferentially interact with cells in mildly acidic environment such as the extracellular matrix of solid tumors but not in normal tissues. *PLGA, *PLGA-pD, and *PLGA-pD-PEG NPs had no cell interaction at either pH. Confocal microscopy confirmed this result (Fig. 6b).
Fig. 6.
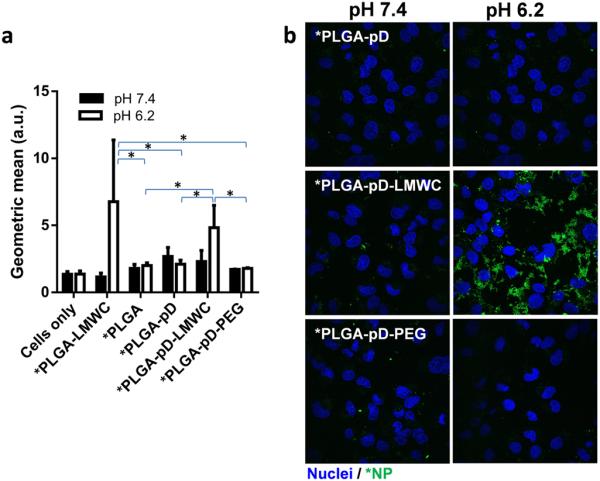
pH dependent interaction of *PLGA-pD, *PLGA-pD-LMWC, and *PLGA-pD-PEG NPs with SKOV-3 cells, (a) quantified by Flow-cytometry (Geometric mean at pH 6.2 was significantly different for *PLGA-LMWC and *PLGA-pD-LMWC from that of *PLGA, *PLGA-pD and *PLGA-pD-PEG, *: p <0.05 by two tailed t-test) and (b) visualized via confocal microscopy, after 3 hours of incubation (Green: *NPs; blue: nuclei).
To locate *PLGA-pD-LMWC NPs with respect to cells, cell membrane or acidic intracellular organelles (late endosomes and lysosomes) were stained after removing uninternalized or loosely bound NPs. *PLGA-pD-LMWC NPs incubated with SKOV-3 cells at pH 6.2 for 3 hours were observed on the membrane or within the membrane boundary (Figs. 7a and 7b), indicating that they were partly internalized by the cells, but not at pH 7.4 (Fig. 7a). *PLGA-pD-LMWC NPs were not colocalized with the acidic organelles at least in 3 hours (Fig. 8a). According to time-lapse microscopy, cell binding of *PLGA-pD-LMWC NPs at pH 6.2 occurred in 60–75 min (Fig. 8b). The NP signals increased over time (Fig. 8b, Supporting Fig. 6), both outside and inside the cells, but NPs were not intracellularly trafficked into the late endosomes and lysosomes at least up to 4.5 hours (Fig. 8b).
Fig. 7.
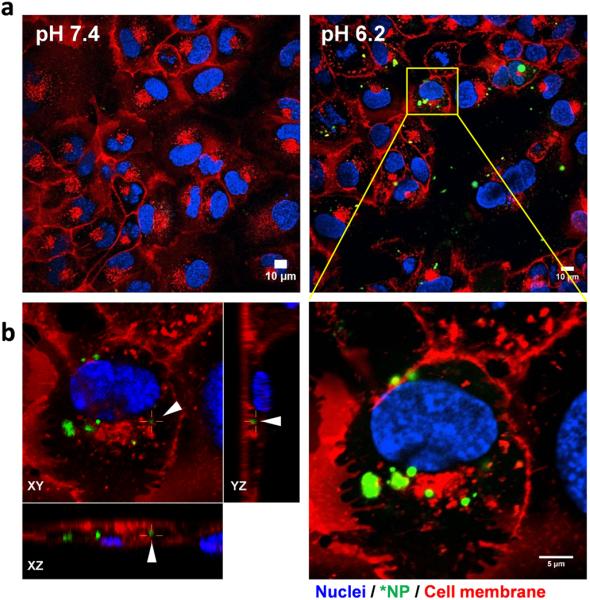
Cellular uptake of *PLGA-pD-LMWC NPs by SKOV-3 cells after 3 hours of incubation at pH 7.4 or 6.2, imaged by confocal microscopy as (a) a cross-sectional image and (b) z-stack (left panel). XZ and YZ planes show NPs located in a cell. (Green: *NPs; red: cell membrane labeled by CellMask deep red; blue: nuclei).
Fig. 8.

(a) Intracellular trafficking of *PLGA-pD-LMWC NPs in SKOV-3 cells, imaged by confocal microscopy after 3 hours of incubation at pH 7.4 or 6.2. (b) Time-lapse confocal imaging of *PLGA-pD-LMWC NPs incubated with SKOV-3 cells at pH 6.2 for 270 minutes (Green: *NPs; red: LysoTracker Red DND-99; blue: nuclei).
To test if the LMWC layer could reduce phagocytic uptake of particles despite the apparent protein binding, *PLGA-pD-LMWC MPs and control *MPs (2–3 μm in diameter), with similar surface charge profiles to those of *NPs (Supporting Figs. 3b and 3c), were incubated with J774A.1 macrophages in medium containing 10% FBS, and the extent of MP phagocytosis was determined by measuring the fluorescence of macrophages by flow cytometry and fluorescence microscopy. Here, MPs were used instead of NPs, as they are more readily phagocytosed than NPs [32], hence serving as a more sensitive model for evaluating macrophage uptake of particles. *PLGA MPs were taken up most avidly (Fig. 9). *PLGA-pD MPs were taken up less than the naked MPs due to the hydrophilicity imparted by amine-containing pD. *PLGA-pD-LMWC MPs showed significant reduction in macrophage uptake, to an even greater extent than *PLGA-pD-PEG MPs (Fig. 9).
Fig. 9.
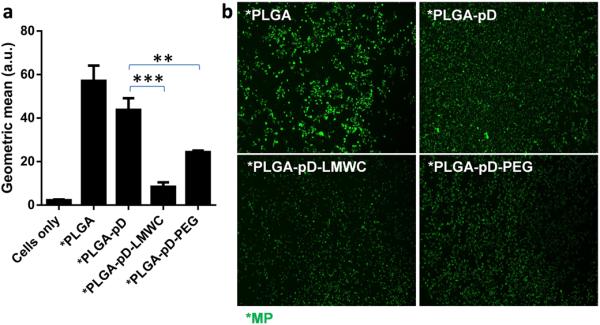
J774A.1 macrophage uptake of *PLGA, *PLGA-pD, *PLGA-pD-LMWC, and *PLGA-pD-PEG MPs at pH 7.4 after 3 hour-incubation, (a) analyzed via flow cytometry and (b) visualized with Cytation 3 fluorescence imaging system (Green: *MPs). Flow cytometry data are expressed as averages and standard deviations of 3 independently and identically prepared NP samples. All geometric means were significantly different from each other (p < 0.05 by one-way ANOVA test). **: p < 0.005; ***: p < 0.0005 by two-tailed t-test.
3.5. Paclitaxel delivery to cancer cells by NPs
We hypothesized that selective cell interaction of PLGA-pD-LMWC NPs at acidic pH would translate to superior drug delivery. To test this, PTX-loaded PLGA-pD-LMWC NPs were incubated with SKOV-3 cells at pH 7.4 and 6 for 2.5 hours, and the amount of PTX retained by the cells was quantified. Cells incubated at pH 6 had >4-fold higher PTX content as compared to pH 7.4 (Fig. 10). On the other hand, there was no such difference for the cells incubated with free PTX or PTX-loaded PLGA-pD-PEG NPs. This shows that the enhanced NP-cell interaction at acidic pH leads to similar enhancement in drug delivery to the cells.
Fig. 10.
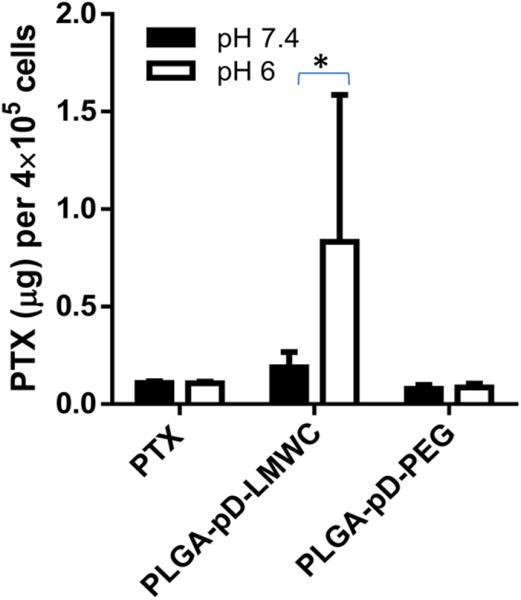
pH dependent PTX retention after incubation of SKOV-3 cells with PTX loaded NPs or free PTX at pH 7.4 or 6. Cells were incubated with the NPs for 2.5 hours at either pH and separated from NPs, and analyzed for PTX content. Data are expressed as averages and standard deviations of 4–8 wells of cells treated with two independently and identically prepared batches of NPs. *: p < 0.05, by two-tailed t-test.
4. Discussion
Polymeric NP systems have been pursued for decades as a way of achieving tumor-specific drug delivery [33]. One of the critical challenges in clinical translation of these systems is the increasing complexity of NP design and production methods. While the complexity is introduced to accommodate new knowledge of cancer biology, it also leads to increasing cost and regulatory scrutiny, making the development of a commercial product more challenging [33, 34]. Moreover, the complicated design and synthesis can induce undesirable changes to the material properties of the NPs such as MW and hydrophobicity, which are essential for their primary roles: loading and retaining drugs. We experienced this problem in developing PLGA4-LMWC NPs, where the LMWC conjugation not only allowed for specific drug delivery to acidic tissues but also increased the hydrophilicity of the polymer, compromising the NP's function as a carrier of PTX [9]. Here, we used a new surface modification method based on dopamine polymerization to decouple the NP formation from the surface modification, enabling independent control of NP cores and surface properties for drug loading/release and specific NP-cell interactions, respectively.
The LMWC-coated PLGA NPs via dopamine polymerization (PLGA-pD-LMWC NPs) showed a comparable average diameter and pH-dependent charge profile to those of PLGA4-LMWC NPs (Fig. 2). The LMWC content in PLGA-pD-LMWC NPs was lower than that of PLGA4-LMWC NPs, but it does not necessarily indicate less efficient coating because in PLGA4-LMWC NPs a fraction of the LMWC is supposed to be buried in the NPs and not exposed on the surface. Given the extent of charge change and NP-cell interaction profiles (Fig. 6), the surface exposed LMWC of the two NPs is likely to be comparable.
The PTX DL of PLGA4-LMWC NPs was apparently higher than that of PLGA-pD-LMWC NPs, but this is likely because of the hydrophilicity of PLGA4-LMWC polymer, which was selectively washed out during the NP preparation [9]. PTX-loaded PLGA-pD-LMWC NPs produced with PLGA118 and PLGA150 showed more prolonged drug release than PTX-loaded PLGA4-LMWC NPs, due to the greater hydrophobicity and MW of the polymers. PTX release in the first few hours from these NPs was much slower than that from PLGA4-LMWC NPs and sustained over three days (Fig. 4), suggesting that these NPs may reduce premature drug release in circulation during the critical period for NP biodistribution. The drug release from PLGA4-LMWC NPs reported in this study appears faster than that in the previous study [9], but the two results are not directly comparable because the Tween 80 concentration in release medium was different (0.2 vs. 0.1%). We chose 0.2% Tween 80 in PBS as release medium, as we determined that it was suitable to mimic the amphiphilic feature of physiological fluid and simulate a sink condition faced in vivo [35]. Even though the drug release attenuation appears to be modest as compared to the previous study, the actual extent of attenuation is deemed significant given the difference of the medium. The NP core can be further optimized, if additional release control is necessary, by simple replacement of the polymer with more hydrophobic and slowly degrading ones [36].
The LMWC layer introduced via pD layer to the pre-formed PLGA NPs provided pH-sensitive functionality necessary for desired cell-NP interactions (Fig. 2b). Prior to testing cellular uptake of NPs, we investigated protein binding to PLGA-pD-LMWC NPs incubated in serum solution. As the NPs enter the blood stream, they instantaneously interact with plasma proteins to be covered with a protein corona on NPs surface. The protein corona is composed of a tightly bound stable “hard” corona and a loosely bound “soft” corona, which can be dynamically exchanged with other proteins [37]. Since NPs entering the bloodstream cannot completely avoid protein binding even with protective surface layer [38] and the identity of bound proteins has shown to be critical to the biological fate of NPs [39], we investigated the protein binding profile of the surface-modified NPs after incubation in 50% FBS, which mimicked the serum content in blood [40]. Protein binding occurred with all tested NPs (PLGA-pD, PLGA-pD-LMWC, and PLGA-pD-PEG NPs) in a similar pattern (Fig. 5). It is noteworthy that all NPs were increasingly enriched with IgG, antibodies responsible for opsonization and complement activation, over time. Fig. 9 shows that pD, pD-LMWC, and pD-PEG layers helped reduce phagocytic uptake of PLGA MPs by J774.1 macrophages due to the hydrophilicity imparted by the surface polymers. However, the increasing IgG enrichment indicates that the function of LMWC or PEG in this NP system is still imperfect as a stealth layer and remains to be improved in future studies.
The surface charges of all NPs decreased after incubation in serum solution (Supporting Fig. 5), reflecting protein binding. Nevertheless, the protein-bound PLGA-pD-LMWC NPs maintained the pH-sensitive charge profile, allowing for acid-specific NP-cell interactions in serum-containing medium. Confocal microscopy showed that PLGA-pD-LMWC NPs established interactions with SKOV-3 cell membrane at pH 6.2 in 1 hour and entered the cells in 3 hours (Fig. 8b), likely via adsorption-mediated endocytosis [41]. The internalized NPs did not colocalize with the late endosomes or lysosomes by 4.5 hours (Fig. 8b). This result is similar to an observation made with cationic NPs coated with quaternized chitosan, which were internalized by human proximal epithelial cells and showed little colocalization with lysosomes in 6 hours [42]. Other types of NPs lacking LMWC (PLGA, PLGA-pD or PLGA-pD-PEG) did not show cellular uptake at pH 6.2. All tested NPs showed little uptake by SKOV-3 cells at pH 7.4 (Fig. 6). This result indicates that while PLGA-pD-LMWC NPs did not interact with cells at normal physiological pH, they were able to establish interactions with cells at <pH 6.5 as PLGA4-LMWC NPs previously did [9] and get internalized into the cells without being trafficked into the acidic organelles. Given that hard corona compositions for all pD-coated NPs (PLGA-pD, PLGA-pD-PEG, and PLGA-pD-LMWC NPs) were similar (Fig. 5), yet PLGA-pD-LMWC NPs showed different behavior than the other NPs, the protein corona in this NP system did not play a role significant enough to interfere with the intended NP-cell interactions. This result is contrasted with transferrin-functionalized silica NPs that lost targeting capabilities in serum-containing medium due to the formation of protein corona [39].
The reliable drug encapsulation achieved by PLGA-pD-LMWC NPs allowed us to test the contribution of the LMWC surface to PTX delivery in acidic medium. SKOV-3 cells were exposed to PTX-loaded PLGA-pD-LMWC NPs at pH 7.4 and 6 for 2.5 hours and analyzed with respect to the amount of PTX retained by the cells (through NP binding and/or uptake). The exposure time was limited to 2.5 hours since it would better represent dynamic in-vivo situation, where NPs would continuously flow and get gradually diluted. PTX-loaded PLGA-pD-LMWC NPs delivered a significantly greater amount of PTX to SKOV-3 cells at pH 6 compared to pH 7.4 and those delivered by free PTX treatment or PTX-loaded PLGA-pD-PEG NPs, which showed similar cellular levels of PTX at both pHs (Fig. 10). Since drug release from NPs was minimal (<30 %) in 2.5 hours (Fig. 4), the large amount of drug delivered by PLGA-pD-LMWC NPs would be readily attributable to the enhanced NP binding and uptake by the cells at acidic pH, previously observed by confocal microscopy and flow cytometry.
5. Conclusions
In summary, LMWC-coated PLGA NPs created by the dopamine polymerization method overcame the limitations of the earlier version based on a PLGA-LMWC covalent conjugate in loading and retaining PTX. The PLGA-pD-LMWC NPs provided pH-sensitive surface layer, which enabled acid-specific NP-cell interaction and enhanced drug delivery to cells in the weakly acidic environment. The LMWC layer did not completely prevent protein binding to the NPs incubated in serum solution but reduced phagocytic uptake. The surface layer remains to be further optimized to reduce IgG binding.
Supplementary Material
Acknowledgments
This work was supported by NIH R01 EB017791. We acknowledge the fellowship support from the Egyptian Government Ministry of Higher Education Missions Sector to S.A.A. We also thank Samyang Genex Corp (Seoul, Korea) for the kind donation of paclitaxel and Dr. Lake Paul at the Bindley Bioscience Center for technical assistance with MALDI and AUC analyses. The authors report no declarations of interest.
References
- 1.Bharali DJ, Khalil M, Gurbuz M, Simone TM, Mousa SA. Nanoparticles and cancer therapy: a concise review with emphasis on dendrimers. Int J Nanomedicine. 2009;4:1–7. [PMC free article] [PubMed] [Google Scholar]
- 2.Torchilin V. Tumor delivery of macromolecular drugs based on the EPR effect. Adv Drug Deliv Rev. 2011;63(3):131–5. doi: 10.1016/j.addr.2010.03.011. [DOI] [PubMed] [Google Scholar]
- 3.Matsumura Y, Maeda H. A new concept for macromolecular therapeutics in cancer chemotherapy: mechanism of tumoritropic accumulation of proteins and the antitumor agent smancs. Cancer Res. 1986;46(12 Pt 1):6387–92. [PubMed] [Google Scholar]
- 4.Maeda H, Sawa T, Konno T. Mechanism of tumor-targeted delivery of macromolecular drugs, including the EPR effect in solid tumor and clinical overview of the prototype polymeric drug SMANCS. J Control Release. 2001;74(1–3):47–61. doi: 10.1016/s0168-3659(01)00309-1. [DOI] [PubMed] [Google Scholar]
- 5.Senior J, Delgado C, Fisher D, Tilcock C, Gregoriadis G. Influence of surface hydrophilicity of liposomes on their interaction with plasma-protein and clearance from the circulation - studies with poly(ethylene glycol)-coated vesicles. Biochim Biophys Acta. 1991;1062(1):77–82. doi: 10.1016/0005-2736(91)90337-8. [DOI] [PubMed] [Google Scholar]
- 6.Torchilin VP, Omelyanenko VG, Papisov MI, Bogdanov AA, Trubetskoy VS, Herron JN, et al. Poly(ethylene glycol) on the liposome surface - on the mechanism of polymer-coated liposome longevity. Biochim Biophys Acta-Biomembranes. 1994;1195(1):11–20. doi: 10.1016/0005-2736(94)90003-5. [DOI] [PubMed] [Google Scholar]
- 7.Hatakeyama H, Akita H, Harashima H. A multifunctional envelope type nano device (MEND) for gene delivery to tumours based on the EPR effect: a strategy for overcoming the PEG dilemma. Adv Drug Deliv Rev. 2011;63(3):152–60. doi: 10.1016/j.addr.2010.09.001. [DOI] [PubMed] [Google Scholar]
- 8.Du H, Chandaroy P, Hui SW. Grafted poly-(ethylene glycol) on lipid surfaces inhibits protein adsorption and cell adhesion. Biochim Biophysica Acta. 1997;1326(2):236–48. doi: 10.1016/s0005-2736(97)00027-8. [DOI] [PubMed] [Google Scholar]
- 9.Amoozgar Z, Park JY, Lin QN, Yeo Y. Low molecular-weight chitosan as a pH-sensitive stealth coating for tumor-specific drug delivery. Mol Pharm. 2012;9(5):1262–70. doi: 10.1021/mp2005615. [DOI] [PMC free article] [PubMed] [Google Scholar]
- 10.Gerweck LE, Seetharaman K. Cellular pH gradient in tumor versus normal tissue: Potential exploitation for the treatment of cancer. Cancer Res. 1996;56(6):1194–8. [PubMed] [Google Scholar]
- 11.Parveen S, Sahoo SK. Long circulating chitosan/PEG blended PLGA nanoparticle for tumor drug delivery. Eur J Pharmacol. 2011;670(2–3):372–83. doi: 10.1016/j.ejphar.2011.09.023. [DOI] [PubMed] [Google Scholar]
- 12.Ishak RAH, Awad GAS, Zaki NM, El-Shamy AEHA, Mortada ND. A comparative study of chitosan shielding effect on nano-carriers hydrophilicity and biodistribution. Carbohyd Polym. 2013;94(1):669–76. doi: 10.1016/j.carbpol.2013.01.072. [DOI] [PubMed] [Google Scholar]
- 13.Lee H, Dellatore SM, Miller WM. Messersmith PB. Mussel-inspired surface chemistry for multifunctional coatings. Science. 2007;318(5849):426–30. doi: 10.1126/science.1147241. [DOI] [PMC free article] [PubMed] [Google Scholar]
- 14.Ryu J, Ku SH, Lee M, Park CB. Bone-like peptide/hydroxyapatite nanocomposites assembled with multi-level hierarchical structures. Soft Matter. 2011;7(16):7201–6. [Google Scholar]
- 15.Wang GF, Huang H, Zhang XJ, Wang L. Electrically contacted enzyme based on dual hairpin DNA structure and its application for amplified detection of Hg2+ Biosens Bioelectron. 2012;35(1):108–14. doi: 10.1016/j.bios.2012.02.029. [DOI] [PubMed] [Google Scholar]
- 16.Lin MH, Liu YJ, Chen XF, Fei SD, Ni CL, Fang YP, et al. Poly(dopamine) coated gold nanocluster functionalized electrochemical immunosensor for brominated flame retardants using multienzyme-labeling carbon hollow nanochains as signal amplifiers. Biosens Bioelectron. 2013;45:82–8. doi: 10.1016/j.bios.2013.01.058. [DOI] [PubMed] [Google Scholar]
- 17.Black KCL, Yi J, Rivera JG, Zelasko-Leon DC, Messersmith PB. Polydopamine-enabled surface functionalization of gold nanorods for cancer cell-targeted imaging and photothermal therapy. Nanomedicine Uk. 2013;8(1):17–28. doi: 10.2217/nnm.12.82. [DOI] [PMC free article] [PubMed] [Google Scholar]
- 18.Park J, Brust TF, Lee HJ, Lee SC, Watts VJ, Yeo Y. Polydopamine-based simple and versatile surface modification of polymeric nano drug carriers. Acs Nano. 2014;8(4):3347–5. doi: 10.1021/nn405809c. [DOI] [PMC free article] [PubMed] [Google Scholar]
- 19.Gullotti E, Park J, Yeo Y. Polydopamine-based surface modification for the development of peritumorally activatable nanoparticles. Pharm Res. 2013;30(8):1956–67. doi: 10.1007/s11095-013-1039-y. [DOI] [PMC free article] [PubMed] [Google Scholar]
- 20.Du X, Li LX, Li JS, Yang CW, Frenkel N, Welle A, et al. UV-triggered dopamine polymerization: control of polymerization, surface coating, and photopatterning. Adv Mater. 2014;26(47):8029–33. doi: 10.1002/adma.201403709. [DOI] [PubMed] [Google Scholar]
- 21.Wei Q, Zhang FL, Li J, Li BJ, Zhao CS. Oxidant-induced dopamine polymerization for multifunctional coatings. Polym Chem. 2010;1(9):1430–3. [Google Scholar]
- 22.Liu Y, Ai K, Liu J, Deng M, He Y, Lu L. Dopamine-melanin colloidal nanospheres: an efficient near-infrared photothermal therapeutic agent for in vivo cancer therapy. Advanced Materials. 2013;25(9):1353–9. doi: 10.1002/adma.201204683. [DOI] [PubMed] [Google Scholar]
- 23.Leane MM, Nankervis R, Smith A, Illum L. Use of the ninhydrin assay to measure the release of chitosan from oral solid dosage forms. Int J Pharm. 2004;271(1–2):241–9. doi: 10.1016/j.ijpharm.2003.11.023. [DOI] [PubMed] [Google Scholar]
- 24.Errington N, Harding SE, Varum KM, Illum L. Hydrodynamic characterization of chitosans varying in degree of acetylation. Int J Biol Macromol. 1993;15(2):113–7. doi: 10.1016/0141-8130(93)90008-a. [DOI] [PubMed] [Google Scholar]
- 25.Docter D, Distler U, Storck W, Kuharev J, Wunsch D, Hahlbrock A, et al. Quantitative profiling of the protein coronas that form around nanoparticles. Nat Protoc. 2014;9(9):2030–44. doi: 10.1038/nprot.2014.139. [DOI] [PubMed] [Google Scholar]
- 26.Monopoli MP, Walczyk D, Campbell A, Elia G, Lynch I, Bombelli FB, et al. Physical-chemical aspects of protein corona: relevance to in vitro and in vivo biological impacts of nanoparticles. J Am Chem Soc. 2011;133(8):2525–34. doi: 10.1021/ja107583h. [DOI] [PubMed] [Google Scholar]
- 27.Casals E, Pfaller T, Duschl A, Oostingh GJ, Puntes V. Time evolution of the nanoparticle protein Corona. Acs Nano. 2010;4(7):3623–32. doi: 10.1021/nn901372t. [DOI] [PubMed] [Google Scholar]
- 28.Martel J, Wu CY, Young JD. Critical evaluation of gamma-irradiated serum used as feeder in the culture and demonstration of putative nanobacteria and calcifying nanoparticles. PLOS ONE. 2010;5(4):e10343. doi: 10.1371/journal.pone.0010343. [DOI] [PMC free article] [PubMed] [Google Scholar]
- 29.Young JD, Martel J, Young L, Wu CY, Young A, Young D. Putative nanobacteria represent physiological remnants and culture by-products of normal calcium homeostasis. PLOS ONE. 2009;4(2):e4417. doi: 10.1371/journal.pone.0004417. [DOI] [PMC free article] [PubMed] [Google Scholar]
- 30.Ehrenberg MS, Friedman AE, Finkelstein JN, Oberdorster G, McGrath JL. The influence of protein adsorption on nanoparticle association with cultured endothelial cells. Biomaterials. 2009;30(4):603–10. doi: 10.1016/j.biomaterials.2008.09.050. [DOI] [PubMed] [Google Scholar]
- 31.Wu C-Y, Young L, Young D, Martel J, Young JD. Bions: A family of biomimetic mineralo-organic complexes derived from biological fluids. PLOS ONE. 2013;8(9):e75501. doi: 10.1371/journal.pone.0075501. [DOI] [PMC free article] [PubMed] [Google Scholar]
- 32.Tabata Y, Ikada Y. Effect of the size and surface-charge of polymer microspheres on their phagocytosis by macrophage. Biomaterials. 1988;9(4):356–62. doi: 10.1016/0142-9612(88)90033-6. [DOI] [PubMed] [Google Scholar]
- 33.Cheng ZL, Al Zaki A, Hui JZ, Muzykantov VR, Tsourkas A. Multifunctional nanoparticles: cost versus benefit of adding targeting and imaging capabilities. Science. 2012;338(6109):903–10. doi: 10.1126/science.1226338. [DOI] [PMC free article] [PubMed] [Google Scholar]
- 34.Goldberg MS, Hook SS, Wang AZ, Bulte JWM, Patri AK, Uckun FM, et al. Biotargeted nanomedicines for cancer: six tenets before you begin. Nanomedicine Uk. 2013;8(2):299–308. doi: 10.2217/nnm.13.3. [DOI] [PMC free article] [PubMed] [Google Scholar]
- 35.Abouelmagd SA, Sun B, Chang AC, Ku YJ, Yeo Y. Release kinetics study of poorly water-soluble drugs from nanoparticles: Are we doing it right? Mol Pharm. 2015;12(3):997–1003. doi: 10.1021/mp500817h. [DOI] [PMC free article] [PubMed] [Google Scholar]
- 36.Mittal G, Sahana DK, Bhardwaj V, Kumar MNVR. Estradiol loaded PLGA nanoparticles for oral administration: Effect of polymer molecular weight and copolymer composition on release behavior in vitro and in vivo. J Control Release. 2007;119(1):77–85. doi: 10.1016/j.jconrel.2007.01.016. [DOI] [PubMed] [Google Scholar]
- 37.Milani S, Bombelli FB, Pitek AS, Dawson KA, Radler J. Reversible versus irreversible binding of transferrin to polystyrene nanoparticles: soft and hard corona. Acs Nano. 2012;6(3):2532–41. doi: 10.1021/nn204951s. [DOI] [PubMed] [Google Scholar]
- 38.Walkey CD, Olsen JB, Guo H, Emili A, Chan WC. Nanoparticle size and surface chemistry determine serum protein adsorption and macrophage uptake. J Am Chem Soc. 2012;134(4):2139–47. doi: 10.1021/ja2084338. [DOI] [PubMed] [Google Scholar]
- 39.Salvati A, Pitek AS, Monopoli MP, Prapainop K, Bombelli FB, Hristov DR, et al. Transferrin-functionalized nanoparticles lose their targeting capabilities when a biomolecule corona adsorbs on the surface. Nat Nanotechnol. 2013;8(2):137–43. doi: 10.1038/nnano.2012.237. [DOI] [PubMed] [Google Scholar]
- 40.Sherwood L. Human Physiology: From Cells to Systems. 8th ed. Cengage Learning; Belmont: 2011. [Google Scholar]
- 41.Tahara K, Sakai T, Yamamoto H, Takeuchi H, Hirashima N, Kawashima Y. Improved cellular uptake of chitosan-modified PLGA nanospheres by A549 cells. Int J Pharm. 2009;382(1–2):198–204. doi: 10.1016/j.ijpharm.2009.07.023. [DOI] [PubMed] [Google Scholar]
- 42.Yue ZG, Wei W, Lv PP, Yue H, Wang LY, Su ZG, et al. Surface charge affects cellular uptake and intracellular trafficking of chitosan-based nanoparticles. Biomacromolecules. 2011;12(7):2440–6. doi: 10.1021/bm101482r. [DOI] [PubMed] [Google Scholar]
Associated Data
This section collects any data citations, data availability statements, or supplementary materials included in this article.