

Abstract
Melanoma lacks a clinically useful blood‐based biomarker of disease activity to help guide patient management. To determine whether measurements of circulating, cell‐free, tumor‐associated BRAFmutant and NRASmutant DNA (ctDNA) have a higher sensitivity than LDH to detect metastatic disease prior to treatment initiation and upon disease progression we studied patients with unresectable stage IIIC/IV metastatic melanoma receiving treatment with BRAF inhibitor therapy or immune checkpoint blockade and at least 3 plasma samples obtained during their treatment course. Levels of BRAFmutant and NRASmutant ctDNA were determined using droplet digital PCR (ddPCR) assays. Among patients with samples available prior to treatment initiation ctDNA and LDH levels were elevated in 12/15 (80%) and 6/20 (30%) (p = 0.006) patients respectively. In patients with RECIST scores <5 cm prior to treatment initiation, ctDNA levels were elevated in 5/7 (71%) patients compared to LDH which was elevated in 1/13 (8%) patients (p = 0.007). Among all disease progression events the modified bootstrapped sensitivities for ctDNA and LDH were 82% and 40% respectively, with a median difference in sensitivity of 42% (95% confidence interval, 27%–58%; P < 0.001). In addition, ctDNA levels were elevated in 13/16 (81%) instances of non‐RECIST disease progression, including 10/12 (83%) instances of new brain metastases. In comparison LDH was elevated 8/16 (50%) instances of non‐RECIST disease progression, including 6/12 (50%) instances of new brain metastases. Overall, ctDNA had a higher sensitivity than LDH to detect disease progression, including non‐RECIST progression events. ctDNA has the potential to be a useful biomarker for monitoring melanoma disease activity.
Keywords: Melanoma, Circulating tumor DNA (ctDNA), Lactate dehydrogenase (LDH), BRAF, NRAS, Biomarker
Highlights
The sensitivity of ctDNA assays to detect metastatic melanoma were compared to LDH.
31 patients with unresectable stage IIIC/IV melanoma were studied.
Droplet digital PCR assays detecting BRAF and NRAS mutations were used.
ctDNA is more sensitive than LDH in detecting metastatic disease.
ctDNA is a sensitive indicator of disease progression, including brain metastases.
1. Introduction
While several highly effective treatments are available for metastatic melanoma (Chapman et al., 2011; Flaherty et al., 2012; Hodi et al., 2010; Long et al., 2014; Robert et al., 2015; Sosman et al., 2012; Topalian et al., 2012; Wolchok et al., 2013), strategies for changing therapies in patients with progressing disease are not established, and there is no clinically useful blood‐based biomarker to guide patient management. Serum LDH is part of the melanoma staging system (Balch et al., 2009), and is the only serologic marker used for monitoring advanced melanoma in the United States (NCCN, 2015); however, its sensitivity and specificity to detect disease progression are low (Egberts et al., 2009; Hwu et al., 2003). Unlike the management of asymptomatic patients with prostate, ovarian, colon, and breast cancer, where serial measurements of serologic markers are the mainstay of follow‐up (NCCN, 2015), in melanoma radiologic imaging studies are obtained every 3–6 months in asymptomatic patients with metastatic disease since LDH is not a sufficiently useful biomarker (NCCN, 2015).
Among candidate biomarker molecules in the blood, circulating tumor DNA (ctDNA) is particularly attractive. It has a large dynamic range (Diehl et al., 2005), a short half‐life estimated at 2 h (Lo et al., 1999), and can be quantitatively measured in cancer patients with high sensitivity and specificity using new PCR technologies (Benesova et al., 2013; Bettegowda et al., 2014). Indeed changes in ctDNA levels have shown promise as disease biomarkers in patients with breast and colon cancer (Dawson et al., 2013; Diehl et al., 2008; Oxnard et al., 2014), and a small number of cutaneous melanoma patients (Lipson et al., 2014; Sanmamed et al., 2015; Chang‐Hao Tsao et al., 2015). ctDNA analysis is particularly attractive for patients with metastatic cutaneous melanoma, a tumor characterized by a high frequency of hotspot mutations in BRAF and NRAS (Forbes et al., 2015). Here we compare the levels of LDH and circulating BRAFmutant and NRASmutant DNA to findings on radiographic scans in patients with metastatic melanoma undergoing systemic treatment with BRAF inhibitors or immune checkpoint blockade.
2. Materials and methods
2.1. Patient sample collection and clinical data
We analyzed metastatic melanoma patients with unresectable stage IIIC and IV disease who were prospectively accrued into the NYU Interdisciplinary Melanoma Cooperative Group Clinicopathological Biorepository. The study was approved by the NYU School of Medicine Institutional Review Board. Men and women with unresectable stage IIIC/IV metastatic melanoma undergoing treatment with BRAF inhibitor therapy, immune checkpoint blockade or both were eligible. To determine the association between ctDNA levels and clinical disease activity, patients who experienced a response to therapy and/or disease progression during their treatment, and had a minimum of 3 blood samples collected at different time points during their treatment course were selected for analysis. Computed tomography (CT), positron emission tomography‐computed tomography (PET/CT) and/or magnetic resonance imaging (MRI) were obtained as clinically indicated and reviewed independently according to Response Evaluation Criteria in Solid Tumors (RECIST), version 1.1. Lactate dehydrogenase (LDH) levels were measured in the clinical chemistry laboratory at NYU where the normal range is 300–616 units/ml.
2.2. Genotyping of tumors for BRAF and NRAS mutations
All patient tumors were initially genotyped for the BRAF V600 mutation using the COBAS assay as part of standard of care. To determine V600E/K status, DNA from formalin‐fixed, paraffin‐embedded (FFPE) tumor sections from patients were analyzed using a multiplex SNaPshot assay (details in Supplementary Methods). Tumors lacking BRAF V600E/K mutations were analyzed for other BRAF V600 mutations via Sanger sequencing (Genewiz). Tumors from patients who tested negative in the COBAS assay were analyzed for NRAS Q61 mutations using a multiplex SNaPshot assay [see Figure 1 for more details].
Figure 1.
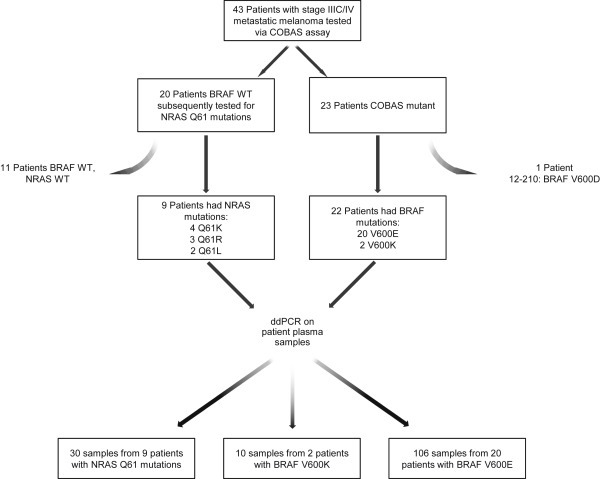
Overview of patient enrollment, sample collection and analysis. Of 43 eligible patients, 31 had tumors with BRAF V600E, V600K, NRAS Q61R, L, or K mutations. See text for tumor genotyping details.
2.3. Isolation and quantification of circulating tumor DNA from plasma
Blood samples were collected in EDTA tubes and processed within 6 h after collection. DNA was extracted from a maximum of 5 ml (range 1 ml–5 ml) from each plasma sample using the QIAamp DSP Circulating Nucleic Acid Kit (Qiagen). Copies per milliliter of plasma BRAF V600E or K, or NRAS Q61K, L or R ctDNA were measured using a QX100 ddPCR system (Bio‐Rad) [details in Supplementary Methods].
2.4. Statistical analysis
To assess the sensitivity of the biomarkers to detect measurable disease prior to treatment initiation, we compared ctDNA, LDH levels and results of radiographic scans obtained within 45 days prior to treatment initiation. ctDNA or LDH values obtained less than 30 days from the date of a radiographic scan or less than 45 days from the start of treatment were used. If more than one sample was available within the time frame, the sample with the highest result was used since the purpose of this analysis was to assess biomarker sensitivity. ctDNA was considered elevated if the result was greater than the ddPCR assay background described in the Results [1 copy/ml for BRAF assays and 3 copies/ml for NRAS assays]. LDH was considered elevated if values were greater than 616 IU/L, the upper limit of normal for the NYU Langone Medical Center clinical chemistry laboratory.
To assess the sensitivity of the biomarkers to detect disease progression we analyzed ctDNA and LDH assay results from samples obtained within 15 days of a disease progression event. Progression events included RECIST‐defined progression (>30% increase in RECIST score), new or increasing non‐target lesions, new or increasing bone metastases, new or increasing brain metastases, or move to hospice or death. When only one plasma sample was available for each patient, we calculated 95% confidence interval (CI) of ctDNA and LDH by assuming the binomial distribution. We used Pearson's chi‐square or Fisher's exact test, where proper, to calculate the p‐value for testing the sensitivity difference between LDH and ctDNA. When we had more than one plasma samples for some patients, we adjusted the repeat measurements by a modified bootstrap method (Dawson et al., 2013). Specifically we randomly sampled from the whole dataset to obtain a new data set containing only one time point for each patient to calculate sensitivity of ctDNA and LDH and the sensitivity difference between ctDNA and LDH for each data set. This procedure was repeated 3000 times to obtain the 95% confidence intervals.
3. Results
3.1. Patient samples and cohort summary
We identified 43 patients with unresectable stage IIIC/IV metastatic melanoma who met the eligibility criteria. Twenty‐three of 43 patients (53%) tested positive for the BRAF V600 mutation via the COBAS assay. To identify specific V600 mutations we used a multiplex SNaPshot assay and/or Sanger sequencing. In 3/23 patients we were unable to confirm a V600 mutation; however, they were included under the assumption that the COBAS test was more sensitive than the secondary approaches. We confirmed V600E mutations in 17 patients, V600K in 2 patients, and V600D in 1 patient. This last patient was excluded from analysis as we did not have a ctDNA assay for the V600D mutation. Tumors from the remaining 20 COBAS‐negative patients were genotyped for NRAS Q61 mutations using the multiplex SNaPshot assay. Nine of 20 patients had NRASmutant tumors (Q61K, n = 4; Q61R, n = 3; Q61L, n = 2). The final dataset comprised 31 patients (22 BRAF V600E or K, and 9 NRAS Q61mutant) with a total of 146 plasma samples (Figure 1).
Patients with BRAFV600E or K mutations were treated with BRAF inhibitor therapies; patients with NRAS Q61 mutations were treated with immune checkpoint blockade. All BRAFmutant patients responded to BRAF inhibitor therapy, and 19 patients subsequently progressed. Among the 9 patients with NRAS Q61 mutations, 2 patients exhibited a delayed response, 1 patient responded and later progressed, and 6 patients progressed immediately.
3.2. Performance characteristics of the BRAF and NRAS ctDNA assays
Pre‐experimental analytical validation studies were conducted using a titration series of mutant DNAs (Supplemental Figure S1). Each assay demonstrated high specificity, high sensitivity and excellent quantification at all total DNA levels. Reproducibility was extremely high with minimal variance between replicates.
To determine the clinical background level we analyzed plasma samples from 30 subjects with no personal history of melanoma or other cancer enrolled as controls in the NYU Melanoma Biorepository. Each sample was tested for BRAF V600E and NRAS Q61R (and their wild‐type counterparts) using 12 replicates. Detection of V600E was less than 0.9 copies/ml for 29/30 samples; detection of NRAS Q61R was less than 2.8 copies/ml for 30/30 samples. Based on these results, and given the comparable performances of the other V600 and Q61 assays, we set the background levels at 1 and 3 copies/ml respectively for the V600 and Q61 mutation assays.
3.3. Overall results of ctDNA and LDH assays
DNA extractions yielded an average of 383 ng DNA per sample (range: 30 ng–5,790 ng). All plasma samples contained amplifiable BRAFwild‐type and NRASwild‐type alleles with concentrations ranging from 359 to 186,097 copies/ml of plasma. BRAFmutant ctDNA could be detected in ≥1 plasma samples from 22/22 patients; NRASmutant ctDNA could be detected in ≥1 plasma samples in 7/9 patients. The mutant ctDNA levels ranged over 4 logs with results varying between 0 and 55,510 copies/ml of plasma. LDH measurements ranged over 2 logs from 194 to 21500 IU/ml during the timeframe of the study.
To more directly compare these assays we studied ctDNA and LDH measurements obtained from samples drawn on the same day. This subset comprised 135/146 (92%) plasma samples drawn from all 31 patients at various times during their treatment course (e.g. pre‐treatment, during response and/or progression). Thirty‐six samples had elevations of both ctDNA and LDH values (ctDNA median: 498.58 copies/ml [1.87–55509.68 copies/ml]; LDH median: 845 IU/L [622–3650 IU/L]), 53 samples had elevated ctDNA only (median: 30 copies/ml [1.05–2352 copies/ml]), 15 samples had elevated LDH only (median: 669 IU/L [618–1368 IU/L]), and 31 samples were not elevated for either marker (ctDNA median: 0 copies/ml [0–2.73 copies/ml]; LDH median: 480 IU/L [357–612 IU/L]) (Supplementary Figure S2).
3.4. Sensitivity to detect measurable disease prior to treatment initiation
To more specifically evaluate the potential clinical utility of ctDNA in melanoma patient management, we compared LDH and ctDNA levels to pre‐treatment radiographic scans, all of which were obtained within 45 days prior to the start of treatment, to determine the sensitivity of each marker to assess tumor burden (as measured by RECIST scores) (Figure 2, Supplemental Figure S3). Overall, the average values of ctDNA and LDH were higher in patients with higher RECIST scores, suggesting a positive association between both markers and tumor burden. Before treatment, ctDNA was detected in 12 of 15 patients (80%) and LDH was only elevated (>616 IU/L) in 6 of 20 patients (30%). This strongly suggests that ctDNA has a greater sensitivity to detect measurable disease prior to the initiation of systemic therapy compared to LDH (Pearson chi‐square test, p = 0.006). More importantly, when ctDNA and LDH levels were compared to RECIST scores binned into 3 categories (low (<5 cm), moderate (5–10 cm), high (>10 cm)), LDH levels were only elevated in 1/13 (8%) patients with low RECIST scores compared to ctDNA which was elevated in 5/7 (71%) patients in the same category (Fisher exact test, p = 0.007). These data demonstrate that ctDNA has a greater sensitivity to detect lower levels of measurable disease than LDH.
Figure 2.
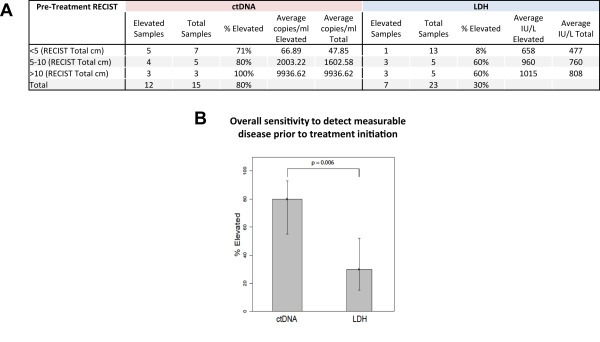
Comparison of ctDNA and LDH sensitivity to detect measurable disease pre‐treatment. Panel A ctDNA and LDH results are categorized by patient pre‐treatment RECIST score at the time of sample collection. All samples and radiographic scans were obtained within 45 days prior to treatment initiation. The percentage of elevated results for each marker, stratified by RECIST score, is shown along with the average marker level for each RECIST category. Panel B displays a bar graph of the overall sensitivity to detect measurable disease by biomarker, based on the data from panel A.
3.5. Biomarker sensitivity at disease progression
To further evaluate the potential for ctDNA results to aid clinical management, we analyzed ctDNA and LDH measurements obtained within 15 days of radiographic scans documenting disease progression. To directly compare the utility of ctDNA and LDH measurements in this context we included only those progression events for which we had measurements of both biomarkers. Of 26 patients, we detected ctDNA in 22 patients (85%) and LDH elevation (>616 UI/L) in 14 patients (54%). When comparing paired samples (n = 44), we detected ctDNA in 35/44 samples (80%) and LDH elevation in 19/44 samples (43%). According to the modified bootstrapping method, the sensitivities of ctDNA and LDH were 82% and 40% respectively, with a median difference in sensitivity of 42% (95% confidence interval, 27%–58%; p < 0.001) (Figure 3A). Also, ctDNA was elevated in a greater number of samples from all RECIST categories compared to LDH. Importantly, ctDNA values were elevated in 13/16 (81%) instances of non‐RECIST disease progression, including 10/12 (83%) instances of new brain metastases. In comparison LDH was elevated in 8/16 (50%) instances of non‐RECIST disease progression, including 6/12 (50%) instances of new brain metastases (Figure 3B).
Figure 3.
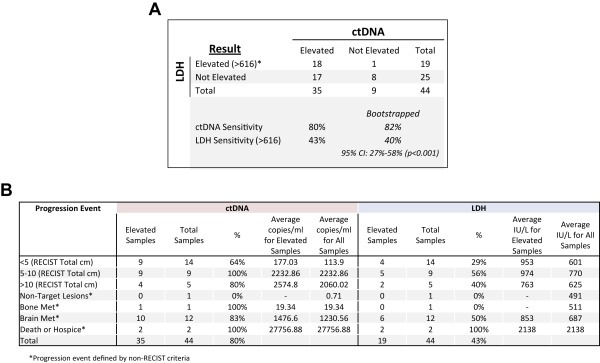
Paired comparison of ctDNA and LDH sensitivity to detect measurable disease at progression. Panel A shows a 2 × 2 table of matched pairs. LDH and ctDNA levels were obtained within 15 days of a disease progression event. If more than one LDH value was available in this time window, the LDH values were averaged. Panel B provides more detail of the results used for panel A. Specifically, ctDNA and LDH results are categorized by patient progression event, including the RECIST score at the time of sample collection, or the nature of a non‐RECIST progression event (e.g. new brain metastases). The percentage of elevated results for each marker, stratified by RECIST score or non‐RECIST progression event, is shown along with the average marker level for each category.
We also found cases where serial monitoring of ctDNA levels detected non‐RECIST disease progression in advance of its clinical manifestation. Figure 4 shows the clinical course, ctDNA and LDH values for 2 patients that progressed during BRAF inhibitor therapy. In patient A, four consecutively rising ctDNA measurements indicated progressing disease 86 days prior to the patient's death. RECIST scores were non‐informative as they showed improvement during this interval; LDH trended upwards along with ctDNA levels. In patient B, ctDNA outperformed both LDH and RECIST in detecting disease progression. The first of two consecutively rising ctDNA measurements indicated progressing disease 120 days before the detection of increased metastatic brain disease (Patient B, clinical marker 2), while RECIST measurements over this interval consistently improved and were thus non‐informative. In contrast to patient A, patient B's LDH levels were clearly non‐informative; levels did not consistently rise above normal until after the detection of increasing brain metastases. Changes in ctDNA, LDH and RECIST measurements for other patients treated with BRAF inhibitor and/or immune checkpoint blockade therapies are shown in Supplemental Figure S4.
Figure 4.
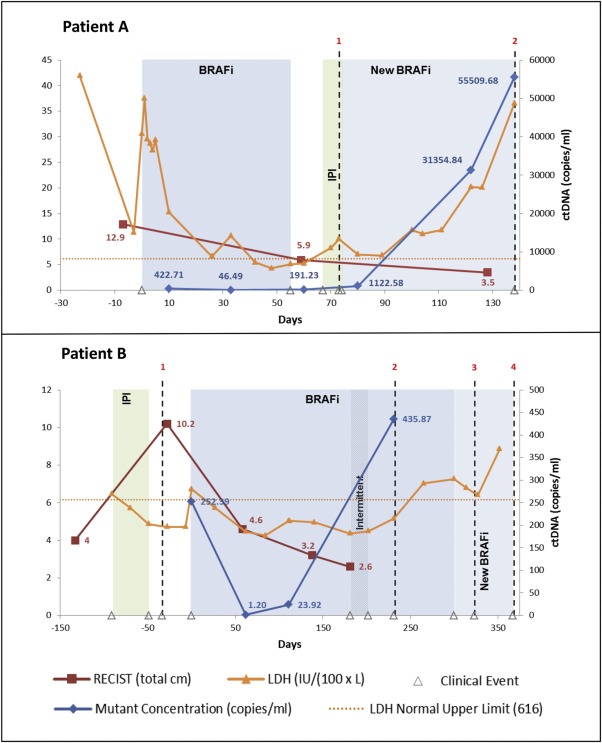
Serial monitoring of ctDNA in melanoma patients undergoing systemic treatment. The graphs display the RECIST scores, LDH levels, ctDNA copies/ml, and clinical course for 2 patients. To enable the plotting of all three data sets on the same graph the left y‐axis plots both RECIST scores (in total cm) and LDH levels (in IU/L/100). The right y‐axis plots ctDNA (copies/ml). Shaded areas represent approximate time period during which the patient underwent the specified treatment. Patient A clinical event markers denote the following: 1. Metastatic brain progression (day 73); 2. Deceased (day 146). Patient B clinical event markers denote the following: 1. New brain metastasis (day 34); 2. Increasing brain metastasis (day 231); 3. Two new brain metastases (day 323); 4. Hospice (day 367).
4. Discussion
In metastatic melanoma ctDNA was a significantly and substantially better indicator of tumor burden and biomarker of disease progression than LDH. In particular, the assays for BRAFV600E, K, NRASQ61R, K or L had low backgrounds, large dynamic ranges, and low variability within replicates. These assay characteristics translated into a highly sensitive plasma‐based methodology to detect and monitor metastatic disease. Overall ctDNA assays showed a much greater sensitivity than LDH to detect measurable disease prior to the initiation of systemic therapy, especially among patients with low tumor burden according to RECIST measurements. Importantly, ctDNA showed a greater sensitivity to detect radiographic disease progression than LDH. The 80% sensitivity to detect disease progression is highly encouraging for a blood‐based melanoma biomarker and further follow‐up studies are warranted.
ctDNA was also a sensitive biomarker of non‐RECIST progression events such as the development of brain metastases. The 83% sensitivity to detect new or worsening brain metastases was an unexpected finding. Bettegowa et al. found high rates of ctDNA detection in a large variety of malignancies, but less than 10% detection rate for gliomas (Bettegowda et al., 2014). The difference may be due to different biologies of these tumors, or the presence of additional extra‐cranial disease among the melanoma patients. The 2 patients we highlighted, however, had decreasing RECIST scores in the presence of new or worsening brain metastases. This suggests that extra‐cranial disease progression, as measured by RECIST criteria, was not the cause of the increasing levels of ctDNA we observed in consecutive samples. Alternatively, it is possible that these patients did have progressive extra‐cranial disease that was not captured by RECIST measurements. These findings suggest that ctDNA may be a useful adjunct to radiographic patient monitoring, including but not limited to clinical trials which rely on RECIST measurements to evaluate responses.
Serial monitoring of ctDNA has been studied in other malignancies most notably in colon and breast cancer (Dawson et al., 2013; Diehl et al., 2008; Oxnard et al., 2014). Dawson et al. demonstrated superiority of ctDNA monitoring over traditional serological markers and circulating tumor cells in patients with metastatic breast cancer. In addition, they were able to demonstrate high levels of association between increasing ctDNA levels and decreasing overall survival (Dawson et al., 2013). One of the major challenges to ctDNA monitoring in colon and breast cancer is that assays for specific tumor mutations need to be developed for each patient as these cancers lack one or more hotspot mutations present in a high proportion of cases.
In melanoma, mutations in BRAF, primarily V600E or V600K, and NRAS, primarily Q61, occur frequently, and mutually exclusively in patient tumors – BRAF in 40%–50% and NRAS in 15%–20% (Hodis et al., 2012). The high frequency of these hotspot mutations make melanoma a tumor system in which a small number of mutation‐specific, plasma‐based assays will be applicable to the large majority of patients. In the current study 72% of patients had a tumor mutation that was covered by one of the 5 different plasma assays we utilized. With the development of additional assays, it may be possible to increase the proportion of patients who can be monitored. Another relevant aspect of melanoma pathogenesis is that several of the known mechanisms underlying resistance to BRAF inhibitor therapy include preservation of the mutant BRAF allele, such as amplification of the mutant allele, creation of an alternatively spliced mutant BRAF transcript, or emergence of NRAS mutations (reviewed in (Das Thakur et al., 2013)), all of which could potentially be monitored using plasma‐based assays. In our study, the majority of patients who progressed on BRAF inhibitor therapy had rising levels of the identified ctDNA. This is in contrast to other tumors effectively treated by small molecule inhibitors such as chronic myelogenous leukemia and gastrointestinal stromal tumors in which imatinib resistance is manifest by loss of tumor cells bearing the mutant allele and emergence of tumor cells with new mutations in the BCR‐ABL gene. In our study there were a few patients that may have exhibited the emergence of resistant tumors lacking BRAF mutations as their BRAF ctDNA levels did not rise with disease progression. With additional development, it may be possible to implement strategies to simultaneously monitor plasma samples for multiple mutations, to identify resistance mechanisms.
To date there have been few studies examining the clinical utility of ctDNA analysis in melanoma patients (Lipson et al., 2014; Sanmamed et al., 2015; Chang‐Hao Tsao et al., 2015). In these studies, each group showed that in a small number of patients ctDNA correlated well with disease outcomes. Lipson et al. detected ctDNA in the plasma of 4/5 analyzable patients and found a correlation between mutant DNA levels and radiographic evidence of progressing disease (Lipson et al., 2014). Most recently, Tsao et al. described changing levels of ctDNA (BRAF V600E/K and NRAS Q61H) during the treatment of 6 patients with stage IV metastatic melanoma (Chang‐Hao Tsao et al., 2015). They found that dynamic changes in ctDNA levels were consistent with changes in disease status as determined by RECIST. Also, they found increasing ctDNA levels in one patient with enlarging brain metastases while LDH measurements failed to rise above normal. Sanmamed et al. demonstrated that basal levels of BRAFV600E ctDNA significantly associated with overall and progression‐free survival (Sanmamed et al., 2015). Taken together, these studies support the potential use of ctDNA monitoring as a melanoma biomarker. The current study substantially extends these findings as it is not only the largest to date and includes analysis of the 3 NRAS mutations most commonly mutated in melanoma, it provides statistically significant evidence that ctDNA is superior to LDH as a melanoma biomarker. Specifically, we make the novel and clinically relevant finding that ctDNA is more sensitive than LDH to detect metastatic disease at low RECIST levels and at times of non‐RECIST disease progression. Importantly, we found that in cases of new or increasing brain metastases, ctDNA outperforms LDH as a biomarker (83% vs 50%, respectively).
The main limitation of this study involved the sample and data collection strategy where blood samples and radiographic scans were obtained as part of routine clinical care. This methodology limited our ability to compare larger numbers of patients with samples and radiographic scans analyzed at pre‐defined, specific time points in their treatment course (i.e. perform landmark analyses). Such analyses could help identify the significance of specific changes in ctDNA levels over time with respect to clinical endpoints such as response to treatment and survival. Future studies with more structured sample and data collection are warranted.
5. Conclusion
Measurements of mutant BRAF and NRAS ctDNA in the plasma of patients with unresectable stage IIIC/IV melanoma can provide clinically meaningful information regarding tumor burden and disease progression. ctDNA outperforms LDH, which is known to provide inconsistent guidance in the clinical management of these patients. With further study, ctDNA monitoring in melanoma may inform clinical decision‐making regarding radiographic disease monitoring and treatment decisions among stage IV patients undergoing systemic treatment who have clinically stable disease. It could potentially reduce the frequency of radiographic tests to monitor disease status, decreasing patient radiation exposure and healthcare costs. In addition, decreasing ctDNA values in patients treated with immune checkpoint blockade may be a useful measure to help identify patients responding to treatment but who have worsening or ambiguous scan results after the initiation of therapy (Wolchok et al., 2009).
Author contributions
GC contributed to sample processing, data collection, assembled data, data analysis, data interpretation, and writing and editing of the report. JST contributed to sample analysis and data collection, and reviewing and editing of report. YS was the study statistician and contributed to the design of the study, data interpretation, data analysis, statistical analysis, and edited the final version of the report. YZ contributed to statistical analysis. SW contributed to clinical data collection and analysis. ER contributed to patient enrollment, data collection and edited the report. CS contributed to sample processing, data collection, and edited the final version of the report. MF contributed to study design, data analysis and edited the final version of the report. DNS contributed to study design, data analysis and edited the final version of the report. GKN contributed to study design, data analysis and edited the final version of the report. AP contributed to patient enrollment, clinical data collection and analysis. IO contributed to study design, data analysis, administrative, technical and material support, and edited the final version of the report. DP contributed to study design, data analysis, administrative, technical and material support, and writing and editing of the report. DP and GC had full access to all of the data in the study and take responsibility for the integrity of the data and the accuracy of the data analysis.
Conflict of interest disclosures
CS is an employee of Molecular MD Corporation, MF has been a consultant for Bio‐Rad Laboratories. DNS, GKN are employees of Bio‐Rad Laboratories. DP and IO and their institution have received royalties for licensed intellectual property rights from Molecular MD. DP has a consulting relationship with Molecular MD, and his laboratory received in‐kind research support from Bio‐Rad Laboratories. The other authors declare they have no conflicts of interest.
Funding/Support
The study was funded by the United States Food and Drug Administration Critical Path Initiative (1 U01 FD004203‐01), the United States National Cancer Institute (1 R21 CA154786‐01 and P30 CA16087), and the Marc Jacobs Campaign to Support Melanoma Research. Bio‐Rad Laboratories provided in‐kind research support to the laboratory of DP.
Role of funder/Sponsor
The sponsors of the study had no role in the study design. Molecular MD assisted in data collection by analyzing plasma samples from healthy controls to help establish background levels for the BRAFV600E assay and assess inter‐laboratory variability. None of the sponsors had a role in the data interpretation. All the authors, including those from Bio‐Rad and Molecular MD, reviewed the paper and are responsible for the decision to submit for publication. DP and GC had full access to the data, drafted and revised the manuscript, and were not paid to write this article by any company or other agency, DP had final responsibility for the decision to submit for publication.
Supporting information
The following are the supplementary data related to this article:
Supplementary data
Supplementary data
Acknowledgments
Paula Stonemetz, Nathaniel Fleming, and Kevin Lui for their contributions to the study. We also thank the patients who participated in this study.
Supplementary data 1.
Supplementary data related to this article can be found online at http://dx.doi.org/10.1016/j.molonc.2015.09.005.
Chang Gregory A., Tadepalli Jyothirmayee S., Shao Yongzhao, Zhang Yilong, Weiss Sarah, Robinson Eric, Spittle Cindy, Furtado Manohar, Shelton Dawne N., Karlin-Neumann George, Pavlick Anna, Osman Iman, Polsky David, (2016), Sensitivity of plasma BRAFmutant and NRASmutant cell‐free DNA assays to detect metastatic melanoma in patients with low RECIST scores and non‐RECIST disease progression, Molecular Oncology, 10, doi: 10.1016/j.molonc.2015.09.005.
References
- Balch, C.M. , Gershenwald, J.E. , Soong, S.J. , Dec 20 2009. Final version of 2009 AJCC melanoma staging and classification. J. Clin. Oncol. 27, (36) 6199–6206. [DOI] [PMC free article] [PubMed] [Google Scholar]
- Benesova, L. , Belsanova, B. , Suchanek, S. , Feb 15 2013. Mutation-based detection and monitoring of cell-free tumor DNA in peripheral blood of cancer patients. Anal. Biochem. 433, (2) 227–234. [DOI] [PubMed] [Google Scholar]
- Bettegowda, C. , Sausen, M. , Leary, R.J. , Feb 19 2014. Detection of circulating tumor DNA in early- and late-stage human malignancies. Sci. Transl. Med. 6, (224) 224ra224 [DOI] [PMC free article] [PubMed] [Google Scholar]
- Chang-Hao Tsao, S. , Weiss, J. , Hudson, C. , 2015. Monitoring response to therapy in melanoma by quantifying circulating tumour DNA with droplet digital PCR for BRAF and NRAS mutations. Scientific Rep. 5, 11198 [DOI] [PMC free article] [PubMed] [Google Scholar]
- Chapman, P.B. , Hauschild, A. , Robert, C. , Jun 30 2011. Improved survival with vemurafenib in melanoma with BRAF V600E mutation. N. Engl. J. Med. 364, (26) 2507–2516. [DOI] [PMC free article] [PubMed] [Google Scholar]
- Das Thakur, M. , Salangsang, F. , Landman, A.S. , Feb 14 2013. Modelling vemurafenib resistance in melanoma reveals a strategy to forestall drug resistance. Nature. 494, (7436) 251–255. [DOI] [PMC free article] [PubMed] [Google Scholar]
- Dawson, S.J. , Tsui, D.W. , Murtaza, M. , Mar 28 2013. Analysis of circulating tumor DNA to monitor metastatic breast cancer. N. Engl. J. Med. 368, (13) 1199–1209. [DOI] [PubMed] [Google Scholar]
- Diehl, F. , Li, M. , Dressman, D. , Nov 8 2005. Detection and quantification of mutations in the plasma of patients with colorectal tumors. Proc. Natl. Acad. Sci. USA. 102, (45) 16368–16373. [DOI] [PMC free article] [PubMed] [Google Scholar]
- Diehl, F. , Schmidt, K. , Choti, M.A. , Sep 2008. Circulating mutant DNA to assess tumor dynamics. Nat. Med. 14, (9) 985–990. [DOI] [PMC free article] [PubMed] [Google Scholar]
- Egberts, F. , Hitschler, W.N. , Weichenthal, M. , Hauschild, A. , Feb 2009. Prospective monitoring of adjuvant treatment in high-risk melanoma patients: lactate dehydrogenase and protein S-100B as indicators of relapse. Melanoma Res. 19, (1) 31–35. [DOI] [PubMed] [Google Scholar]
- Flaherty, K.T. , Infante, J.R. , Daud, A. , Nov 2012. Combined BRAF and MEK inhibition in melanoma with BRAF V600 mutations. N. Engl. J. Med. 367, (18) 1694–1703. [DOI] [PMC free article] [PubMed] [Google Scholar]
- Forbes, S.A. , Beare, D. , Gunasekaran, P. , Jan 28 2015. COSMIC: exploring the world's knowledge of somatic mutations in human cancer. Nucleic Acids Res. 43, (Database issue) D805–D811. [DOI] [PMC free article] [PubMed] [Google Scholar]
- Hodi, F.S. , O'Day, S.J. , McDermott, D.F. , Aug 19 2010. Improved survival with ipilimumab in patients with metastatic melanoma. N. Engl. J. Med. 363, (8) 711–723. [DOI] [PMC free article] [PubMed] [Google Scholar]
- Hodis, E. , Watson, I.R. , Kryukov, G.V. , Jul 20 2012. A landscape of driver mutations in melanoma. Cell. 150, (2) 251–263. [DOI] [PMC free article] [PubMed] [Google Scholar]
- Hwu, W. , Balch, C.M. , Houghton, A. , 2003. Diagnosis of stage IV disease. In Balch C.M.H.A., Sober A., Soong S.(Eds.), Cutaneous Melanoma. fourth ed. Quality Medical; St. Louis: 523–546. [Google Scholar]
- Lipson, E.J. , Velculescu, V.E. , Pritchard, T.S. , 2014. Circulating tumor DNA analysis as a real-time method for monitoring tumor burden in melanoma patients undergoing treatment with immune checkpoint blockade. J. Immunother. Cancer. 2, (1) 42 [DOI] [PMC free article] [PubMed] [Google Scholar]
- Lo, Y.M. , Zhang, J. , Leung, T.N. , Lau, T.K. , Chang, A.M. , Hjelm, N.M. , Jan 1999. Rapid clearance of fetal DNA from maternal plasma. Am. J. Hum. Genet. 64, (1) 218–224. [DOI] [PMC free article] [PubMed] [Google Scholar]
- Long, G.V. , Stroyakovskiy, D. , Gogas, H. , Nov 13 2014. Combined BRAF and MEK inhibition versus BRAF inhibition alone in melanoma. N. Engl. J. Med. 371, (20) 1877–1888. [DOI] [PubMed] [Google Scholar]
- (NCCN) NCCN. NCCN Clinical Practice Guidelines in Oncology. http://www.nccn.org/professionals/physician_gls/f_guidelines.asp (accessed 28.01.15).
- Oxnard, G.R. , Paweletz, C.P. , Kuang, Y. , Mar 15 2014. Noninvasive detection of response and resistance in EGFR-mutant lung cancer using quantitative next-generation genotyping of cell-free plasma DNA. Clin. Cancer Res. 20, (6) 1698–1705. [DOI] [PMC free article] [PubMed] [Google Scholar]
- Robert, C. , Long, G.V. , Brady, B. , Jan 22 2015. Nivolumab in previously untreated melanoma without BRAF mutation. N. Engl. J. Med. 372, (4) 320–330. [DOI] [PubMed] [Google Scholar]
- Sanmamed, M.F. , Fernandez-Landazuri, S. , Rodriguez, C. , Jan 2015. Quantitative cell-free circulating BRAFV600E mutation analysis by use of Droplet digital PCR in the follow-up of patients with melanoma being treated with BRAF inhibitors. Clin. Chem. 61, (1) 297–304. [DOI] [PubMed] [Google Scholar]
- Sosman, J.A. , Kim, K.B. , Schuchter, L. , Feb 23 2012. Survival in BRAF V600-mutant advanced melanoma treated with vemurafenib. N. Engl. J. Med. 366, (8) 707–714. [DOI] [PMC free article] [PubMed] [Google Scholar]
- Topalian, S.L. , Hodi, F.S. , Brahmer, J.R. , Jun 28 2012. Safety, activity, and immune correlates of anti-PD-1 antibody in cancer. N. Engl. J. Med. 366, (26) 2443–2454. [DOI] [PMC free article] [PubMed] [Google Scholar]
- Wolchok, J.D. , Hoos, A. , O'Day, S. , Dec 1 2009. Guidelines for the evaluation of immune therapy activity in solid tumors: immune-related response criteria. Clin. Cancer Res. 15, (23) 7412–7420. [DOI] [PubMed] [Google Scholar]
- Wolchok, J.D. , Kluger, H. , Callahan, M.K. , Jul 11 2013. Nivolumab plus ipilimumab in advanced melanoma. N. Engl. J. Med. 369, (2) 122–133. [DOI] [PMC free article] [PubMed] [Google Scholar]
Associated Data
This section collects any data citations, data availability statements, or supplementary materials included in this article.
Supplementary Materials
The following are the supplementary data related to this article:
Supplementary data
Supplementary data