

Abstract
Background
Rheumatoid Arthritis is a chronic disease leading to decreased quality of life with a rather variable response rate to Disease Modifying Anti Rheumatic Drugs. Methotrexate (MTX) is the gold standard therapy in Rheumatoid Arthritis. The Multidrug resistance Related Protein and Multi Drug Resistance protein 1, also called P-glycoprotein-170 transporters can alter the intracellular concentration of different drugs. Methotrexate is an MRP1 substrate and thus the functional activity of MRP1 might have a clinical impact on the efficiency of the Methotrexate-therapy in Rheumatoid Arthritis.
Methods
We have compared the functional Multidrug Activity Factors (MAF) of the MDR1 and MRP1 transporters of Peripheral Blood Leukocytes of 59 Rheumatoid Arthritis patients with various response rate to MTX-therapy (MTX-responder, MTX-resistant and MTX-intolerant RA-groups) and 47 non-RA controls in six different leukocyte subpopulations (neutrophil leukocytes, monocytes, lymphocytes, CD4+, CD8+ and CD19+ cells). There was a decreased MAF of RA patients compared to non- Rheumatoid Arthritis patients and healthy controls in the leukocyte subpopulations. There was a significant difference between the MAF values of the MTX-responder and MTX intolerant groups. But we have not found significant differences between the MAF values of the MTX-responder and MTX-resistant Rheumatoid Arthritis -groups.
Results
Our results suggest that MDR1 and MRP1 functional activity does not seem to affect the response rate to MTX-therapy of Rheumatoid Arthritis-patients, but it might be useful in predicting MTX-side effects. We have demonstrated the decreased functional MDR-activity on almost 60 Rheumatoid Arthritis patients, which can be interpreted as a sign of the immune-suppressive effect of the MTX-treatment.
Keywords: ABC-transporter, Disease modifying anti rheumatic drugs-DMARDs, Methotrexate, MultiDrug resistance, Rheumatoid arthritis
Background
Rheumatoid arthritis (RA) is a chronic inflammatory disease of small articulations often leading to functional impairments and seriously affecting the quality of life [1]. Currently methotrexate (MTX) is the gold standard therapy of the disease modifying antirheumatic drugs (DMARDs), however the response rate is rather variable and many patients are completely resistant to MTX therapy [2, 3]. It has been previously reported, that the Multidrug Resistance Protein 1 (MDR1) and the Multidrug resistance Related Protein 1 (MRP1) transporters - responsible for chemo-resistance of tumor cells - may also have pathophysiological role in different chronic diseases, including rheumatoid arthritis [4, 5].
ATP Binding Cassette (ABC) -transporters are ATP-driven efflux pumps of the cell membranes present on many cell surfaces, but especially on barriers, bile-transporters, kidney-tubules, enterocytes, blood–brain barriers and inflammatory cells. These transporters extrude xenobiotic substances including various drugs via active transport [6]. According to their wide substrate specificity, these transporters may interfere with the absorption and distribution of many therapeutic agents and could influence their serum concentration which in turn can alter the efficiency of different treatments.
The MRP1-transporter substrate MTX is the most widely used DMARD. Therefore, the elevated MDR1/MRP1 expression in the synovium of RA-patients suggested prognostic role to these proteins [3, 7–10]. On the other hand, many studies have reported, that expression levels of MDR1 and MRP1 proteins do not correlate with the functional activity of these proteins predicting the superiority of functional determination of transport activities over expression data [11–13].
The clinical relevance and usefulness of calcein-AM based functional multidrug-assay has been demonstrated in acute myeloid leukemia [14]. We have optimized this assay for the determination of functional MDR1- and MRP1-activity of different peripheral blood leukocyte subtypes of RA-patients to study their possible role in the response to DMARD-therapy.
Results
Our results suggest that MDR1 and MRP1 functional activity does not seem to affect the response rate to MTX-therapy of Rheumatoid Arthritis-patients, but it might be useful in predicting MTX-side effects. We have demonstrated the decreased functional MDR-activity on almost 60 Rheumatoid Arthritis patients, which can be interpreted as a sign of the immune-suppressive effect of the MTX-treatment. First, we have compared the MAFTotal, MAFMDR1 and MAFMRP1 of all six leukocyte subgroups of the five different patient groups to define if there is any significant difference between any of those. We did not find significant differences in the MAF-values of the RA-patients according to their responder-rate to MTX-therapy. Because most of the patients were taking other drugs as well, we have collected the data of medicine-intake with doses and analyzed the potential effect of these on each MAF value. After adjusting the model with the significant drug-effects on the MAF-values, we have compared each RA and non-RA groups pairwise with each other (Table 1).
Table 1.
Shows the significant differences between different patient groups with (adjusted p) and without (p) the adjustment of the medicine effects on the different MAF values
| Cell type | MAF type | Group 1 | Mean | Group 2 | Mean | p | Adjusted p | After adjustment |
|---|---|---|---|---|---|---|---|---|
| Granulocytes | Total | MTX-intolerant | 15 | nonRA control | 11 | 0,0068 | 0,0026 | significant |
| Granulocytes | Total | MTX-responder | 14 | nonRA control | 11 | 0,0097 | 0,2005 | non significant |
| Granulocytes | MRP1 | MTX-intolerant | 5 | MTX-responder | 2,5 | 0,3664 | 0,0276 | significant |
| Granulocytes | MRP1 | MTX-intolerant | 5 | nonRA control | −2,5 | 0,0897 | 0,0472 | significant |
| Granulocytes | MDR1 | MTX-resistant | 11 | MTX-responder | 10 | 0,2475 | 0,0284 | significant |
| Monocytes | Total | MTX-responder | 7 | nonRA control | 12 | 0,0214 | 0,1114 | non significant |
| Monocytes | Total | MTX-responder | 7 | Healthy control | 15,98 | 0,0023 | 0,6893 | non significant |
| Monocytes | Total | MTX-intolerant | 9 | Healthy control | 15,98 | 0,0266 | 0,9483 | non significant |
| Monocytes | Total | MTX-resistant | 7,5 | Healthy control | 15,98 | 0,0075 | 0,7462 | non significant |
| Monocytes | MDR1 | MTX-resistant | 7 | Healthy control | 11,99 | 0,0044 | 0,6792 | non significant |
| Monocytes | MDR1 | MTX-resistant | 7 | nonRA control | 12,5 | 0,0245 | 0,4869 | non significant |
| Monocytes | MDR1 | MTX-intolerant | 7 | Healthy control | 11,99 | 0,0071 | 0,3590 | non significant |
| Monocytes | MDR1 | MTX-responder | 5,5 | MTX-intolerant | 7 | 0,8766 | 0,0276 | significant |
| Monocytes | MDR1 | MTX-intolerant | 7 | nonRA control | 12,5 | 0,0443 | 0,0472 | significant |
| Lymphocytes | Total | Healthy control | 34,29 | MTX-resistant | 27,5 | 0,0023 | 0,0504 | trend |
| Lymphocytes | Total | Healthy control | 34,29 | MTX-intolerant | 26 | 0,0014 | 0,0121 | significant |
| Lymphocytes | Total | Healthy control | 34,29 | nonRA control | 29 | 0,0359 | 0,0537 | trend |
| Lymphocytes | Total | Healthy control | 34,29 | MTX-responder | 26 | 0,0011 | 0,0084 | significant |
| Lymphocytes | MRP1 | nonRA control | 0 | MTX-responder | 6,5 | 0,0842 | 0,0510 | trend |
| Lymphocytes | MRP1 | nonRA control | 0 | MTX-intolerant | 7 | 0,0532 | 0,0139 | significant |
| Lymphocytes | MRP1 | nonRA control | 0 | MTX-resistant | 4 | 0.0689 | 0,0022 | significant |
| Lymphocytes | MRP1 | nonRA control | 0 | Healthy control | 10,55 | 0,0023 | 0,0014 | significant |
| Lymphocytes | MDR1 | nonRA control | 32 | Healthy control | 21,73 | 0,0129 | 0,0847 | trend |
| Lymphocytes | MDR1 | nonRA control | 32 | MTX-responder | 22,5 | 0,0164 | 0,0084 | significant |
| Lymphocytes | MDR1 | nonRA control | 32 | MTX-resistant | 21,5 | 0,003 | 0,0008 | significant |
| Lymphocytes | MDR1 | nonRA control | 32 | MTX-intolerant | 21 | 0,002 | 0,0007 | significant |
| CD4+ cells | Total | nonRA control | 23,5 | MTX-resistant | 20 | 0,0156 | 0,0270 | significant |
| CD4+ cells | Total | Healthy control | 26,81 | MTX-responder | 21,5 | 0,036 | 0,2212 | non significant |
| CD4+ cells | Total | nonRA control | 23,5 | MTX-intolerant | 21 | 0,0211 | 0,0064 | significant |
| CD4+ cells | Total | Healthy control | 26,81 | MTX-resistant | 20 | 0,0174 | 0,0278 | significant |
| CD4+ cells | Total | Healthy control | 26,81 | MTX-intolerant | 21 | 0,0032 | 0,0081 | significant |
| CD4+ cells | MRP1 | nonRA control | −1 | Healthy control | 7,8 | 0,0118 | 0,0103 | significant |
| CD4+ cells | MRP1 | Healthy control | 7,8 | MTX-resistant | 2 | 0,076 | 0,0492 | significant |
| CD4+ cells | MRP1 | nonRA control | −1 | MTX-intolerant | 4 | 0,0121 | 0,0950 | trend |
| CD4+ cells | MDR1 | nonRA control | 27,5 | MTX-intolerant | 16 | 0,0004 | 0,0015 | significant |
| CD4+ cells | MDR1 | nonRA control | 27,5 | MTX-resistant | 17,5 | 0,0046 | 0,0154 | significant |
| CD4+ cells | MDR1 | nonRA control | 27,5 | MTX-responder | 17 | 0,0364 | 0,0698 | trend |
| CD4+ cells | MDR1 | nonRA control | 27,5 | Healthy control | 17,7 | 0,0108 | 0,0448 | significant |
| CD8+ cells | Total | nonRA control | 35 | MTX-intolerant | 31 | 0,0262 | 0,0585 | trend |
| CD8+ cells | Total | nonRA control | 35 | MTX-resistant | 31 | 0,0078 | 0,0046 | significant |
| CD8+ cells | Total | nonRA control | 35 | MTX-responder | 29 | 0,0008 | 0,0001 | significant |
| CD8+ cells | Total | Healthy control | 40,15 | MTX-intolerant | 31 | 0,0036 | 0,0120 | significant |
| CD8+ cells | Total | Healthy control | 40,15 | MTX-resistant | 31 | 0,0004 | 0,0032 | significant |
| CD8+ cells | Total | Healthy control | 40,15 | MTX-responder | 29 | 0,0002 | 0,0003 | significant |
| CD8+ cells | Total | MTX-responder | 29 | MTX-intolerant | 31 | 0,1309 | 0,0601 | trend |
| CD8+ cells | MRP1 | Healthy control | 14,35 | MTX-intolerant | 5 | 0,0003 | 0,0004 | significant |
| CD8+ cells | MRP1 | Healthy control | 14,35 | MTX-resistant | 6 | 0,002 | 0,0017 | significant |
| CD8+ cells | MRP1 | Healthy control | 14,35 | MTX-responder | 6,5 | 0,0069 | 0,0031 | significant |
| CD8+ cells | MRP1 | Healthy control | 14,35 | nonRA control | 0 | 0,0053 | 0,0131 | significant |
| CD8+ cells | MDR1 | nonRA control | 37,5 | MTX-intolerant | 28 | 0,0302 | 0,0634 | trend |
| CD8+ cells | MDR1 | nonRA control | 37,5 | MTX-resistant | 24,5 | 0,0071 | 0,0014 | significant |
| CD8+ cells | MDR1 | nonRA control | 37,5 | MTX-responder | 21,5 | 0,0057 | 0,0012 | significant |
| CD8+ cells | MDR1 | nonRA control | 37,5 | Healthy control | 21,93 | 0,0089 | 0,0324 | significant |
| CD19+ cells | Total | nonRA control | 20,5 | MTX-resistant | 16,5 | 0,0435 | 0,6173 | non significant |
| CD19+ cells | MRP1 | nonRA control | 0 | MTX-intolerant | 5 | 0,0426 | 0,0057 | significant |
| CD19+ cells | MRP1 | nonRA control | 0 | MTX-resistant | 3,5 | 0,3154 | 0,0180 | significant |
| CD19+ cells | MDR1 | nonRA control | 22,5 | MTX-intolerant | 14 | 0,0175 | 0,0491 | significant |
| CD19+ cells | MDR1 | nonRA control | 22,5 | MTX-resistant | 15 | 0,0109 | 0,0000 | significant |
| CD19+ cells | MDR1 | MTX-responder | 17 | MTX-intolerant | 14 | 0,4548 | 0,0058 | significant |
Significant p-values are highlighted in bold
With the adjusted model, the MAFMDR1 of the granulocytes was significantly higher in the MTX-responder group than the MTX-resistant group. Another finding was that the MTX-intolerant RA-group had significantly higher MAFMRP1 than the MTX-responders in the granulocyte subpopulation (Fig. 1). Unfortunately, the granulocyte representation was sometimes low in our samples and not all blood samples contained enough granulocytes to be subject of precise MAF determination.
Fig. 1.
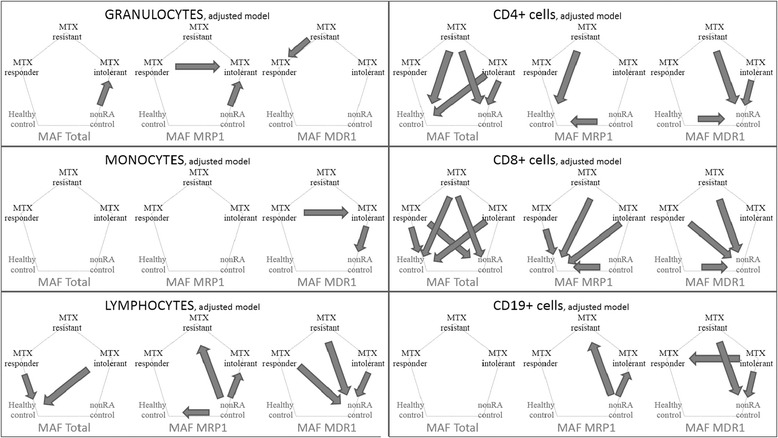
Significant differences among various patient-groups. The differences among the 5 groups are shown with arrows pointing towards the significantly higher MAF values according to the adjusted/justified model. Only significant differences with p < 0,05 are shown
With a potential clinical application, another interesting finding was the difference in MAF values in the granulocyte, monocyte and CD19+ cells between the MTX-responder and the MTX-intolerant groups. The MAFMRP1 of granulocytes in the MTX-intolerant group was significantly higher than that of MTX-responder RA-patients, and the MAFMDR1 of MTX-intolerant group was significantly higher than that of MTX-responder RA-patients in the granulocyte population. In contrast, we have found significantly lower MAFMDR1 of the CD19+ cells of RA-patients intolerant to MTX-therapy than those of MTX-responders.
According to our results, the most prominent difference was found between the different RA-groups and the two control groups in almost all leukocyte subgroups. Granulocytes and CD19+ cells had higher MAFMRP1 in the RA-groups with the adjusted model, while the other leukocyte groups have higher MAFTotal and MAFMDR1 and lower MAFMRP1. The differences become more pronounced in the following sequence: monocyte, lymphocyte, CD4+ cells and CD8+ cells (Fig. 1).
Discussion
The first report on the potential role of MDR-proteins in RA found significantly higher MDR1 (P-glycoprotein) expression in steroid-treated RA-patients independently from other factors [15]. Later, in a small study by Yudoh et al. increased expression of P-Glycoprotein on Th1-cells correlated with drug resistance was observed after two month of therapy with bucillamin or sulfsalazine [16]. As DMARD therapy moved forwards, the MRP1-susbtrate MTX and the role of the MRP1 proteins have emerged in defining the response to MTX-therapy [17].
Despite our original hypothesis on the effect of functional MDR-activity on the response rate to MTX-therapy, in this study we were not able to demonstrate significant differences in the functional MDR-activities of MTX-responder and MTX-resistant RA patients, except for the higher MAFMDR1 of granulocytes of MTX-responders than MTX-resistants. However, we found another significant difference in the MAF values of the granulocytes: the MTX-intolerant RA-group had significantly higher MAFMRP1 than the MTX-responder RA-group. This difference may be useful in identifying the MTX-intolerant patients, who cannot benefit from MTX-therapy.
The MAFMRP1 of granulocytes and the MAFMDR1 of monocytes was significantly higher in the MTX-intolerant patients than in MTX-responders, while they had significantly lower MAFMDR1 in the CD19+ population. The combination of these three results could be clinically relevant in determining the MTX intolerant patient population.
In clinical setting: if a patient needs dose escalation of MTX and has side effects probably related to MTX, a scheduled MDR-functional assessment finding the upper mentioned triad of granulocytic MAFMRP1 and monocytic, CD19+ lymphocytic MAFMDR1 values might help in deciding to turn off ineffective dose-escalation of MTX. Titrating MTX-dosage in RA-patients is quite laborious, so disclosing patients who will not benefit from dose elevation and thus avoiding the harmful side effects of MTX-treatment might have clinical relevance in the future. Although, further studies are still needed for the clinical implementation/validation of these findings.
There are only few previous studies on RA patients investigating the role of MDR-transporters in MTX-response. Wolf et al. determined the functional activity of Reduced Folate Carrier (RFC), which transports MTX into the cells, and MRP1, which effluxes MTX out of the cells. They logically anticipated that RFC+ and MRP- patients should have better response to MTX-therapy, but instead, they observed the opposite result, since these patients had the worse response rate, while the lack or presence of both proteins was linked to significantly better therapeutic outcome [18]. In another study, they determined the mRNA-levels of FolylPolyGlutamyl Synthetase (FPGS) enzyme, which accumulates MTX into the cells, and they also found the contradictory result, such that FPGS mRNA expression is an independent predictive factor associated with poor response to MTX-therapy in RA patients [19]. Considering the rather complex metabolic and effector mechanism of MTX, more studies are needed to evaluate the effects of the various functional activities on MTX-response [20].
Our most relevant finding was the major difference between the RA and control groups. In general, the significant differences were the decreased MAFTotal and MAFMDR1 and higher MAFMRP1 in the RA patients compared to the control-patients calculated with or without adjustment of the effects of medicine-intake. This difference was most prominent in case of the CD8+ cells. These cells had the highest MAF-values, which is in agreement with the literature [21, 22]. Interestingly, although MTX is an MRP1 substrate, the most important and significant differences were found in MAFTotal and MAFMDR1. Hider et al. described the down regulation of MRP1 protein in PBLs by immunocytochemistry of early RA-patients after six months of MTX-therapy. They studied the MRP1 expression of 18 RA patients and 14 control persons, but they also couldn’t find any difference between the MRP1 levels of the responder and non-responder RA-patients [23]. In our study we found similar results, but we used the dynamic data of functional activity determination of MDR1 and MRP1-proteins instead of the static representation of MRP1 proteins. This, according to the earlier data, may give better insight to the significance of the MDR-proteins on treatment. Furthermore, comparing 3 RA-groups of altogether 59 RA-patients and two control groups of altogether 47 persons, we found multiple significant differences between those groups. Our results demonstrate that MTX-treatment inhibits total MDR and MDR1 functional activity in RA-patients.
Conclusions
In conclusion, by comparing the MAF values of six leukocyte subpopulations among 3 RA-patient and 2 control groups, we have found significant difference in case of granulocytes between the MTX-responder and MTX-resistant RA-group. Our results have shown multiple differences in MAF values of the MTX-responder and MTX-intolerant RA-groups, and therefore, determining MAF in RA-patients might be useful in predicting MTX-intolerance. Titrating MTX-dosage in RA-patients is quite laborious, so disclosing patients who will not benefit from dose elevation and thus avoiding the harmful side effects of MTX-treatment may have clinical relevance in the future. Our most relevant finding was, however, the decreased functional MDR1- and MRP1-activity in MTX treated RA-patients, which might be interpreted as part of the immunosupression.
Methods
Patient samples
RA patients were categorized by their DAS28 improvement rate into MTX-responder (n = 18) and MTX-resistant (n = 20) groups. An additional MTX-intolerant group was also selected as RA-patients who terminated MTX-therapy (n = 21) due to intolerable side effects. The two control groups were composed as either hospitalized (due to other diseases or traumas) patients without RA (n = 20) as well as healthy, young volunteers (n = 27). Altogether, 106 samples were grouped in three RA-groups (n = 59) and two control groups (n = 47). All peripheral blood samples were collected with the approval of the national and local ethical committee (ETT TUKEB: Scientific and Research Ethics Committee of the Medical Research Council. Ministry of Health, Medical Research Council,Budapest, H-1051, Arany János u. 6–8, Hungary.) and all patients were involved after signing their written agreement. Blood samples were taken in 5 ml BD Vacutainer tubes with EDTA (BD #367861) and stored at 4 °C until transported and processed within 6 h after sampling. PBLs were isolated using HISTOPAQUE 1077 (Sigma-Aldrich, 10771).
Calcein assay
The original calcein assay was obtained from the MultiDrugQuant Assay™ (Product No. 5 599880 083012, SOLVO Biotechnology Inc. Budaörs, Hungary, http://www.solvobiotech.com/). MDQuant Assay™ was used to determine the functional activity of MDR1 and MRP1 transporters in MAF (Multidrug Activity Factor), which is a dimensionless and standardized value calculated by the mathematical formula: MAFTotal = 100 x (FVerapamil - FHBSS)/ FVerapamil; MAFMRP1 = 100 x (FMK571 - FHBSS)/ FVerapamil; MAFMDR1 = MAFTotal – MAFMRP1 where F stands for the average mean calcein-fluorescence values of the parallel samples. Functional MDR Activity Factor (MAF) was determined in six PBL populations (granulocytes, monocytes, lymphocytes, CD4+, CD8+, CD19+ cells).
Immunocytochemistry
Immunostaining of the different PBL-subpopulations was performed at room temperature by incubating the blood cells in 100 μl HBSS containing either 1 μg of mouse anti-IgG1 antibody for isotype control (X0931, Dako) or 6ul anti-CD3,4,8 (CD3: C7225, CD4: C24865, CD8: C9494, Dako) or 12ul of anti-CD19 (C24825, Dako). The immunolabeling was visualized by incubation with 1 μg secondary Cy5-conjugated goat anti-mouse IgG antibody (115-175-003, Jackson Immuno Research).
Viability staining
Non-viable cells were labeled by incubation in 200 μL HBSS containing 1 μg/ml propidium iodide (PI; 287075, Sigma-Aldrich,) for 30 min at room temperature.
Determination of MAF-values of different white blood cell subpopulations
Measurements were performed on a FacsCalibur (Becton Dickinson, Franklin Lakes, NJ, USA) flow cytometer. The viable cells were selected by the positive staining with Calcein and lack of PI staining. Granulocytes, monocytes and lymphocytes were gated on the FSC-SSC scatterplot. The CD4, CD8 and CD19 positive subpopulations were gated based on their positivity with the corresponding antibody detected at FL4 against the non-specific binding detected with IgG1 isotype control. (Gating algorithm is shown in Fig. 2.) The shifts in the calcein signal of the leukocyte subpopulations were determined with different MDR-blockers (verapamil and MK-571) compared to HBSS control. MAFTotal, MAFMDR1 and MAFMRP1 was calculated on each subpopulations (Fig. 3).
Fig. 2.
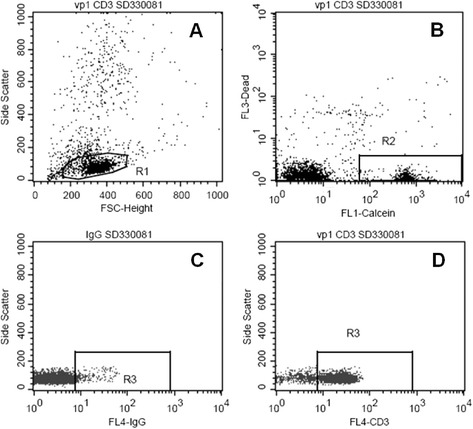
Gating out CD3+ cell population. Part a shows how the lymphocytes are gated with R1 in the FSC-SideSCatter dot-plot. The cells in R1 gate are shown on the Fl1-Fl3 graph of part b, where the viable cells are gated out by the R2 gate. Part c and d shows how the viable lymphocytes of R2 gate stain with anti-CD3 stain. R3 gate on the FL4-SSC graph is positioned to select out only the CD3+ cells
Fig. 3.
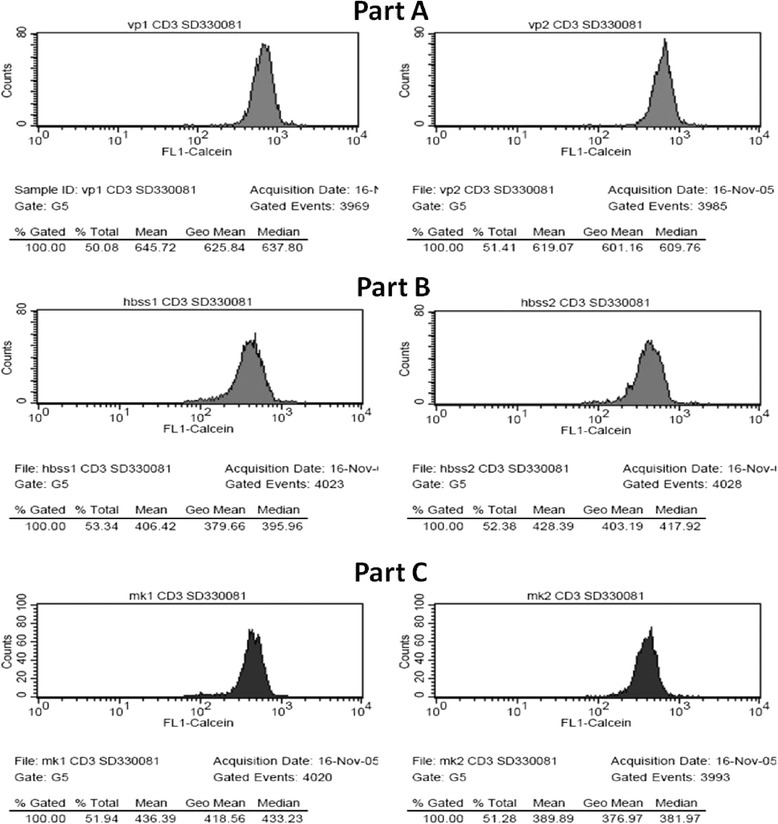
Calculating the MAF-values. This figure shows the shifts in the Fl1-Calcein-signal with the different MDR-blockers. Part a shows the two parallel samples treated with the MDR1 and MRP1 blocker Verapamil (Fl1-Calcein mean 645.72 and 619.07). Part b shows the two parallel samples of the controls incubated in HBSS (Fl1 mean 406.42 and 428.39). Part c shows the two parallel samples treated with the MRP1 blocker MK-571 (Fl1-Calcein 436.39 and 389.89). With these Fl1-Calcein values the different MAFs of the CD3+ lymphocytes are as follows MAFTotal = 34, MAFMRP1 = 0, MAFMDR1 = 34
Statistical methods
MAF measurements were modeled using analysis of covariance (ANCOVA) with residual error stratified in patient groups to allow for unequal variances. Models were fitted using the R statistical system (R Development Core Team 2007, ISBN 3-900051-07-0), with the GLS (generalized least squares) procedure of the NLME package (R Core team, 2007, R-package version 3.1-86). Models were compared by using maximum likelihood (ML) fits, and Wald-type significance tests were performed using restricted maximum likelihood (REML) estimates. Differences were considered statistically significant below the level of p = 0.05. The following predictors were considered during model selection: patient group (5 levels), sample storage duration (continuous), drug doses of methotrexate, delagil, arava, medrol (continuous), administration of the same drugs (yes/no), administration of NSAIDs (yes/no). We have selected the best model using the Akaike Information Criterion (AIC) (Akaike 1974: A new look at the statistical model identification. IEEE Transactions on Automatic Control 19 (6): 716–723.) All subsets regression was not computationally feasible due to the large number of predictors, so forward and backward stepwise variable selection algorithms were applied. When the stepwise algorithm yielded a model where the same drug was included both as a continuous and binary predictor, we checked if the coefficients corresponded to a monotonous dose-effect relationship. In case of non-monotonicity we have considered the two parameters for the same drug as overfitting, dropped the model and the stepwise algorithm was restarted twice, first omitting the binary dose variant, second omitting the continuous one. When the stepwise algorithms led to different models, the one with lowest AIC value was selected.
Abbreviations
- ABC-proteins
ATP-binding cassette proteins
- AIC
Akaike information criterion
- Calcein-AM
calcein acetoxy methylester
- DMARDs
Disease modifying anti rheumatic drugs
- EDTA
Ethylene diamine tetraacetic acid
- FPGS
Folylpolyglutamyl synthetase
- FSC-SSC
Forward SCatter – Side SCatter dot-plot
- HBSS
Hank’s balanced salt solution
- MAF
Multidrug activity factor
- MDR
Multidrug resistance
- MDR1
MultiDrug resistance protein 1, also called P-glycoprotein-170
- MRP1
Multidrug resistance related protein 1
- MDQ Assay
MultiDrug quant assayTM
- MTX
Methotrexate
- NSAIDs
Non steroid anti-inflammatory drugs
- PBLs
Peripheral blood leukocytes
- PI
Propidium iodide
- RA
Rheumatoid arthritis
- RFC
Reduced folate carrier
Footnotes
Competing interests
There is no conflict of interest.
Authors’ contributions
AL carried out the flow cytometric studies, participated in the preparation of the manuscript. TM performed the statistical analysis and drafted the manuscript. JG provided the samples, participated in the design of the study. RS and IP conceived of the study, and participated in its design and coordination and helped to draft the manuscript. All authors read and approved the final manuscript.
Authors’ information
Tamás Micsik and András Lőrincz have both contributed equally to the work as first authors.
Contributor Information
Tamás Micsik, Email: micsikt@mail.korb1.sote.hu.
András Lőrincz, Email: lorincz2.andras@ttk.mta.hu.
János Gál, Email: galj@kmk.hu.
Richard Schwab, Email: schwab@kps.hu.
István Peták, Email: Istvan.petak@oncompassmedicine.com.
References
- 1.Russell AS. Quality-of-life assessment in rheumatoid arthritis. Pharmacoeconomics. 2008;26:831–46. doi: 10.2165/00019053-200826100-00004. [DOI] [PubMed] [Google Scholar]
- 2.Morgan C, Lunt M, Brightwell H, Bradburn P, Fallow W, Lay M, et al. Contribution of patient related differences to multidrug resistance in rheumatoid arthritis. Ann Rheum Dis. 2003;62:15–9. doi: 10.1136/ard.62.1.15. [DOI] [PMC free article] [PubMed] [Google Scholar]
- 3.Goekoop-Ruiterman YP, de Vries-Bouwstra JK, Allaart CF, van Zeben D, Kerstens PJ, Hazes JM, et al. Clinical and radiographic outcomes of four different treatment strategies in patients with early rheumatoid arthritis (the BeSt study): a randomized, controlled trial. Arthritis Rheum. 2008;58:S126–35. doi: 10.1002/art.23364. [DOI] [PubMed] [Google Scholar]
- 4.O’Dell JR. Therapeutic strategies for rheumatoid arthritis. N Engl J Med. 2004;350:2591–602. doi: 10.1056/NEJMra040226. [DOI] [PubMed] [Google Scholar]
- 5.Llorente L, Richaud-Patin Y, Diaz-Borjon A, Alvarado de la Barrera C, Jakez-Ocampo J, de la Fuente H, et al. Multidrug resistance-1 (MDR-1) in rheumatic autoimmune disorders. Part I: increased P-glycoprotein activity in lymphocytes from rheumatoid arthritis patients might influence disease outcome. Joint Bone Spine. 2000;67:30–9. [PubMed]
- 6.Grant CE, Valdimarsson G, Hipfner DR, Almquist KC, Cole SP, Deeley RG. Overexpression of multidrug resistance-associated protein (MRP) increases resistance to natural product drugs. Cancer Res. 1994;54:357–61. [PubMed] [Google Scholar]
- 7.Richaud-Patin Y, Soto-Vega E, Jakez-Ocampo J, Llorente L. P-glycoprotein in autoimmune diseases. Autoimmun Rev. 2004;3:188–92. doi: 10.1016/j.autrev.2003.08.002. [DOI] [PubMed] [Google Scholar]
- 8.Jorgensen C, Maillefert JF. Multidrug resistances genes in rheumatology. Is their role immunological or pharmacological? Joint Bone Spine. 2000;67:8–10. [PubMed] [Google Scholar]
- 9.Jorgensen C, Sun R, Rossi JF, Costes J, Richard D, Bologna C, et al. Expression of a multidrug resistance gene in human rheumatoid synovium. Rheumatol Int. 1995;15:83–6. doi: 10.1007/BF00262714. [DOI] [PubMed] [Google Scholar]
- 10.Jansen G, Scheper RJ, Dijkmans BA. Multidrug resistance proteins in rheumatoid arthritis, role in disease-modifying antirheumatic drug efficacy and inflammatory processes: an overview. Scand J Rheumatol. 2003;32:325–36. doi: 10.1080/03009740310004333. [DOI] [PubMed] [Google Scholar]
- 11.Kramer R, Weber TK, Arceci R, Ramchurren N, Kastrinakis WV, Steele G, Jr, et al. Inhibition of N-linked glycosylation of P-glycoprotein by tunicamycin results in a reduced multidrug resistance phenotype. Br J Cancer. 1995;71:670–5. doi: 10.1038/bjc.1995.133. [DOI] [PMC free article] [PubMed] [Google Scholar]
- 12.Lee WP. P-glycoprotein is hyperphosphorylated in multidrug resistant HOB1 lymphoma cells treated with overdose of vincristine. Biochim Biophys Acta. 1995;1245:57–61. doi: 10.1016/0304-4165(95)00057-I. [DOI] [PubMed] [Google Scholar]
- 13.Zhang JT, Ling V. Study of membrane orientation and glycosylated extracellular loops of mouse P-glycoprotein by in vitro translation. J Biol Chem. 1991;266:18224–32. [PubMed] [Google Scholar]
- 14.Karaszi E, Jakab K, Homolya L, Szakacs G, Hollo Z, Telek B, et al. Calcein assay for multidrug resistance reliably predicts therapy response and survival rate in acute myeloid leukaemia. Br J Haematol. 2001;112:308–14. doi: 10.1046/j.1365-2141.2001.02554.x. [DOI] [PubMed] [Google Scholar]
- 15.Maillefert JF, Maynadie M, Tebib JG, Aho S, Walker P, Chatard C, et al. Expression of the multidrug resistance glycoprotein 170 in the peripheral blood lymphocytes of rheumatoid arthritis patients. The percentage of lymphocytes expressing glycoprotein 170 is increased in patients treated with prednisolone. Br J Rheumatol. 1996;35:430–5. doi: 10.1093/rheumatology/35.5.430. [DOI] [PubMed] [Google Scholar]
- 16.Yudoh K, Matsuno H, Nakazawa F, Yonezawa T, Kimura T. Increased expression of multidrug resistance of P-glycoprotein on Th1 cells correlates with drug resistance in rheumatoid arthritis. Arthritis Rheum. 1999;42:2014–5. doi: 10.1002/1529-0131(199909)42:9<2014::AID-ANR32>3.0.CO;2-R. [DOI] [PubMed] [Google Scholar]
- 17.Hooijberg JH, Broxterman HJ, Kool M, Assaraf YG, Peters GJ, Noordhuis P, et al. Antifolate resistance mediated by the multidrug resistance proteins MRP1 and MRP2. Cancer Res. 1999;59:2532–5. [PubMed] [Google Scholar]
- 18.Wolf J, Stranzl T, Filipits M, Pohl G, Pirker R, Leeb B, et al. Expression of resistance markers to methotrexate predicts clinical improvement in patients with rheumatoid arthritis. Ann Rheum Dis. 2005;64:564–8. doi: 10.1136/ard.2003.014985. [DOI] [PMC free article] [PubMed] [Google Scholar]
- 19.Stranzl T, Wolf J, Leeb BF, Smolen JS, Pirker R, Filipits M. cesponse to methotrexate therapy in patients with rheumatoid arthritis. Clin Exp Rheumatol. 2003;21:27–32. [PubMed]
- 20.van der Heijden JW, Dijkmans BA, Scheper RJ, Jansen G. Drug Insight: resistance to methotrexate and other disease-modifying antirheumatic drugs--from bench to bedside. Nat Clin Pract Rheumatol. 2007;3:26–34. doi: 10.1038/ncprheum0380. [DOI] [PubMed] [Google Scholar]
- 21.Klimecki W, Futscher B, Grogan T, Dalton W. P-glycoprotein expression and function in circulating blood cells from normal volunteers. Blood. 1994;83:2451–8. [PubMed] [Google Scholar]
- 22.Laupeze B, Amiot L, Payen L, Drenou B, Grosset JM, Lehne G, et al. Multidrug resistance protein (MRP) activity in normal mature leukocytes and CD34-positive hematopoietic cells from peripheral blood. Life Sci. 2001;68:1323–31. doi: 10.1016/S0024-3205(00)01026-2. [DOI] [PubMed] [Google Scholar]
- 23.Hider SL, Owen A, Hartkoorn R, Khoo S, Back D, Silman AJ, et al. Down regulation of multidrug resistance protein-1 expression in patients with early rheumatoid arthritis exposed to methotrexate as a first disease-modifying antirheumatic drug. Ann Rheum Dis. 2006;65:1390–3. doi: 10.1136/ard.2005.049189. [DOI] [PMC free article] [PubMed] [Google Scholar]