Abstract
Natural killer T (NKT) cells are the major early-acting immune cell type and fundamental immune modulators in ischemia-reperfusion injury (IRI). Because lymphocytes are exposed to various oxygen tensions under pathophysiologic conditions, we hypothesize that hypoxia-inducible factors (HIFs) have roles in NKT cell activation, and thus determine the final outcome of renal IRI. In this study, we used Lck-Cre transgenic mice to specifically disrupt HIF-2α in T/NKT cells and found that HIF-2α knockout led to upregulated Fas ligand expression on peripheral NKT cells, but not on conventional T cells. HIF-2α knockout promoted infiltration of NKT cells into ischemic kidneys and exacerbated IRI, which could be mitigated by in vivo NK1.1+ cell depletion or Fas ligand blockade. Compared with wild-type NKT cells, HIF-2α−/− NKT cells adoptively transferred to Rag1-knockout mice elicited more severe renal injury, and these mice were not protected by CGS21680, an adenosine A2A receptor agonist. Mechanistically, hypoxia-induced expression of adenosine A2A receptor in NKT cells and CGS21680-induced cAMP production in thymocytes were HIF-2α-dependent. Hydrogen peroxide-induced Fas ligand expression on thymic wild-type NKT cells was significantly attenuated by CGS21680 treatment, but this effect was lost in HIF-2α−/− NKT cells. Finally, CGS21680 and LPS, an inducer of HIF-2α in endothelium, synergistically reduced renal IRI substantially, but this effect was absent in Mx1-Cre-induced global HIF-2α-knockout mice. Taken together, our results reveal a hypoxia/HIF-2α/adenosine A2A receptor axis that restricts NKT cell activation when confronted with oxidative stress and thus protects against renal IRI.
Keywords: ischemic renal failure, hypoxia, immunology, ischemia-reperfusion
Renal ischemia/reperfusion injury (IRI) has important implications in clinical transplantation. IRI is a multifactorial process, among which the inflammatory response is an important contributor.1,2 CD4+ T cell is a key player in the pathogenesis of renal IRI.3,4 T cell deficiency results in resistance to renal IRI, which can be restored by the adoptive transfer of CD4+ T cells.5,6 CD4+ T cells consist of functionally distinct subsets including conventional T cells and natural killer T (NKT) cells. In contrast to T cells, NKT cells respond to stress within hours, which makes them an ideal candidate to participate in the early immune response to IR. Previous studies7,8 revealed NKT cells to be the major early-acting CD4+ cell type in IRI, which regulated the function of other subsets of inflammatory cells, and thus served as a fundamental immune modulator in IRI.
Lymphocytes frequently encounter a wide range of oxygen tensions given their highly mobile nature, and T/NKT cell responses in the context of inflammation are influenced by both hypoxia exposure9 and the expression of hypoxia-inducible factors (HIF),10 which are transcription factors regulating oxygen homeostasis. It has been shown that HIF-1α plays crucial roles in T cell survival and functions.11,12 However, the role of HIF-2α in T/NKT cells has not been explored.
HIF-2α shares 48% identity with HIF-1α and is an important transcriptional regulator of hypoxic responses, controlling a variety of processes including EPO synthesis,13 lipid metabolism,14 iron homeostasis,15 vascular tumorigenesis,16 and macrophage function.17 Studies from our group18,19 and others20 have demonstrated that HIF-2α plays a key protective role in renal IRI, by preserving endothelial integrity and functions. However, whether HIF-2α in T/NKT cells plays a role in renal IRI still remains to be elucidated.
In this study, we crossed the Lck-Cre mice21 with HIF-2α floxed mice and generated Lck-Cre+HIF-2αloxp/loxp (HIF-2α−/−) mice, to explore the role of T/NKT cell HIF-2α in renal IRI. Our results demonstrated that HIF-2α was very important in limiting NKT cell cytotoxicity in renal IRI.
Results
HIF-2α Knockout Led to Upregulated FasL Expression on Peripheral NKT Cells, but not on Conventional T Cells
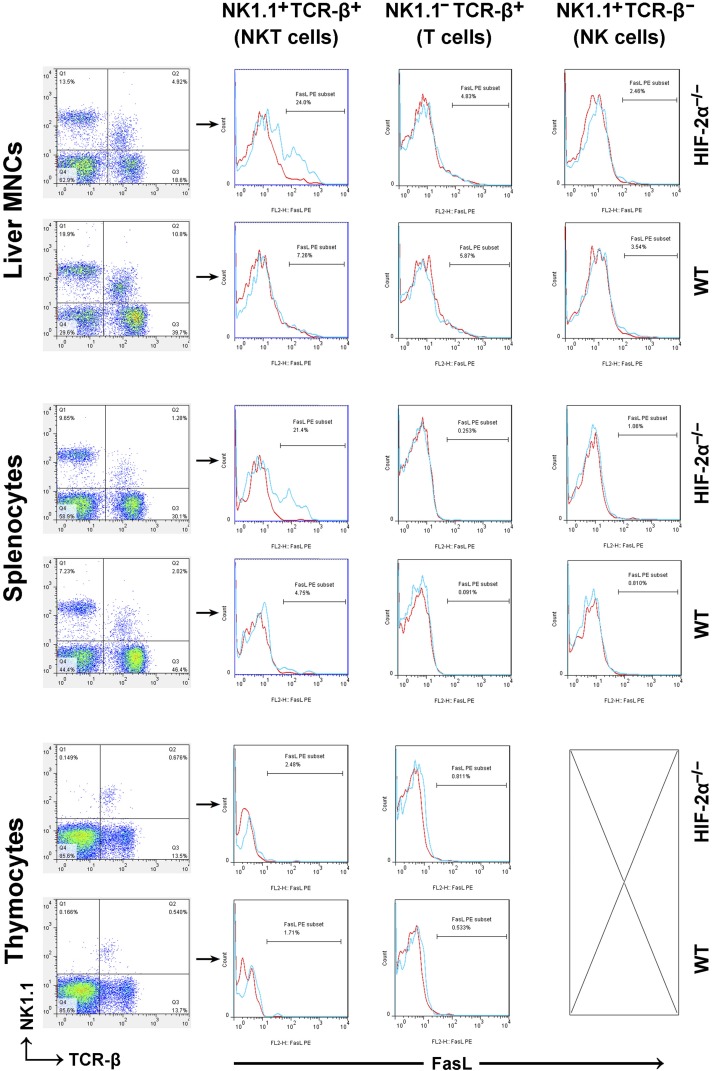
Various stress stimuli induce FasL expression on T/NKT cells and the in vivo cytotoxicity of NKT cells depends mainly on the Fas/FasL interaction.22 It was reported that blockade of the Fas/FasL interaction attenuated IRI both in the kidney23 and in the liver.24 So we isolated thymocytes, liver mononuclear cells (MNCs) and splenocytes, which were subjected to flow cytometry analyses. The results are summarized in Table 1, and a typical result is shown in Figure 1. Compared with the wild-type (WT) counterpart, HIF-2α−/− mice had relatively less NKT/T cells in the spleen and liver (but not in the thymus). NKT cells from HIF-2α−/− livers and spleens were characterized by much higher FasL expression. By contrast, FasL expression on conventional T cells or NK cells was not influenced by HIF-2α knockout (KO). Studies employing Mx1-Cre+HIF-2αloxp/loxp mice (overall HIF-2α KO) showed consistent results (Supplemental Figure 1).
Table 1.
Proportion of lymphocyte subset and percentage of FasL+ cells in liver MNCs, splenocytes and thymocytes harvested from HIF-2α−/− mice and WT littermates
| NK1.1+TCRβ+ | NK1.1–TCRβ+ | NK1.1+TCRβ– | |
|---|---|---|---|
| Proportion of lymphocyte subset (% means±SD) | |||
| HIF-2α−/− liver MNCs | 5.8±1.3a | 21.8±4.2a | 15.7±4.3 |
| WT liver MNCs | 11.2±2.7 | 37.7±5.7 | 17.6±5.1 |
| HIF-2α−/− splenocytes | 1.1±0.3a | 31.2±4.8a | 8.9±2.5 |
| WT splenocytes | 1.9±0.4 | 45.9±6.8 | 7.9±2.6 |
| HIF-2α−/− thymocytes | 0.66±0.11 | 13.6±3.4 | |
| WT thymocytes | 0.65±0.13 | 14.1±3.1 | |
| % FasL+ cells (means±SD) | |||
| HIF-2α−/− liver MNCs | 26.6±10.9a | 4.6±1.3 | 3.3±1.2 |
| WT liver MNCs | 6.8±2.1 | 4.9±1.6 | 3.5±1.6 |
| HIF-2α−/− splenocytes | 22.8±8.6a | 0.26±0.11 | 0.89±0.24 |
| WT splenocytes | 4.5±1.4 | 0.21±0.12 | 0.88±0.32 |
| HIF-2α−/− thymocytes | 2.3±0.9 | 0.79±0.24 | |
| WT thymocytes | 2.2±1.1 | 0.76±0.23 |
Values represent mean±SD of six mice of each group.
P<0.05 by t test compared with the values of WT controls, respectively.
Figure 1.
Proportion of lymphocyte subset and percentage of FasL+ cells in liver MNCs, splenocytes and thymocytes harvested from HIF-2α−/− mice and WT littermates. The mice received no previous treatments before the lymphoid organs were harvested. Single-cell suspensions were prepared as described in the Methods, and then stained with antibodies against NK1.1 (APC), TCR-β (FITC) and FasL (PE). Expression of FasL was analyzed on electronically gated NK1.1+TCR-β+(NKT), NK1.1–TCR-β+(T), or NK1.1+TCR-β–(NK) cells. Blue lines indicate the staining of FasL antibody, and red lines indicate the background staining with isotype-matched control IgG. Similar results were obtained in six independent experiments.
Lck-Cre-Mediated HIF-2α KO Exacerbated Renal IRI by Promoting Infiltration of CD4+ NKT Cells into Ischemic Kidneys
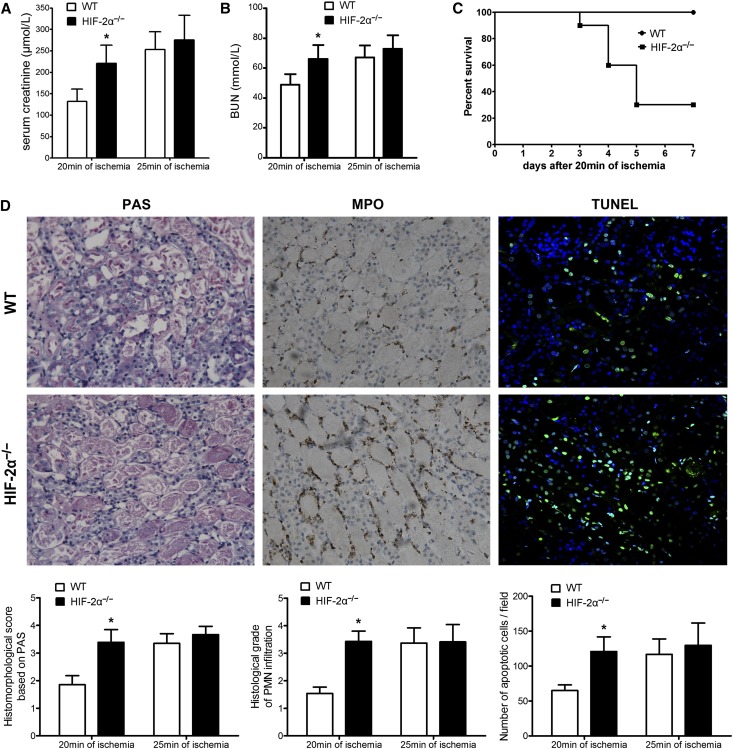
HIF-2α−/− and WT mice were subjected to renal IR procedures. At 24 hours after reperfusion, the serum levels of creatinine (Cr) and BUN were evaluated and the results are shown in Figure 2, A and B. In the groups of 20 minutes of ischemia, HIF-2α−/− mice exhibited a significant increase in both Cr and BUN levels, suggesting exacerbated renal dysfunction. There was no statistical difference in the groups of 25 min of ischemia, probably because the renal damage had reached the highest limit, which equaled the level of mice subjected to bilateral nephrectomy (data not shown). Separate groups of mice were subjected to survival experiments. All WT mice survived the challenge of 20 minutes of ischemia. By contrast, only 30% HIF-2α−/− mice could survive (P<0.05, Figure 2C). The observations were reinforced by histologic evidence (Figure 2D).
Figure 2.
The effect of T-lineage cell HIF-2α inactivation on renal IRI. HIF-2α−/− mice and WT littermates were subjected to right nephrectomy, followed by 20 or 25 min of ischemia in the left kidneys. (A) Serum creatinine and (B) BUN concentrations at 24 hours after reperfusion were shown (n=8 per group). *P<0.05 versus WT mice. (C) Survival of HIF-2α−/− and WT mice after 20 min of renal ischemia (n=20 per group). HIF-2α KO led to a significant survival disadvantage by Kaplan-Meier analysis (log-rank test, P<0.05). (D) Representative PAS, MPO staining sections and TUNEL assay in post-ischemic kidneys harvested at 24 hours from the 20-minute groups are shown. Original magnification, ×200. Abnormalities based on PAS-stained sections were graded by a semiquantitative histomorphological scoring system from 0 to 4. PMN infiltration was scored on a scale of 1–4. A summary of the quantitative analysis of apoptotic cells per field was also presented. Data are expressed as mean±SD from six to eight animals per group. *P<0.05 versus WT mice in the 20-minute group. MPO, myeloperoxidase; PAS, periodic acid–Schiff.
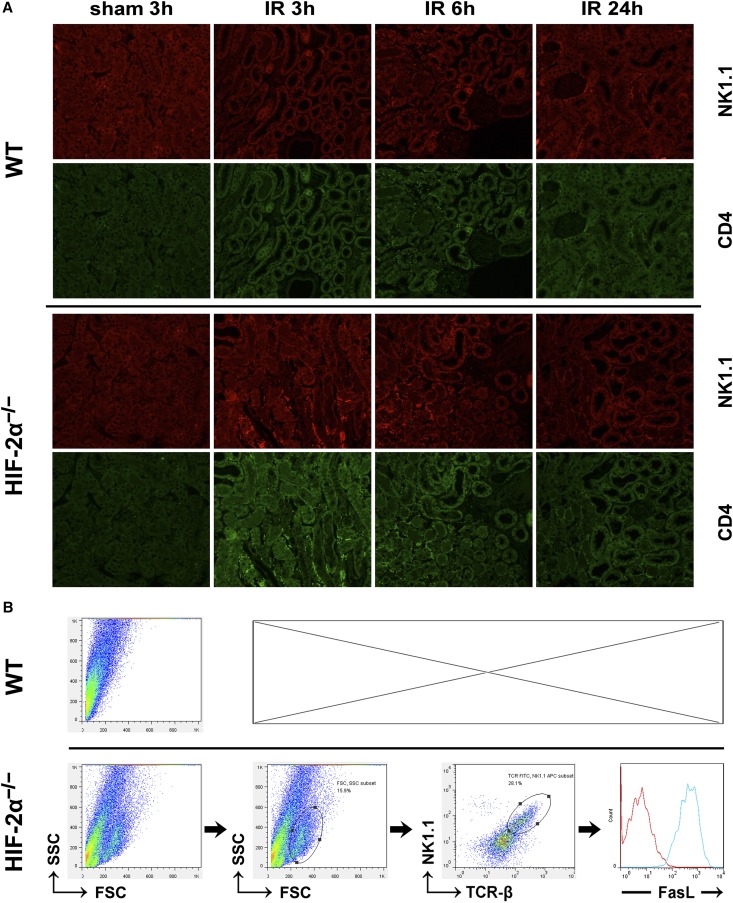
Renal sections were then subjected to immunohistofluorescence staining. As shown in Figure 3A and Table 2, the relatively mild ischemic challenge (20 minutes) promoted infiltration of few WT NKT cells into the ischemic kidneys at 3 hours after reperfusion. However, much more HIF-2α−/− NKT cells infiltrated into the kidneys at 3 hours and thereafter. In both groups, most infiltrating CD4+ cells were also NK1.1+, showing that NKT cells rather than conventional T cells dominated the immune responses. These observations were consistent with results from flow cytometry analysis of the renal inflammatory cells isolated at 3 hours after reperfusion. Moreover, the infiltrating NKT cells were fully activated because they were all FasL+ (Figure 3B).
Figure 3.
HIF-2α KO promoted infiltration of NKT cells into ischemic kidneys. (A) HIF-2α−/− and WT mice were subjected to 20 minutes of renal ischemia. Renal sections from sham-operated mice or ischemic kidneys harvested at 3, 6, and 24 hours after ischemic insult were stained with the indicated antibodies, followed by confocal microscopic analyses. Representative photographs are shown. Original magnification, ×200. Similar results were obtained in six independent experiments and summarized in Table 2. (B) HIF-2α−/− mice and WT littermates were subjected to 20 minutes of bilateral renal ischemia. Both kidneys were harvested at 3 hours after reperfusion and the infiltrating inflammatory cells were isolated by using CD45 microbeads, stained with antibodies against NK1.1 (APC), TCR-β (FITC) and FasL (PE), and subjected to FACS analysis, as described in the Concise Methods. The expression of FasL was analyzed on electronically gated NK1.1+TCR-β+ (NKT) cells. The blue line indicates the staining of FasL antibody, and the red line indicates the background staining with isotype-matched control IgG. Similar results were obtained in six independent experiments and a representative photograph are shown.
Table 2.
Number of CD4+ cells/high power field in post-ischemic kidneys harvested from HIF-2α−/− mice and WT littermates
| Sham3h | IR3ha | IR6ha | IR9ha | IR12ha | IR24h | |
|---|---|---|---|---|---|---|
| WT | 24±8 | 56±17 | 278±66 | 298±48 | 271±87 | 264±57 |
| HIF-2α−/− | 25±12 | 530±97 | 468±78 | 436±54 | 387±68 | 255±66 |
Values represent mean±SD of four mice of each group.
P<0.05 by t test between the two groups.
These results suggested that HIF-2α−/− NKT cells responded much more actively and quickly to ischemic stress, and might be responsible for the exacerbated renal IRI.
In Vivo NK1.1+ Cell Depletion or FasL Blockade Reduced Renal IRI and Eliminated the Difference between HIF-2α−/− and WT Mice
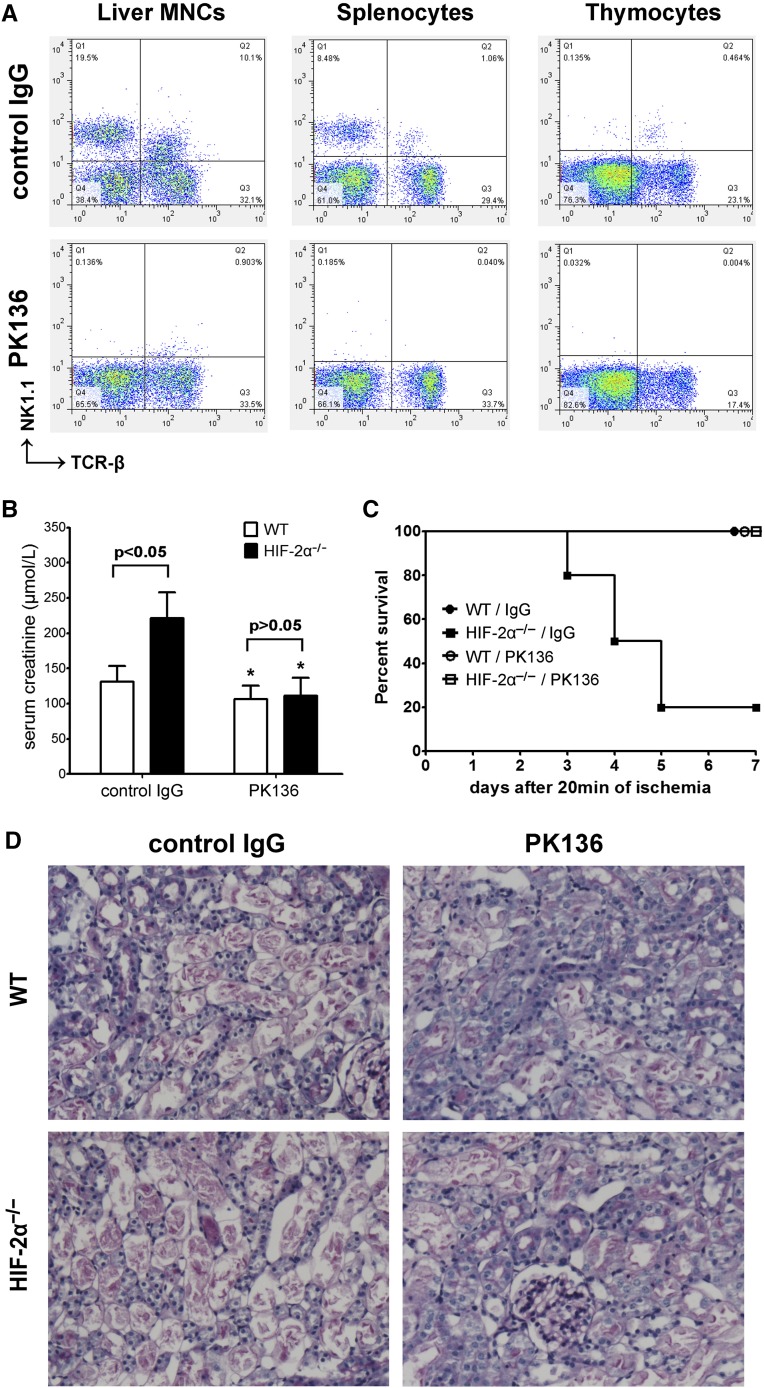
Because Lck-Cre recombinase led to gene KO in both conventional T cells (NK1.1–) and NKT cells (NK1.1+), to test the hypothesis that NKT rather than T cells contributed to the exacerbated IRI in HIF-2α−/− mice, we employed a monoclonal anti-NK1.1 antibody PK136.8 Treatment with PK136 substantially depleted NK1.1+ cells in the thymocytes, liver MNCs, and splenocytes as assessed by FACS analysis while leaving conventional T cell number intact (Figure 4A). Depletion of NK1.1+ cells reduced renal damage. More importantly, PK136 eliminated the difference between HIF-2α−/− and WT mice, and led to indefinite survival in all HIF-2α−/− mice (Figure 4, B–D). Because Lck-Cre-mediated gene targeting did not involve NK cells, these results suggested that NKT cells were responsible for the exacerbated renal IRI in HIF-2α−/− mice.
Figure 4.
In vivo NK1.1+ cell depletion eliminated the difference between HIF-2α−/− mice and WT littermates. Mice were injected intraperitoneally with 250 μg anti-NK1.1 monoclonal antibody (PK136) or isotype-matched control IgG2a at 48 hours before ischemic insult (20 minutes). (A) NK1.1+ cell depletion was confirmed by flow cytometry analysis. (B) Serum creatinine levels at 24 hours after the reperfusion (n=6 per group). *P<0.05 versus isogenic mice treated with control IgG. (C) Survival of mice after PK136/control IgG pretreatment and 20 minutes of renal ischemia (n=10 per group). Compared with control IgG, PK136 led to a significant survival advantage in HIF-2α−/− mice by Kaplan-Meier analysis (log-rank test, P<0.05). (D) Representative PAS-stained sections in post-ischemic kidneys harvested at 24 hours. Original magnification, ×200. PAS, periodic acid–Schiff.
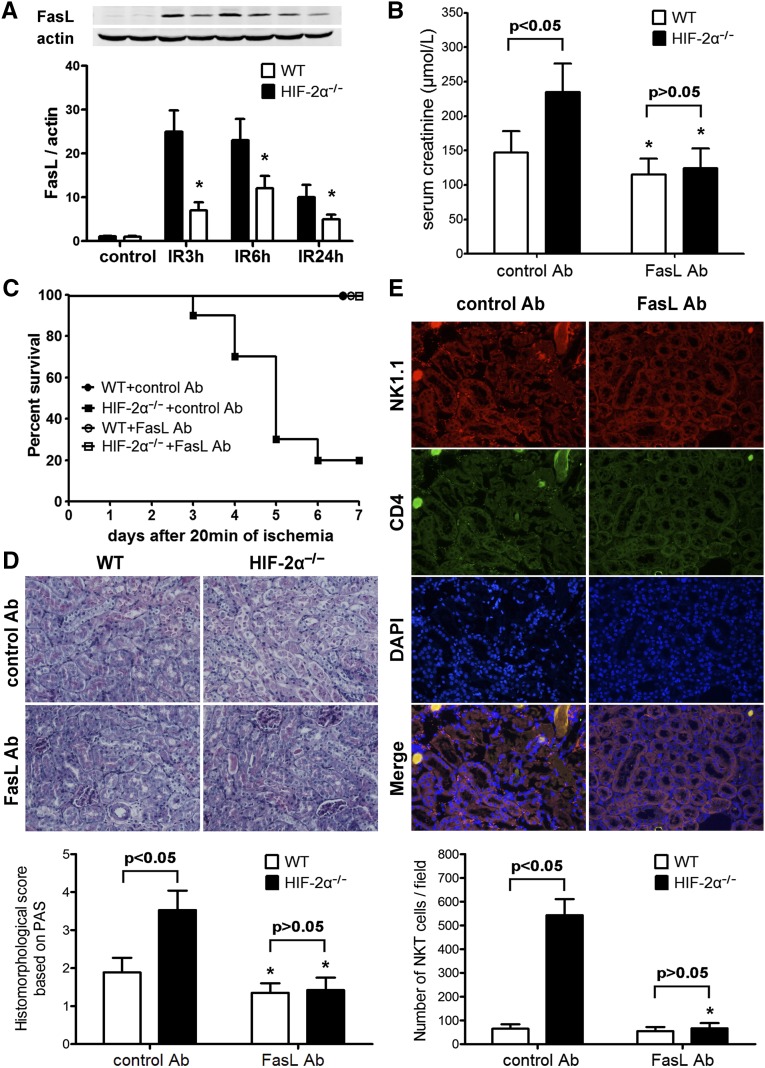
As stated above, upregulated FasL expression was observed on HIF-2α−/− NKT cells, which infiltrated into post-ischemic kidneys aggressively. To determine the role of FasL in the exacerbated renal IRI in HIF-2α−/− mice, post-ischemic kidneys were subjected to immunoblotting analysis and a representative result is shown in Figure 5A, which revealed much higher FasL expressions in HIF-2α−/− kidneys. We next employed a FasL blocking antibody (FasL Ab) to determine whether FasL was a key causative factor. Compared with isotype control Ab, FasL Ab attenuated renal IRI in both groups. Moreover, FasL blockade eliminated the difference between HIF-2α−/−and WT mice (Figure 5, B–D). Renal samples from HIF-2α−/− mice harvested at 3 hours after reperfusion were also evaluated by immunohistofluorescence staining. As shown in Figure 5E, FasL Ab efficiently inhibited the infiltration of HIF-2α−/− NKT cells into ischemic kidneys.
Figure 5.
Expression of FasL in post-ischemic kidneys and the effect of FasL blockade on renal IR injury. (A) HIF-2α−/− and WT mice were subjected to 20 minutes of renal ischemia. Renal samples were harvested at 3, 6, and 24 hours after reperfusion. The kidneys from sham-operated mice served as controls. Expression of FasL was evaluated by western blot analysis and co-detection of β-actin was performed to assess equal loading (n=4 for each group at each time point). FasL protein bands were quantified and normalized to β-actin. *P<0.05 versus HIF-2α−/− samples. (B) The mice were subjected to FasL Ab or control Ab pretreatment and 20 min of renal ischemia. Serum creatinine levels at 24 h after the reperfusion were shown (n=6 per group). *P<0.05 versus isogenic mice treated with control Ab. (C) Survival of mice after FasL Ab/control Ab pretreatment and 20 min of renal ischemia (n=10 per group). Compared with control Ab, FasL Ab led to a significant survival advantage in HIF-2α−/− mice by Kaplan-Meier analysis (log-rank test, P<0.05). (D) Representative PAS-stained sections in post-ischemic kidneys harvested at 24 h. Original magnification, ×200. Abnormalities based on PAS-stained sections were graded and data are expressed as mean±SD from 6 mice per group. *P<0.05 versus control Ab-treated isogenic mice. (E) Renal sections from ischemic kidneys harvested at 3 hours after reperfusion were stained with the NK1.1 and CD4 antibodies, followed by confocal microscopic analyses. Representative photographs from HIF-2α−/− mice are shown. Original magnification, ×200. A summary of the quantitative analysis of double-positive infiltrating cells per field was presented. Data are expressed as mean±SD from 4 animals per group. *P<0.05 versus control Ab-treated HIF-2α−/− mice. PAS, periodic acid–Schiff.
The Adenosine A2A Receptor (Adora2a) Agonist CGS21680 Lost Protective Effect against Renal IRI in HIF-2α−/− Mice
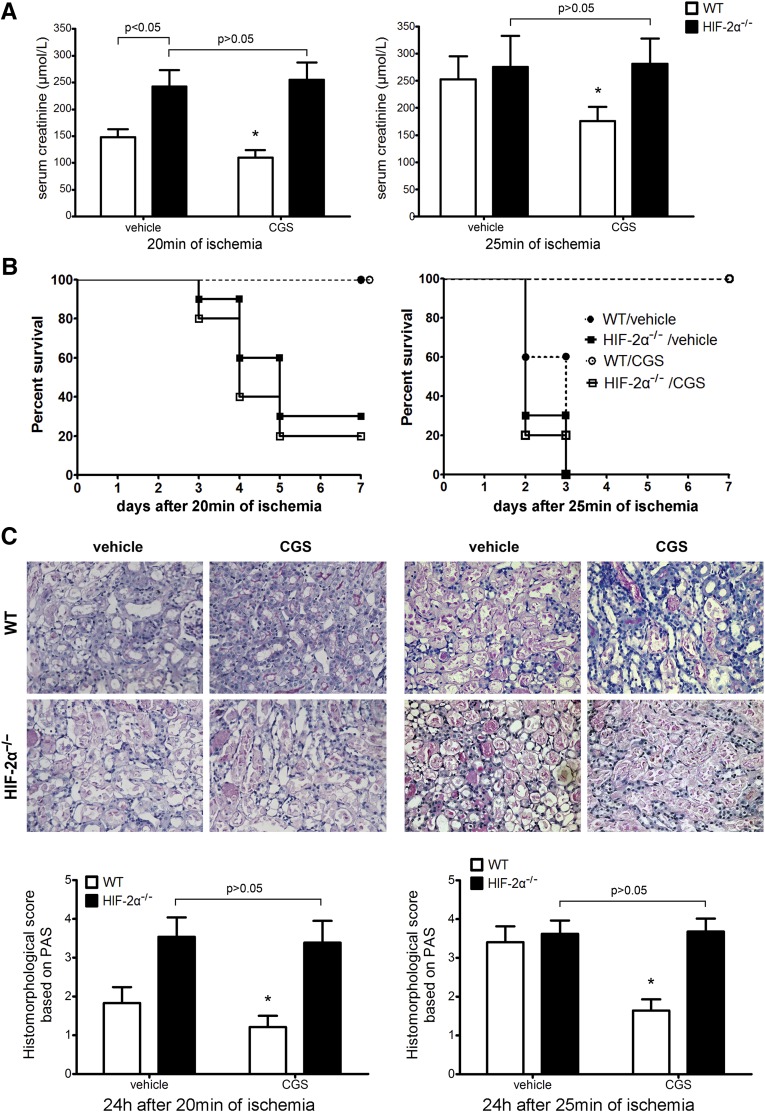
The protective effect of adora2a activation on IRI25 is based on compromised T/NKT cell activation.6,8 We next subjected HIF-2α−/− mice to an adora2a agonist CGS21680, followed by renal IR. As shown in Figure 6, CGS21680 lost effect in HIF-2α−/− mice, indicating that HIF-2α was necessary for the anti-inflammatory effect of adora2a activation. Consistently, CGS21680 also lost effect in Mx1-HIF-2α−/− mice (data not shown).
Figure 6.
The effect of CGS21680 on renal IRI in HIF-2α−/− mice and WT littermates. CGS21680 (0.7 mg/kg) or vehicle (DMSO) was administered intraperitoneally at 24 hours before renal IR. Then the mice were subjected to 20 or 25 minutes of ischemia as described above. (A) Serum creatinine concentrations at 24 hours after reperfusion (n=8 per group). *P<0.05 versus vehicle-treated WT mice. (B) Survival of HIF-2α−/− and WT mice after renal ischemia (n=20 per group). CGS21680 treatment led to a significant survival advantage in WT but not HIF-2α−/− mice by Kaplan-Meier analysis (log-rank test, P<0.05 between CGS21680 and vehicle-treated WT mice in 25 min ischemia group; P>0.05 between CGS21680 and vehicle-treated HIF-2α−/− mice in both 20 and 25 min groups). (C) Representative PAS-stained sections in post-ischemic kidneys harvested at 24 hours. Original magnification, ×200. Abnormalities based on PAS-stained sections were graded and data are expressed as mean±SD from eight mice per group. *P<0.05 versus vehicle-treated WT mice. PAS, periodic acid–Schiff.
Compared with WT NKT Cells, Adoptive Transfer of HIF-2α−/− NKT Cells Elicited more severe Renal IRI to Rag1KO Mice, which was Resistant to CGS21680 Treatment
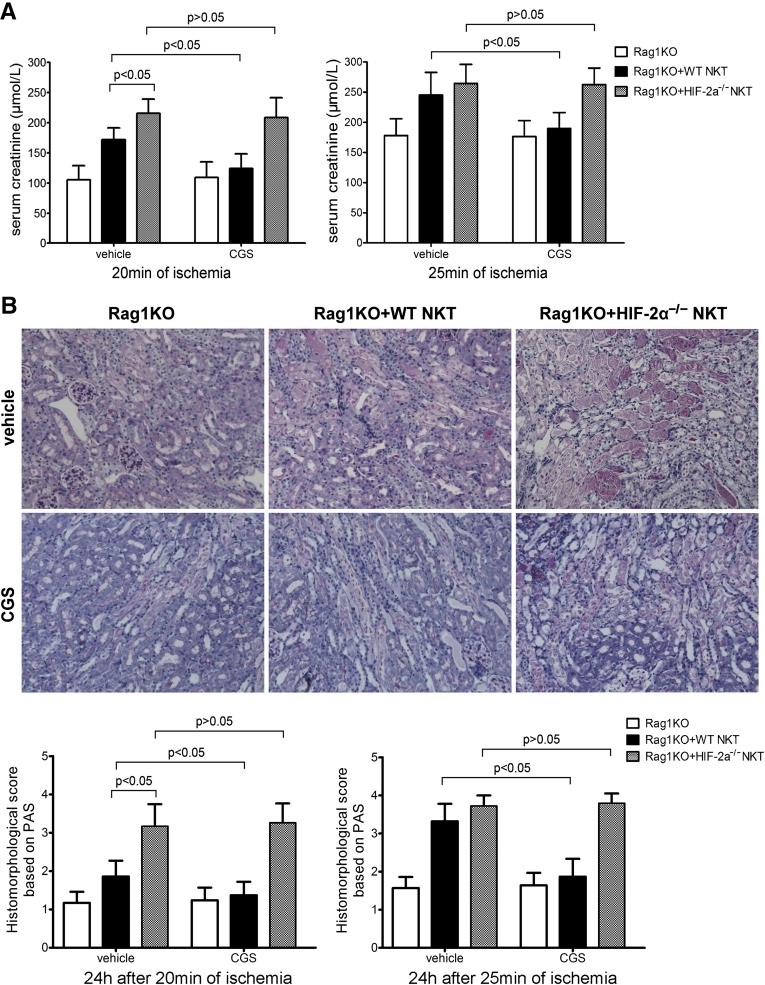
Cre recombinase specifically targeting NKT cells is not yet available, so we conducted experiments involving the adoptive transfer of NKT cells to congenic Rag1 KO (Rag1KO on C57B/6 background) mice that lacked lymphocytes including T/NKT cells.26 Using NK1.1+ iNKT Cell isolation kit, we isolated NKT lymphocytes from spleens, which were adoptively transferred into Rag1KO mice at 4 d before renal IR. Although both WT and HIF-2α−/− NKT cells reconstituted renal IR injury, the latter induced more severe damage. CGS21680 protected against renal damage when WT but not HIF-2α−/− NKT cells were transferred. The results of serum creatinine (Figure 7A) and BUN (data not shown) were consistent with periodic acid–Schiff-stained renal sections (Figure 7B). These findings suggest that HIF-2α was necessary to limit NKT cell cytotoxicity in renal IRI, probably by regulating adora2a expression and function in NKT cells.
Figure 7.
Adoptive transfer of HIF-2α−/− NKT cells elicited more severe renal IRI to Rag1KO mice than WT NKT cells, and HIF-2α−/− NKT cells were not responsive to CGS21680 treatment. NKT cells were isolated in a two-step procedure from HIF-2α−/− and WT mouse spleens. About 3×10⁵ NKT cells were adoptively transferred into one Rag1KO mouse via tail vein injection at 4 days before CGS21680 treatment and renal IRI. (A) Serum creatinine concentrations at 24 hours after reperfusion (n=4 per group). Statistical significance or insignificance is indicated. (B) Representative PAS-stained renal sections from mice subjected to 20 minutes of ischemia and 24 hours of reperfusion are shown. Original magnification, ×200. Abnormalities based on PAS-stained sections were graded and data are expressed as mean±SD from four mice per group. Statistical significance or insignificance is indicated. PAS, periodic acid–Schiff.
Hypoxia-Induced Adora2a Expression in NKT Cells was HIF-2α-Dependent
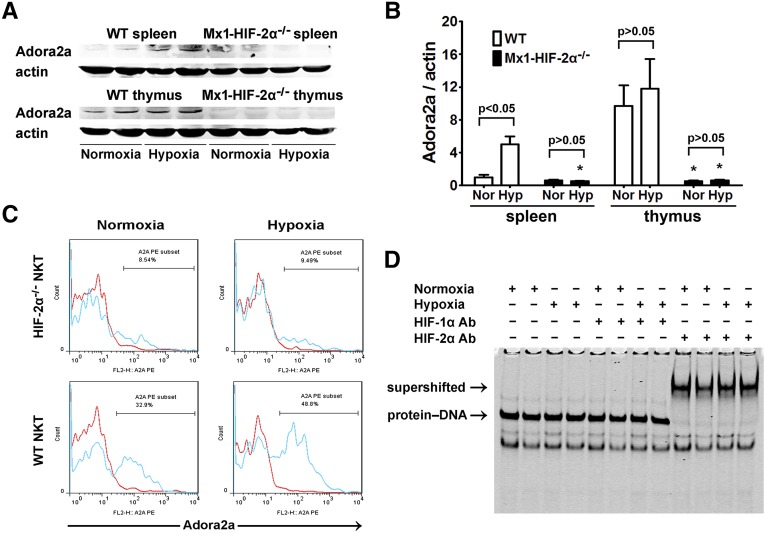
T cell receptor (TCR)-triggered FasL upregulation in T lymphocytes could be suppressed by adora2a activation.27,28 To determine whether adora2a was behind FasL upregulation in HIF-2α−/− NKT cells and the role of HIF-2α in adora2a expression, WT and Mx1-HIF-2α−/− mice were placed in air-tight chambers under normoxic (21% oxygen) or hypoxic conditions (10% oxygen). As shown in Figure 8, A and B, adora2a was constitutively expressed in thymocytes but not splenocytes. Hypoxia induced adora2a expression in splenocytes. However, adora2a could hardly be detected in Mx1-HIF-2α−/− thymuses or spleens. Splenocytes were then subjected to flow cytometry analyses, which showed that hypoxia treatment upregulated adora2a expression on WT NKT cells, which was almost absent in HIF-2α−/− NKT cells (Figure 8C). HIF-2 was previously shown to bind with high affinity to the promoter of adora2a.29 However, whether this was true in thymocytes has not been investigated previously. HIF binding activity to adora2a promoter was determined by electrophoretic mobility shift assay (EMSA) analysis using nuclear extracts from WT thymocytes. As shown in Figure 8D, only HIF-2α antibody was able to supershift the protein-DNA complex. These observations were consistent with the finding that HIF-2α was constitutively stabilized in the thymus (Supplemental Figure 2), and indicated that HIF-2 played a part in the expression of adora2a in the thymus.
Figure 8.
Hypoxia-induced adora2a expression in splenocytes, thymocytes, and NKT cells was dependent on HIF-2α. WT and Mx1-HIF-2α−/− mice were placed in air-tight modular incubation chambers either under normoxic (21% oxygen) or hypoxic conditions (10% oxygen) for 6 hours followed by 6 hours in 21% oxygen. Then spleens and thymuses were harvested. (A) Expression of adora2a was evaluated by western blot analysis and co-detection of β-actin was performed to assess equal loading (n=4 for each group). (B) Adora2a protein bands were quantified and normalized to β-actin. Data are expressed as means±SD. *P<0.05 versus the WT controls. (C) Single-cell suspensions were prepared from spleens. After the fixation and permeabilization step, the expression of adora2a was analyzed on electronically gated NK1.1+TCR-β+ (NKT) cells. Blue lines indicate the staining of adora2a antibody, and red lines indicate the background staining with isotype-matched control IgG. Similar results were obtained in four independent experiments. (D) Thymuses were harvested from normoxia or hypoxia-treated WT mice and nuclear extracts were isolated and subjected to gel mobility shift assays using a probe from mouse adora2a promoter sequence. HIF-1α or HIF-2α antibodies were added to the reaction to generate supershifts. The protein-DNA and supershifted complexes are indicated, respectively.
Adora2a Activation-Induced cAMP Production and FasL Inhibition in NKT Cells were HIF-2α-Dependent
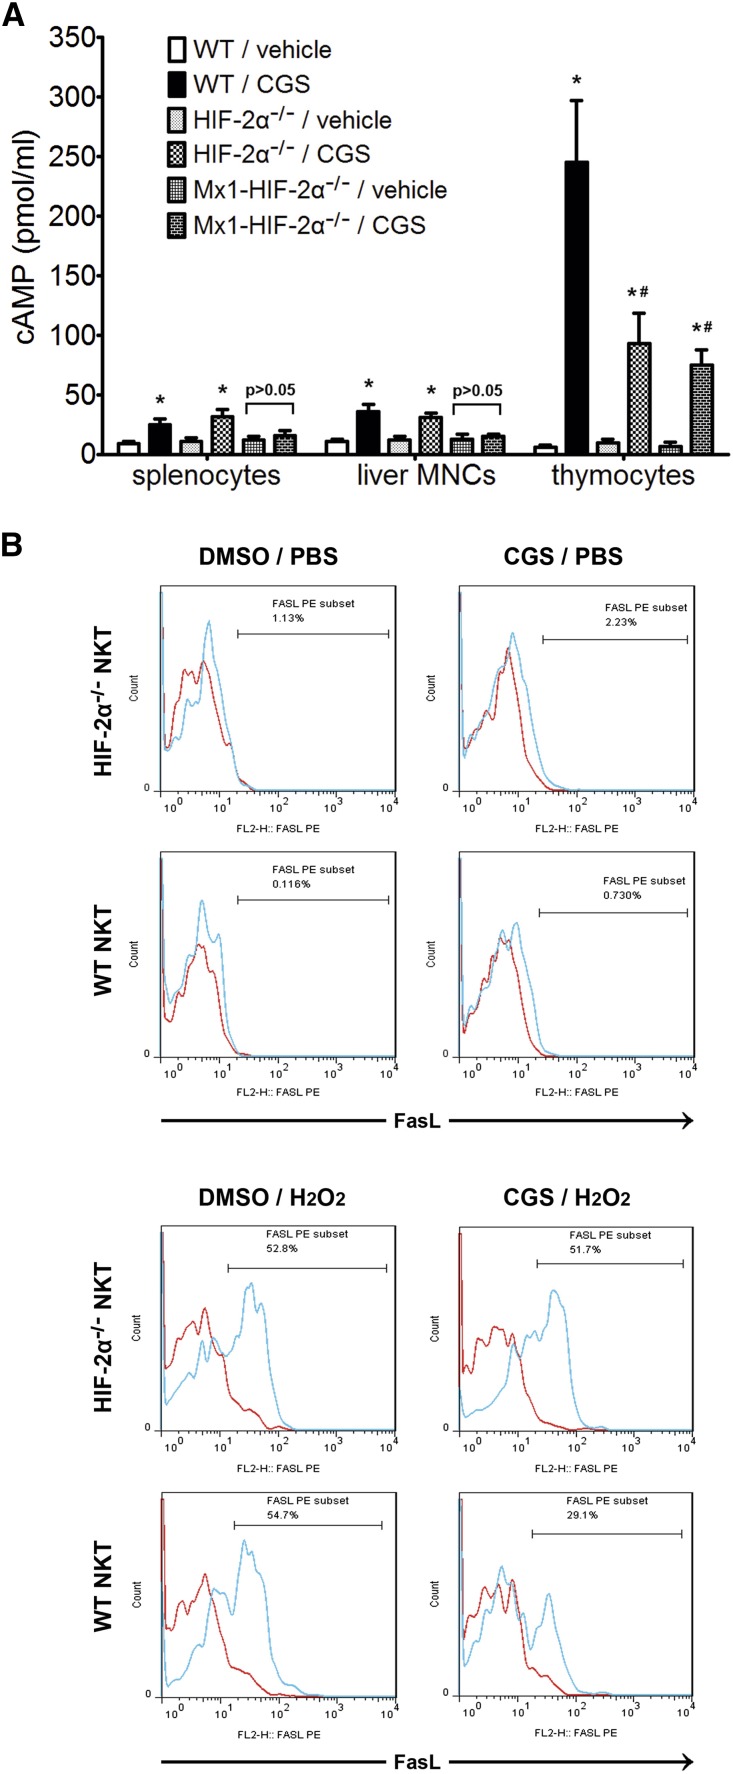
Adora2a activation stimulates intracellular cAMP production and functions through it.30 As shown in Figure 9A, CGS21680 induced much more cAMP production in thymocytes than in splenocytes or liver MNCs, which was consistent with the observation that the thymuses had much higher adora2a expression (Figure 8A). The cAMP increase in thymocytes was markedly attenuated by HIF-2α KO. However, the cAMP increase in splenocytes and liver MNCs was abrogated only in Mx1-Cre-mediated HIF-2α−/− cells, probably because the spleen and liver contained immune cells other than T/NKT cells that were not responsive to Lck-Cre-mediated gene disruption and thus could still respond to CGS21680 treatment.
Figure 9.
CGS21680-induced cAMP production and FasL inhibition in HIF-2α−/− and WT immune cells. (A) WT, HIF-2α−/− and Mx1-HIF-2α−/− mice received no previous treatments before the splenocytes, liver MNCs and thymocytes were prepared and treated with CGS21680 (10 μmol/L) or vehicle (DMSO). Intracellular cAMP level was determined by ELISA. *P<0.05 versus vehicle-treated controls. #P<0.05 versus CGS21680-treated WT thymocytes. (B) CGS21680 or DMSO was added to thymocyte suspensions at 1 hour before H2O2 (25 μmol/L) or PBS was added. Four hours later, the expression of FasL was analyzed on electronically gated NK1.1+TCR-β+ (NKT) cells. Blue lines indicate the staining of FasL antibody, and red lines indicate the background staining with isotype-matched control IgG. Similar results were obtained in four independent experiments.
As stated above, HIF-2α KO increased FasL expression on peripheral NKT cells. To determine whether this was a result of compromised adora2a expression/activation, we employed an in vitro model simulating oxidant stress by hydrogen peroxide in a similar fashion to previous reports.31 Because thymic NKT cells from both HIF-2α−/− and WT mice were FasL-negative without treatment (Figures 1 and 9B), thymocytes were used. CGS21680 was added to the culture medium of thymocytes, which were then subjected to stimulation by hydrogen peroxide. As shown in Figure 9B, hydrogen peroxide significantly promoted FasL expression on HIF-2α−/− and WT NKT cells. However, CGS21680 attenuated FasL expression on WT but not HIF-2α−/− NKT cells. These results suggested that the upregulated FasL expression on peripheral HIF-2α−/− NKT cells might be a result of adora2a deficiency and irresponsiveness to endogenous adenosine.
CGS21680/LPS Produced a Remarkable Synergistic Effect, Leading to Greatly Reduced Renal IRI, which was Dependent on HIF-2α
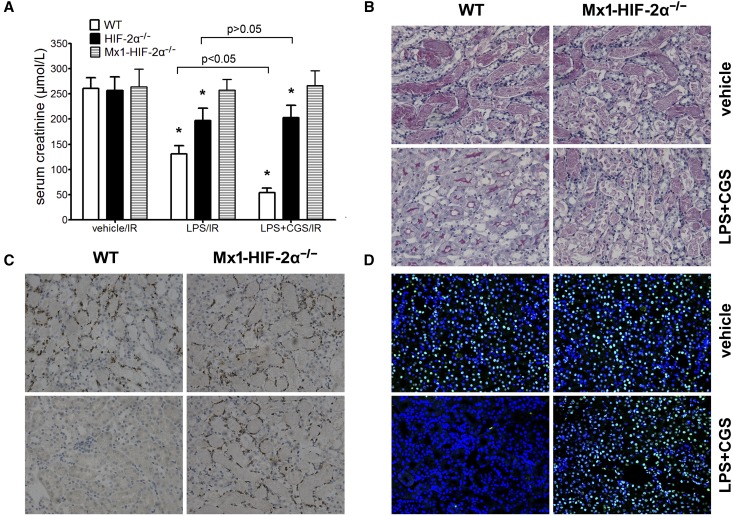
We previously demonstrated that LPS induced endothelial HIF-2α, which protected against ischemic injury.19 In this study, a combination of LPS/CGS21680 reduced the renal injury to a surprising extent in WT mice, but had no effect in Mx1-HIF-2α−/− mice (Figure 10). These results highlight the role of HIF-2α as a key protector in renal IRI, by both preserving endothelial function and reducing inflammation.
Figure 10.
The synergistic effect of CGS21680/LPS against renal IRI in WT, HIF-2α−/− and Mx1-HIF-2α−/− mice. CGS21680 (0.7 mg/kg) and LPS (3 mg/kg) were administered intraperitoneally together. Twenty-four hours later, the mice were subjected to right nephrectomy and 25 minutes of ischemia in the left kidneys, followed by 24 hours of reperfusion. (A) Serum creatinine concentrations (n=6 per group). CGS21680/LPS treatment failed to reduce creatinine level in Mx1-HIF-2α−/− mice (P>0.05 versus vehicle-treated mice). *P<0.05 versus vehicle-treated controls. Representative (B) PAS, (C) MPO staining sections and (D) TUNEL assay in post-ischemic kidneys harvested at 24 h after reperfusion. Original magnification, ×200. MPO, myeloperoxidase; PAS, periodic acid–Schiff.
Discussion
There is increasing recognition that ischemia/hypoxia may not only impair cellular energy production, but also has a regulatory impact on cellular functions. Central to hypoxia adaptation are HIFs, which have many target genes and generally increase oxygen delivery and/or improve cell survival in conditions of limited oxygen availability. However, the impact of HIF induction on the functions of specific cell types must be determined specifically.
Another mechanism that cells use for adapting to hypoxia is adenosine. It is well known that ischemic tissue damage is accompanied by adenosine accumulation as a consequence of local hypoxia.32 Adenosine signals through four receptors, among which adora2a is the major immunoregulatory arm of the adenosine signaling system, and a potent protective molecule in vivo capable of blocking inflammation.33,34 Although adora2a is located in the kidney,35,36 the protection afforded by adora2a agonists is an effect on T/NKT cells in ischemic renal injury.6,8,37
So far, several studies have suggested an important link between HIFs and adenosine-related molecules. For example, HIF-1 regulates A2B adenosine receptor expression.38 HIF-1 also regulates CD73, which converts AMP to adenosine.39 Previous studies revealed that HIF-2α was associated with adora2a expression in endothelial and chromaffin cells.29,40 In this study, we found the adora2a protein level and responsiveness to CGS21680 in immune cells were correlated with HIF-2α. Our results are important, not only because we reconfirmed the regulatory relationship between HIF-2α and adora2a in other cell types, but also because these findings provide new evidence and explanations to the well known “hypoxia-adenosinergic immunosuppression”.41,42
The fact that the thymus has a high HIF-2α protein level but no detectable HIF-1α (Supplemental Figure 2) is intriguing because the thymus is an essential organ for the generation, development and maintenance of T/NKT cell immunity. However, this is not surprising given the fact that, compared with other lymphoid organs, the thymus is hypoxic.9 Previous reports have indicated that HIF-1α primarily governs acute hypoxic responses, whereas HIF-2α functions under physiologic oxygen conditions and at prolonged hypoxia,43 which explains the difference in the expression patterns between the two HIFs in the thymus. Actually, HIF-1α overexpression leads to cell death in thymocytes.11
It was reported9 that T cell function was highly dependent on their localization and the extent of T cell activation and proliferation was decreased in environment with low oxygen tension.44 This was in line with our observation that adora2a expression/activation paralleled with hypoxia/HIF-2α in lymphoid organs, and suggested that the hypoxic environment and constitutive HIF-2α stabilization might be partially responsible for the relatively stable and immune-privileged environment in the thymus. Moreover, given the fact that tissue inflammation/destruction is always accompanied by prolonged local hypoxia, our results also suggest that hypoxia/HIF-2α/adora2a axis may serve as a molecular “brake” system to control undue inflammation through its effect on NKT cells.
It was reported27,28 that adora2a activation in T cells could inhibit their FasL expression and cytotoxicity. However, no reports correlated adora2a activation with FasL inhibition in NKT cells. We found that adora2a expression in thymocytes, splenocytes and NKT cells was HIF-2α-dependent. However, HIF-2α KO-induced FasL overexpression was observed in peripheral NKT cells but not in T cells. Why?
As we know, T/NKT cell activation, and FasL upregulation as a result, is a TCR-triggered event. T cells have highly variant TCRs specific for numerous peptide antigens. A lack of FasL expression in HIF-2α−/− T cells might only reflect that no peptide presentation was happening given the fact that the mice were healthy and not being subjected to infections. Although like T cells, the interaction between the NKT TCR and the antigen-CD1d complex also represents a central event leading to NKT cell activation, NKT cells are typically characterized by the expression of a semi-invariant TCR which can bind to a diverse array of chemically distinct antigens45 and function like “pattern-recognition receptors” in engaging a variety of lipid-based antigens like microbial lipid antigens46–49 and self-lipid antigens.50 Moreover, NKT cells do not require ongoing interactions with CD1d for activation and proliferation.51,52 So, the characteristic semi-activated basal state of NKT cells makes them quite different from conventional T cells and may explain why the former rather than the latter become activated and increase FasL expression on the background of HIF-2α/adora2a deficiency. These data thus demonstrate a previously unrecognized mechanism underlying the restriction against NKT cell activation in vivo, which is important in the context of renal IRI, and may be even more important in other circumstances, for example, the hypoxic conditions in solid tumors which escape from immunosurveillance.
Finally, our findings are of clinical importance. LPS (an inducer of HIF-2α in endothelium) produces a synergistic effect with CGS21680, and reduces renal IRI to a surprising extent. Although a combination of LPS and CGS21680 is not applicable in clinical medicine, to find pharmacological agonists targeting both endothelial and NKT HIF-2α seems to be a promising drug development strategy and may prove to be highly effective in the treatment of renal IRI.
In conclusion, our results shed light on how hypoxia is correlated with adora2a expression/activation in NKT cells and provide new insight into the potential cellular and molecular mechanisms regulating inflammation in the setting of ischemic renal injury.
Concise Methods
Mice
The Cre/loxP recombination system was used to generate HIF-2α KO mice, as described previously.19 Lck-Cre (stock number: 003802), Mx1-Cre (003556) transgene mice, HIF-2α floxed mice (008407), as well as Rag1KO mice (002216) were all from The Jackson Laboratory (Bar Harbor, ME). The mating strategy, genotyping and the confirmation of target gene excision are described in the Supplemental Material. A typical genotyping result is shown in Supplemental Figure 1 to show target gene excision in multiple lymphoid organs and purified NKT cells.
Male mice, 8–14 weeks of age and weighing 20–28 g, were used in the present study. All animal experiments were conducted according to NIH guide for the care and use of laboratory animals and the institutional guidelines of Shanghai Jiaotong University School of Medicine. All the procedures described were approved by the Animal Use and Care Committee of Shanghai Jiaotong University School of Medicine (approval number: SYKX-2012–0013).
Renal Ischemia-Reperfusion (IR) and Drug Treatment
A warm renal IR model was used as described.18 The selective adora2a agonist, CGS21680 (0.7 mg/kg, dissolved in DMSO; Sigma-Aldrich, St. Louis, MO) was administered intraperitoneally at 24 h before renal IR. In some experiments, CGS21680 was given together with LPS (3 mg/kg, intraperitoneally, from Escherichia coli serotype 055:B5; Sigma-Aldrich). The details of the surgical operation and the application of pharmacologic agents are described in the Supplemental Material.
Whole Body Exposure to Low Oxygen Atmosphere
Some mice were placed in air-tight modular incubation chambers (Shanghai Alcott Biotech Co. Ltd., China) and the atmosphere was controlled by a constant gas flow (1.5 L/min) containing 21% or 10% O2.
Preparation of Single-Cell Suspensions from Lymphoid Organs, Oxidative Stress Treatment and Flow Cytometry Analysis
Single-cell suspensions from spleens and thymuses were prepared by running specific gentleMACS programs on a gentleMACS dissociator (Miltenyi Biotec, Bergisch Gladbach, Germany), according to the manufacturer’s optimized protocols. Liver MNCs were prepared by using the gentleMACS dissociator according to the manufacturer’s protocol and a previous report,53 with modifications. Isolation of the infiltrating inflammatory cells from the ischemic kidneys was achieved by running specific gentleMACS programs on the gentleMACS dissociator, followed by positive selection using CD45 microbeads (130–052–301; Miltenyi Biotec). The details are described in the Supplemental Material.
The cell suspensions were incubated with anti-mouse CD16/CD32 blocking antibody prior to staining. Then, samples were labeled using combinations of the following antibodies: anti-NK1.1 APC (17–5941; eBioscience, San Diego, CA), anti–TCR-β FITC (11–5961; eBioscience), anti-FasL PE (12–5911; eBioscience) or anti-adora2a PE (sc-32261; Santa Cruz Biotechnology, Dallas, TX). When adora2a was detected, antibodies were added to the samples after the fixation and permeabilization step by using the intracellular fixation and permeabilization buffer set (88–8824; eBioscience) according to the manufacturer’s protocol. Immunofluorescence staining was analyzed using a FACSCalibur instrument (BD Biosciences, San Jose, CA). The lymphocytes were gated using forward and side scatter to exclude debris and dead cells, and then 30,000 events were acquired in each assay for analysis.
In some experiments, CGS21680 (10 μmol/L) or DMSO (vehicle) were added to the culture medium of thymocytes at 1 hour before H2O2 (25 μmol/L) was added. Four hours later, the cells were labeled with the antibodies (NK1.1, TCR-β and FasL) and subjected to FACS analysis.
NKT Cell Purification from Splenocytes and Adoptive Transfer
NKT cell isolation was performed in a two-step procedure from mouse spleens using a commercially available NK1.1+ iNKT Cell Isolation Kit (130–096–513; Miltenyi Biotec), according to the manufacturer’s protocols. Typically, this method produced cell populations of >90% NKT cells from splenocytes (Supplemental Figure 3). About 3×10⁵ NKT cells (from four to six mice) were adoptively transferred into a Rag1KO mouse via tail vein injection at 4 days before renal IRI. Successful reconstitution was confirmed by FACS analysis of splenocytes collected at 24 hours after reperfusion. Control animals received vehicle injections. The details are described in the Supplemental Material.
NK1.1+ Cell Depletion and FasL Blockade
To deplete NK cells and NKT cells, mice were injected intraperitoneally with 250 μg anti-NK1.1 mAb (PK136, M100N2–14F; Sungene Biotech Co., Tianjin, China) or isotype-matched control IgG2a (control IgG) 48 hours before renal IR insult. The depletion of NK1.1+ cells was confirmed by flow cytometry analysis after the experimental procedures and sacrifice of the mice. This protocol produced a >90% decrease in the number of the indicated cells.
FasL blockade was implemented by in vivo administration of a functional-grade purified anti-mouse FasL antibody, as previously described.23 Anti-FasL Ab (16–5911; eBioscience) or control hamster IgG (control Ab) were injected intraperitoneally (500 μg per mouse) at 24 hours before IR insult, and a booster injection at half dose was administered immediately after the initiation of reperfusion.
Immunohistofluorescence Staining
After incubation with primary antibodies for anti-CD4 and NK1.1 (1:100; Novus Biologicals, Littleton, CO) overnight at 4°C, the paraffin-embedded renal sections were washed with PBS three times and incubated with FITC conjugated secondary donkey anti-rabbit IgG (1:200) and cyanin 3 (Cy3) conjugated secondary donkey anti-mouse IgG (1:300, both from Wuhan goodbio technology Co., Wuhan, China) for 1 hour at room temperature in a darkened humidified chamber. Finally, the preparations were washed with PBS and mounted with fluorescent mounting medium containing 4ʹ,6-diamidino-2-phenylindole (Beyotime Institute of Biotechnology, Shanghai, China). Each section was observed under a confocal laser scanning microscope at a magnification of ×200.
Measurement of Intracellular cAMP Accumulation
Intracellular cAMP level was detected by using a Monoclonal Anti-cAMP Antibody-Based Direct cAMP ELISA Kit (NewEast Biosciences, Malvern, PA), as described previously.54 The details are described in the Supplemental Material.
Measurement of Creatinine and BUN
Serum creatinine (Cr) and BUN levels were measured via a standard clinical automatic analyzer (Siemens Dimension Xpand; Dade Behring, Marburg Germany).
Histomorphological Analyses
Paraffin-embedded kidney tissues were stained with periodic acid–Schiff, processed for immunohistochemical localization of myeloperoxidase, or subjected to TUNEL assay. Details are in the Supplemental Material.
Western Blot Analyses
Western blot analyses of HIF-1α (NB100–134; Novus Biologicals), HIF-2α (ab199; Abcam, Inc.), adora2a (sc-13937; Santa Cruz Biotechnology) and FasL (ab15285; Abcam, Inc.) were performed as described previously.18 Detailed procedures are described in the Supplemental Material.
EMSA
Protein-DNA interaction was detected by using an Odyssey Infrared EMSA Kit (LI-COR, Lincoln, NE), according to the manufacturer’s protocols. Briefly, nuclear extracts from thymuses were assembled with a DyLight 680-labeled double-stranded DNA probe (Takara Co., Dalian, China) from mouse adora2a promoter sequence, which was located about 34 bp upstream of mouse adora2a exon 1, as described by a previous report.29 The sense sequence was 5′-GGACGCGTGGACCTGAAGCGCCCACGTTGGGG-3′. The signal was detected and quantified with Odyssey infrared imaging system (LI-COR). Supershift assays using HIF-1α or HIF-2α antibody were also conducted to confirm the specificity of HIF/DNA-binding activity. The details are described in the Supplemental Material.
Statistical Analyses
All values were reported as means±SD. Data were analyzed by one-way ANOVA with a subsequent Student–Newman–Keul’s test, or a t test where applicable. Statistical significance was set at P<0.05.
Disclosures
None.
Supplementary Material
Acknowledgments
This work was supported by grants from the National Natural Science Foundation of China (grant number: 81470895) to M.Z. and (grant number: 81270558) to Q.X.
Footnotes
Published online ahead of print. Publication date available at www.jasn.org.
This article contains supplemental material online at http://jasn.asnjournals.org/lookup/suppl/doi:10.1681/ASN.2014121248/-/DCSupplemental.
References
- 1.Jang HR, Ko GJ, Wasowska BA, Rabb H: The interaction between ischemia-reperfusion and immune responses in the kidney. J Mol Med (Berl) 87: 859–864, 2009 [DOI] [PubMed] [Google Scholar]
- 2.Thurman JM: Triggers of inflammation after renal ischemia/reperfusion. Clin Immunol 123: 7–13, 2007 [DOI] [PMC free article] [PubMed] [Google Scholar]
- 3.Huang Y, Rabb H, Womer KL: Ischemia-reperfusion and immediate T cell responses. Cell Immunol 248: 4–11, 2007 [DOI] [PMC free article] [PubMed] [Google Scholar]
- 4.Rabb H, Daniels F, O’Donnell M, Haq M, Saba SR, Keane W, Tang WW: Pathophysiological role of T lymphocytes in renal ischemia-reperfusion injury in mice. Am J Physiol Renal Physiol 279: F525–F531, 2000 [DOI] [PubMed] [Google Scholar]
- 5.Burne MJ, Daniels F, El Ghandour A, Mauiyyedi S, Colvin RB, O’Donnell MP, Rabb H: Identification of the CD4(+) T cell as a major pathogenic factor in ischemic acute renal failure. J Clin Invest 108: 1283–1290, 2001 [DOI] [PMC free article] [PubMed] [Google Scholar]
- 6.Day YJ, Huang L, Ye H, Li L, Linden J, Okusa MD: Renal ischemia-reperfusion injury and adenosine 2A receptor-mediated tissue protection: the role of CD4+ T cells and IFN-gamma. J Immunol 176: 3108–3114, 2006 [DOI] [PubMed] [Google Scholar]
- 7.Li L, Huang L, Sung SS, Lobo PI, Brown MG, Gregg RK, Engelhard VH, Okusa MD: NKT cell activation mediates neutrophil IFN-gamma production and renal ischemia-reperfusion injury. J Immunol 178: 5899–5911, 2007 [DOI] [PubMed] [Google Scholar]
- 8.Lappas CM, Day YJ, Marshall MA, Engelhard VH, Linden J: Adenosine A2A receptor activation reduces hepatic ischemia reperfusion injury by inhibiting CD1d-dependent NKT cell activation. J Exp Med 203: 2639–2648, 2006 [DOI] [PMC free article] [PubMed] [Google Scholar]
- 9.Ohta A, Diwanji R, Kini R, Subramanian M, Ohta A, Sitkovsky M: In vivo T cell activation in lymphoid tissues is inhibited in the oxygen-poor microenvironment. Front Immunol 2; 27: 1–10, 2011 [DOI] [PMC free article] [PubMed] [Google Scholar]
- 10.McNamee EN, Korns Johnson D, Homann D, Clambey ET: Hypoxia and hypoxia-inducible factors as regulators of T cell development, differentiation, and function. Immunol Res 55: 58–70, 2013 [DOI] [PMC free article] [PubMed] [Google Scholar]
- 11.Biju MP, Neumann AK, Bensinger SJ, Johnson RS, Turka LA, Haase VH: Vhlh gene deletion induces Hif-1-mediated cell death in thymocytes. Mol Cell Biol 24: 9038–9047, 2004 [DOI] [PMC free article] [PubMed] [Google Scholar]
- 12.Lukashev D, Klebanov B, Kojima H, Grinberg A, Ohta A, Berenfeld L, Wenger RH, Ohta A, Sitkovsky M: Cutting edge: hypoxia-inducible factor 1alpha and its activation-inducible short isoform I.1 negatively regulate functions of CD4+ and CD8+ T lymphocytes. J Immunol 177: 4962–4965, 2006 [DOI] [PubMed] [Google Scholar]
- 13.Rankin EB, Biju MP, Liu Q, Unger TL, Rha J, Johnson RS, Simon MC, Keith B, Haase VH: Hypoxia-inducible factor-2 (HIF-2) regulates hepatic erythropoietin in vivo. J Clin Invest 117: 1068–1077, 2007 [DOI] [PMC free article] [PubMed] [Google Scholar]
- 14.Rankin EB, Rha J, Selak MA, Unger TL, Keith B, Liu Q, Haase VH: Hypoxia-inducible factor 2 regulates hepatic lipid metabolism. Mol Cell Biol 29: 4527–4538, 2009 [DOI] [PMC free article] [PubMed] [Google Scholar]
- 15.Mastrogiannaki M, Matak P, Peyssonnaux C: The gut in iron homeostasis: role of HIF-2 under normal and pathological conditions. Blood 122: 885–892, 2013 [DOI] [PMC free article] [PubMed] [Google Scholar]
- 16.Rankin EB, Rha J, Unger TL, Wu CH, Shutt HP, Johnson RS, Simon MC, Keith B, Haase VH: Hypoxia-inducible factor-2 regulates vascular tumorigenesis in mice. Oncogene 27: 5354–5358, 2008 [DOI] [PMC free article] [PubMed] [Google Scholar]
- 17.Imtiyaz HZ, Williams EP, Hickey MM, Patel SA, Durham AC, Yuan LJ, Hammond R, Gimotty PA, Keith B, Simon MC: Hypoxia-inducible factor 2alpha regulates macrophage function in mouse models of acute and tumor inflammation. J Clin Invest 120: 2699–2714, 2010 [DOI] [PMC free article] [PubMed] [Google Scholar]
- 18.Zhang S, Han CH, Chen XS, Zhang M, Xu LM, Zhang JJ, Xia Q: Transient ureteral obstruction prevents against kidney ischemia/reperfusion injury via hypoxia-inducible factor (HIF)-2α activation. PLoS ONE 7: e29876, 2012 [DOI] [PMC free article] [PubMed] [Google Scholar]
- 19.He K, Chen X, Han C, Xu L, Zhang J, Zhang M, Xia Q: Lipopolysaccharide-induced cross-tolerance against renal ischemia-reperfusion injury is mediated by hypoxia-inducible factor-2α-regulated nitric oxide production. Kidney Int 85: 276–288, 2014 [DOI] [PubMed] [Google Scholar]
- 20.Kapitsinou PP, Sano H, Michael M, Kobayashi H, Davidoff O, Bian A, Yao B, Zhang MZ, Harris RC, Duffy KJ, Erickson-Miller CL, Sutton TA, Haase VH: Endothelial HIF-2 mediates protection and recovery from ischemic kidney injury. J Clin Invest 124: 2396–2409, 2014 [DOI] [PMC free article] [PubMed] [Google Scholar]
- 21.Kishimoto H, Ohteki T, Yajima N, Kawahara K, Natsui M, Kawarasaki S, Hamada K, Horie Y, Kubo Y, Arase S, Taniguchi M, Vanhaesebroeck B, Mak TW, Nakano T, Koyasu S, Sasaki T, Suzuki A: The Pten/PI3K pathway governs the homeostasis of Valpha14iNKT cells. Blood 109: 3316–3324, 2007 [DOI] [PubMed] [Google Scholar]
- 22.Wingender G, Krebs P, Beutler B, Kronenberg M: Antigen-specific cytotoxicity by invariant NKT cells in vivo is CD95/CD178-dependent and is correlated with antigenic potency. J Immunol 185: 2721–2729, 2010 [DOI] [PMC free article] [PubMed] [Google Scholar]
- 23.Ko GJ, Jang HR, Huang Y, Womer KL, Liu M, Higbee E, Xiao Z, Yagita H, Racusen L, Hamad AR, Rabb H: Blocking Fas ligand on leukocytes attenuates kidney ischemia-reperfusion injury. J Am Soc Nephrol 22: 732–742, 2011 [DOI] [PMC free article] [PubMed] [Google Scholar]
- 24.Nakajima H, Mizuta N, Fujiwara I, Sakaguchi K, Ogata H, Magae J, Yagita H, Koji T: Blockade of the Fas/Fas ligand interaction suppresses hepatocyte apoptosis in ischemia-reperfusion rat liver. Apoptosis 13: 1013–1021, 2008 [DOI] [PubMed] [Google Scholar]
- 25.Okusa MD, Linden J, Macdonald T, Huang L: Selective A2A adenosine receptor activation reduces ischemia-reperfusion injury in rat kidney. Am J Physiol 277: F404–F412, 1999 [DOI] [PubMed] [Google Scholar]
- 26.Mombaerts P, Iacomini J, Johnson RS, Herrup K, Tonegawa S, Papaioannou VE: RAG-1-deficient mice have no mature B and T lymphocytes. Cell 68: 869–877, 1992 [DOI] [PubMed] [Google Scholar]
- 27.Koshiba M, Kojima H, Huang S, Apasov S, Sitkovsky MV: Memory of extracellular adenosine A2A purinergic receptor-mediated signaling in murine T cells. J Biol Chem 272: 25881–25889, 1997 [DOI] [PubMed] [Google Scholar]
- 28.Himer L, Csóka B, Selmeczy Z, Koscsó B, Pócza T, Pacher P, Németh ZH, Deitch EA, Vizi ES, Cronstein BN, Haskó G: Adenosine A2A receptor activation protects CD4+ T lymphocytes against activation-induced cell death. FASEB J 24: 2631–2640, 2010 [DOI] [PMC free article] [PubMed] [Google Scholar]
- 29.Brown ST, Reyes EP, Nurse CA: Chronic hypoxia upregulates adenosine 2a receptor expression in chromaffin cells via hypoxia inducible factor-2α: role in modulating secretion. Biochem Biophys Res Commun 412: 466–472, 2011 [DOI] [PubMed] [Google Scholar]
- 30.Lappas CM, Rieger JM, Linden J: A2A adenosine receptor induction inhibits IFN-gamma production in murine CD4+ T cells. J Immunol 174: 1073–1080, 2005 [DOI] [PubMed] [Google Scholar]
- 31.Facchinetti F, Furegato S, Terrazzino S, Leon A: H(2)O(2) induces upregulation of Fas and Fas ligand expression in NGF-differentiated PC12 cells: modulation by cAMP. J Neurosci Res 69: 178–188, 2002 [DOI] [PubMed] [Google Scholar]
- 32.Ohta A, Sitkovsky M: Role of G-protein-coupled adenosine receptors in downregulation of inflammation and protection from tissue damage. Nature 414: 916–920, 2001 [DOI] [PubMed] [Google Scholar]
- 33.Lukashev D, Ohta A, Apasov S, Chen JF, Sitkovsky M: Cutting edge: Physiologic attenuation of proinflammatory transcription by the Gs protein-coupled A2A adenosine receptor in vivo. J Immunol 173: 21–24, 2004 [DOI] [PubMed] [Google Scholar]
- 34.Haskó G, Pacher P: A2A receptors in inflammation and injury: lessons learned from transgenic animals. J Leukoc Biol 83: 447–455, 2008 [DOI] [PMC free article] [PubMed] [Google Scholar]
- 35.Bauerle JD, Grenz A, Kim JH, Lee HT, Eltzschig HK: Adenosine generation and signaling during acute kidney injury. J Am Soc Nephrol 22: 14–20, 2011 [DOI] [PubMed] [Google Scholar]
- 36.Levens N, Beil M, Jarvis M: Renal actions of a new adenosine agonist, CGS 21680A selective for the A2 receptor. J Pharmacol Exp Ther 257: 1005–1012, 1991 [PubMed] [Google Scholar]
- 37.Day YJ, Huang L, McDuffie MJ, Rosin DL, Ye H, Chen JF, Schwarzschild MA, Fink JS, Linden J, Okusa MD: Renal protection from ischemia mediated by A2A adenosine receptors on bone marrow-derived cells. J Clin Invest 112: 883–891, 2003 [DOI] [PMC free article] [PubMed] [Google Scholar]
- 38.Kong T, Westerman KA, Faigle M, Eltzschig HK, Colgan SP: HIF-dependent induction of adenosine A2B receptor in hypoxia. FASEB J 20: 2242–2250, 2006 [DOI] [PubMed] [Google Scholar]
- 39.Synnestvedt K, Furuta GT, Comerford KM, Louis N, Karhausen J, Eltzschig HK, Hansen KR, Thompson LF, Colgan SP: Ecto-5′-nucleotidase (CD73) regulation by hypoxia-inducible factor-1 mediates permeability changes in intestinal epithelia. J Clin Invest 110: 993–1002, 2002 [DOI] [PMC free article] [PubMed] [Google Scholar]
- 40.Ahmad A, Ahmad S, Glover L, Miller SM, Shannon JM, Guo X, Franklin WA, Bridges JP, Schaack JB, Colgan SP, White CW: Adenosine A2A receptor is a unique angiogenic target of HIF-2alpha in pulmonary endothelial cells. Proc Natl Acad Sci U S A 106: 10684–10689, 2009 [DOI] [PMC free article] [PubMed] [Google Scholar]
- 41.Sitkovsky M, Ohta A: Targeting the hypoxia-adenosinergic signaling pathway to improve the adoptive immunotherapy of cancer. J Mol Med (Berl) 91: 147–155, 2013 [DOI] [PMC free article] [PubMed] [Google Scholar]
- 42.Sitkovsky MV, Kjaergaard J, Lukashev D, Ohta A: Hypoxia-adenosinergic immunosuppression: tumor protection by T regulatory cells and cancerous tissue hypoxia. Clin Cancer Res 14: 5947–5952, 2008 [DOI] [PubMed] [Google Scholar]
- 43.Holmquist-Mengelbier L, Fredlund E, Löfstedt T, Noguera R, Navarro S, Nilsson H, Pietras A, Vallon-Christersson J, Borg A, Gradin K, Poellinger L, Påhlman S: Recruitment of HIF-1alpha and HIF-2alpha to common target genes is differentially regulated in neuroblastoma: HIF-2alpha promotes an aggressive phenotype. Cancer Cell 10: 413–423, 2006 [DOI] [PubMed] [Google Scholar]
- 44.Atkuri KR, Herzenberg LA, Herzenberg LA: Culturing at atmospheric oxygen levels impacts lymphocyte function. Proc Natl Acad Sci U S A 102: 3756–3759, 2005 [DOI] [PMC free article] [PubMed] [Google Scholar]
- 45.Uldrich AP, Patel O, Cameron G, Pellicci DG, Day EB, Sullivan LC, Kyparissoudis K, Kjer-Nielsen L, Vivian JP, Cao B, Brooks AG, Williams SJ, Illarionov P, Besra GS, Turner SJ, Porcelli SA, McCluskey J, Smyth MJ, Rossjohn J, Godfrey DI: A semi-invariant Vα10+ T cell antigen receptor defines a population of natural killer T cells with distinct glycolipid antigen-recognition properties. Nat Immunol 12: 616–623, 2011 [DOI] [PMC free article] [PubMed] [Google Scholar]
- 46.Mattner J, Debord KL, Ismail N, Goff RD, Cantu C, 3rd, Zhou D, Saint-Mezard P, Wang V, Gao Y, Yin N, Hoebe K, Schneewind O, Walker D, Beutler B, Teyton L, Savage PB, Bendelac A: Exogenous and endogenous glycolipid antigens activate NKT cells during microbial infections. Nature 434: 525–529, 2005 [DOI] [PubMed] [Google Scholar]
- 47.Kinjo Y, Illarionov P, Vela JL, Pei B, Girardi E, Li X, Li Y, Imamura M, Kaneko Y, Okawara A, Miyazaki Y, Gómez-Velasco A, Rogers P, Dahesh S, Uchiyama S, Khurana A, Kawahara K, Yesilkaya H, Andrew PW, Wong CH, Kawakami K, Nizet V, Besra GS, Tsuji M, Zajonc DM, Kronenberg M: Invariant natural killer T cells recognize glycolipids from pathogenic Gram-positive bacteria. Nat Immunol 12: 966–974, 2011 [DOI] [PMC free article] [PubMed] [Google Scholar]
- 48.Kinjo Y, Tupin E, Wu D, Fujio M, Garcia-Navarro R, Benhnia MR, Zajonc DM, Ben-Menachem G, Ainge GD, Painter GF, Khurana A, Hoebe K, Behar SM, Beutler B, Wilson IA, Tsuji M, Sellati TJ, Wong CH, Kronenberg M: Natural killer T cells recognize diacylglycerol antigens from pathogenic bacteria. Nat Immunol 7: 978–986, 2006 [DOI] [PubMed] [Google Scholar]
- 49.Kinjo Y, Wu D, Kim G, Xing GW, Poles MA, Ho DD, Tsuji M, Kawahara K, Wong CH, Kronenberg M: Recognition of bacterial glycosphingolipids by natural killer T cells. Nature 434: 520–525, 2005 [DOI] [PubMed] [Google Scholar]
- 50.Brennan PJ, Tatituri RV, Brigl M, Kim EY, Tuli A, Sanderson JP, Gadola SD, Hsu FF, Besra GS, Brenner MB: Invariant natural killer T cells recognize lipid self antigen induced by microbial danger signals. Nat Immunol 12: 1202–1211, 2011 [DOI] [PMC free article] [PubMed] [Google Scholar]
- 51.McNab FW, Berzins SP, Pellicci DG, Kyparissoudis K, Field K, Smyth MJ, Godfrey DI: The influence of CD1d in postselection NKT cell maturation and homeostasis. J Immunol 175: 3762–3768, 2005 [DOI] [PubMed] [Google Scholar]
- 52.Matsuda JL, Gapin L, Sidobre S, Kieper WC, Tan JT, Ceredig R, Surh CD, Kronenberg M: Homeostasis of V alpha 14i NKT cells. Nat Immunol 3: 966–974, 2002 [DOI] [PubMed] [Google Scholar]
- 53.Tupin E, Kronenberg M: Activation of natural killer T cells by glycolipids. Methods Enzymol 417: 185–201, 2006 [DOI] [PubMed] [Google Scholar]
- 54.Huang S, Apasov S, Koshiba M, Sitkovsky M: Role of A2a extracellular adenosine receptor-mediated signaling in adenosine-mediated inhibition of T-cell activation and expansion. Blood 90: 1600–1610, 1997 [PubMed] [Google Scholar]
Associated Data
This section collects any data citations, data availability statements, or supplementary materials included in this article.


