

Abstract
Intracerebral hemorrhage (ICH) remains a major medical problem and currently has no effective treatment. Hemorrhaged blood is highly toxic to the brain, and catabolism of the pro-oxidant heme, mainly released from hemoglobin, is critical for the resolution of hematoma after ICH. The degradation of the pro-oxidant heme is controlled by heme oxygenase (HO). We have previously reported a neuroprotective role for HO2 in early brain injury after ICH; however, in vivo data that specifically address the role of HO2 in brain edema and neuroinflammation after ICH are absent. Here, we tested the hypothesis that HO2 deletion would exacerbate ICH-induced brain edema, neuroinflammation, and oxidative damage. We subjected wild-type (WT) and HO2 knockout (−/−) mice to the collagenase-induced ICH model. Interestingly, HO2−/− mice had enhanced brain swelling and neuronal death, although HO2 deletion did not increase collagenase-induced bleeding; the exacerbation of brain injury in HO2−/− mice was also associated with increases in neutrophil infiltration, microglial/macrophage and astrocyte activation, DNA damage, peroxynitrite production, and cytochrome c immunoreactivity. In addition, we found that hemispheric enlargement was more sensitive than brain water content in the detection of subtle changes in brain edema formation in this model. Combined, these novel findings extend our previous observations and demonstrate that HO2 deficiency increases brain swelling, neuroinflammation, and oxidative damage. The results provide additional evidence that HO2 plays a critical protective role against ICH-induced early brain injury.
Keywords: astrocytes, blood, brain edema, hemispheric enlargement, reactive oxygen species, stroke
Intracerebral hemorrhage (ICH) occurs when a diseased blood vessel within the brain bursts, allowing blood to leak inside the brain. ICH accounts for 15–20% of all strokes and is much more likely than cerebral infarction to result in death or major disability (Xi et al., 2006; Wang and Doré, 2007b); the reason may be attributable to the intra-tissue presence of extravasated blood and blood-derived materials. Hemorrhaged blood is highly toxic to the brain tissue, most likely because free heme (iron protoporphyrin IX), liberated mainly from lysed red blood cells, is a pro-oxidant and a potent inducer of inflammation (Wagener et al., 2001, 2003; Wang and Doré, 2007a). Moreover, extracellular free heme cannot be recycled and therefore must be eliminated from the brain tissue to maintain normal brain functions (Smith, 2002). Consequently, heme catabolism within the brain is critical for hematoma resolution after ICH.
The degradation of heme is controlled by heme oxygenase (HO) enzymes, which produce carbon monoxide, ferrous iron, and biliverdin; the latter is rapidly converted to bilirubin. Two active HO isoenzymes exist: HO1 and HO2. HO1 is mostly induced in microglia/macrophages after ICH, whereas HO2 is constitutively expressed in neurons and accounts for the vast majority of HO activity in the brain (Doré, 2002; Chang et al., 2003; Wang et al., 2006; Wang and Doré, 2007b). The fact that HO1 and HO2 show such different patterns of cellular expression suggests that they have distinct functions in ICH. Recently, we have reported a previously unrecognized detrimental role of HO1 and protective role of HO2 in early brain injury after ICH (Wang et al., 2006; Wang and Doré, 2007b); however, in vivo data that specifically address the role of HO2 in brain edema and neuroinflammation after ICH are absent. In the present study, we hypothesized that HO2 deletion would exacerbate ICH-induced brain edema, neuroinflammation, and oxidative damage. To test this hypothesis, we subjected wild-type (WT) and HO2 knockout (−/−) mice to a preclinical ICH model that causes vascular disruption and leads to entry of blood into the striatum. We then compared the outcomes in terms of brain water content, hemispheric enlargement, and number of degenerating neurons, inflammatory responses, and reactive oxygen species (ROS) production.
EXPERIMENTAL PROCEDURES
Animals
This study was conducted in accordance with the National Institutes of Health guidelines for the use of experimental animals. Experimental protocols were approved by The Johns Hopkins University Animal Care and Use Committee. Adequate measures were taken to minimize the number of mice used and to ensure minimal pain or discomfort in mice. HO2−/− mice and WT littermates were descendents of those generated by Drs. Poss and Tonegawa (Poss and Tonegawa, 1997) and have been back-crossed with C57BL/6 mice; they are maintained in our facilities. Genotyping of the mice was assayed by polymerase chain reaction and was additionally confirmed by Western blot analysis. Investigators were blinded to the genotype for all experiments.
ICH model
The mouse model of ICH, which is induced by collagenase injection, was adapted from an established rat protocol (Rosenberg et al., 1990) and has been described previously (Clark et al., 1998; Wang et al., 2003). Age- and weight-matched adult male WT and HO2−/−mice (24–32 g) were anesthetized by i.p. injection with Avertin (2-2-2 tribromoethanol; Sigma, St. Louis, MO, USA; 0.5 mg/g body weight). To induce hemorrhage, mice were injected unilaterally in the striatum with collagenase VII-S (0.1 U in 500 nl saline, Sigma) at the following stereotactic coordinates: 0.8 mm anterior and 2.2 mm lateral of the bregma, 3.0 mm in depth. Collagenase was delivered over 5 min, and the needle was left in place for an additional 20 min to prevent any reflux. Mice in the sham group were subjected to sterile saline injection only. Rectal temperature was maintained at 37.0±0.5 °C throughout the experimental and recovery periods; animals regained consciousness within 10 min. This procedure resulted in reproducible lesions that were mostly restricted to the striatum (Fig. 1A). Because the focus of our study was the early brain injury in ICH, mice were killed for analysis 5, 24, or 72 h later. None of the mice died during the study before the endpoints of the experiment.
Fig. 1.

Deletion of HO2 increases brain swelling, but not water content, in mice subjected to ICH. Age- and weight-matched WT and HO2−/− mice were subjected to ICH, and brains were sectioned and stained with Luxol Fast Blue/Cresyl Violet. (A) Representative sections from WT and HO2−/− mice 72 h after collagenase injection showing different areas of injury as represented by lack of staining. The white boxes indicate the approximate positions of the four locations used to count and average the number of cells that were labeled with FJB, MPO, IbaI, GFAP, 8-OHG, nitrotyrosine, cytochrome c, and HO1. Scale bar=100 μm. (B) HO2 deletion has no effect on collagenase-induced bleeding. Total hemoglobin levels were measured in lysates from the injected caudate putamen of mice. A standard curve was made from lysates of control (uninjected) mice. Hemoglobin levels in WT and HO2−/− mice were not significantly different at 5 or 24 h after induction of ICH (n=8/group, both P>0.05). (C) HO2 deletion has no effect on brain water content. Seventy-two hours after induction of ICH, brain water content in the ipsilateral basal ganglia (Ipsi-BG) of WT and HO2−/− mice was significantly higher than that of the contralateral basal ganglia (Cont-BG). However, no differences in brain water content were observed between WT and HO2−/− mice in the Cont-BG, Ipsi-BG, contralateral cortex (Cont-CX), ipsilateral cortex (Ipsi-CX), or cerebellum (Cerebel; n=6/group, all P>0.05). ** P<0.01 compared with contralateral side. (D) HO2 deletion increases brain swelling. Hemispheric enlargement, determined by quantitative image analysis, was significantly greater in HO2−/−mice than in WT mice (n=6/group, **P<0.01). Values are means±S.D.
Spectrophotometric assay for hemoglobin
The hemoglobin content of brains subjected to collagenase-induced ICH was quantified with Drabkin’s reagent (Sigma), as described previously (Wang et al., 2003; MacLellan and Colbourne, 2005). Briefly, WT and HO2−/− mice (n=6/group) were overdosed with 2.5% Avertin 5 or 24 h after ICH and transcardially perfused with 60 ml of normal saline. The tissue on the ipsilateral and contralateral sides was then trimmed to contain only the striatum region and was treated individually as follows. Each sample was homogenized for 5 min in 250 μl of distilled water and then centrifuged at 13,000×g for 30 min. Drabkin’s reagent (80 μl) was added to a 20-μl aliquot of supernatant (which contains the hemoglobin) and allowed to stand for 15 min at room temperature. The concentration of cyanomethemoglobin produced was measured at 540 nm. A standard curve, reflecting the amount of hemoglobin present, was generated by adding incremental volumes of blood (0, 0.5, 1.0, 2.0, 4.0, and 8.0 μl), obtained by cardiac puncture of anesthetized control mice, to 100 μl lysate from the tissue of normal striatum. Results from at least four samples per mouse were averaged.
Brain water content
Brain edema was assessed by measuring brain water content as described previously (Wang and Tsirka, 2005b) with minor modifications. Briefly, WT and HO2−/− mice (n=6/group) were killed by decapitation 72 h after collagenase injection. The brains were removed immediately and divided into five parts: ipsilateral and contralateral basal ganglia, ipsilateral and contralateral cortex, and cerebellum (which served as an internal control). Brain samples were weighed immediately on an analytical balance (Denver Instrument Co., Denver, CO, USA) to obtain the wet weight and then dried at 100 °C for 48 h to obtain the dry weight. Brain edema was expressed as (wet weight–dry weight)/wet weight of brain tissue×100.
Hemispheric enlargement
Brain edema was further measured by percentage of hemispheric enlargement at 72 h post-ICH. WT and HO2−/− mice (n=6/group) were killed, and their brains were harvested and rapidly frozen at −80 °C. Frozen brain sections taken at 500 μm intervals by cryostat were stained with Luxol Fast Blue/Cresyl Violet according to a published protocol (Geisler et al., 2002). The areas of ipsilateral hemisphere and contralateral hemisphere were analyzed with advanced SPOT image software (Diagnostic Instruments Inc., Sterling Heights, MI, USA). The volumes of ipsilateral and contralateral hemispheres were calculated by multiplying each area by the distance between sections. Hemisphere enlargement (%) was expressed as [(ipsilateral hemisphere volume – contralateral hemisphere volume)/contralateral hemisphere volume]×100 (Kondo et al., 1997; Manley et al., 2000).
Histology
WT and HO2−/− mice (n=6/group) were killed, and their brains were harvested, fixed in 4% paraformaldehyde for 24 h, and cryoprotected in serial phosphate-buffered sucrose solutions (20, 30, and 40%) at 4 °C. Then the brains were cut into 30-μm sections with a cryostat.
Fluoro-Jade B (FJB), which selectively labels degenerating neurons (Schmued and Hopkins, 2000; Wang et al., 2003; Xue et al., 2006; Wasserman and Schlichter, 2007b), was used to quantify dying neurons in prepared fresh frozen sections. To perform the quantification analysis of FJB-positive cells, three sections per mouse with similar brain injury size were chosen from six WT and six HO2−/− mice, and positively stained cells over a microscopic field of 40× were counted randomly in four comparable fields adjacent to the hematoma. The numbers of FJB-positive cells from 12 locations per animal (four fields per section×three sections per animal) were averaged and expressed as positive cells/field, as previously reported (Wang et al., 2003, 2007). Stained sections were examined with a fluorescence microscope; the images were captured and analyzed by advanced SPOT image software. Areas with large blood vessels were avoided.
Immunofluorescence
Immunofluorescence was carried out as described previously (Wang and Tsirka, 2005b; Wang and Doré, 2007a). Briefly, free-floating sections were washed in PBS for 20 min, blocked in 5% normal goat serum, and incubated overnight at 4 °C with primary antibodies: rabbit anti-myeloperoxidase (MPO, neutrophil marker; 1:100; DAKO, Glostrup, Denmark); rabbit anti-Iba 1 (microglia marker; 1:1000; Wako Chemicals, Richmond, VA, USA); rabbit anti–glial fibrillary acidic protein (GFAP, astrocyte marker; 1:1000; DakoCytomation, Copenhagen, Denmark); mouse anti-8-hydroxyguanosine (8-OHG; 10 μg/ml, Oxis International Inc., Portland, OR, USA); mouse anti-nitrotyrosine (peroxynitrite (ONOO−) marker; 1:1000; Upstate, Lake Placid, NY, USA); mouse anti–cytochrome c (1:1000; BD Pharmingen, San Diego, CA, USA); and mouse anti-HO1 (1:1000; Stressgen, Victoria, BC, Canada). To assess the cellular source and location of HO1 in HO2−/− mice after ICH, double immunofluorescence labeling was performed by simultaneous incubation of anti-HO1 with either anti-Iba1 or anti-GFAP. Sections were then incubated with Alexa 488- (1:1000; Molecular Probes) and/or Cy3- (1:1000; Jackson ImmunoResearch, West Grove, PA, USA) conjugated secondary antibody. To quantify the number of immunoreactive cells labeled with MPO, Iba1, GFAP, 8-OHG, nitrotyrosine, cytochrome c, or HO1, the same strategy was used with FJB staining as detailed above. The numbers of immunoreactive cells over a microscopic field of 40× (for MPO, GFAP, 8-OHG, nitrotyrosine, and cytochrome c) or 60× (for Iba1 and HO1) from 12 locations per mouse were averaged and expressed as positive cells/field. Stained sections were examined with a fluorescence microscope. Control sections were processed by the same method, except that primary antibodies were omitted.
Statistics
All data are expressed as means±S.D. The statistical comparisons among multiple groups were made using two-way ANOVA followed by Bonferroni correction. Differences between two groups were determined by two-tailed Student’s t-test. Statistical significance was set at P<0.05.
RESULTS
HO2 deletion has no effect on collagenase-induced bleeding
Typical histological findings in WT and HO2−/− mice 72 h after collagenase injection are shown in Fig. 1A. We have shown previously that HO2 is neuroprotective against collagenase-induced ICH (Wang et al., 2006). To ascertain whether the larger brain injury volumes and greater neurologic deficits observed in HO2−/− mice resulted from a difference between WT and HO2−/− mice in the original collagenase-induced bleeding, we measured the initial levels of hemoglobin in the injured tissue as an indicator of the bleeding volume. No significant difference between WT and HO2−/− mice was observed 5 or 24 h after ICH (n=8/group, both P>0.05, Fig. 1B), indicating that enhanced early brain injury and neurologic deficits can be attributed mostly to the absence of HO2. Consistent with our published results and reports of others (Del Bigio et al., 1996; Tang et al., 2004; Wang and Doré, 2007a), there was no significant difference in the hemoglobin level at the 5 and 24 h time points after ICH in WT and HO2−/− mice (n=8/group, both P>0.05, Fig. 1B), indicating that maximum bleeding occurs less than 5 h after collagenase injection in WT and HO2−/− mice. No detectable bleeding was observed in sham-operated WT or HO2−/− mice (data not shown).
Brain swelling is increased in HO2−/− mice
Considering the potential contribution of brain edema in ICH-induced early brain injury (Wang and Tsirka, 2005b; Xi et al., 2006; Wasserman and Schlichter, 2007a), we first determined whether the increase in early brain injury in HO2−/− mice correlated with increased brain edema. In WT and HO2−/− mice, brain water content in the ipsilateral basal ganglia 72 h after collagenase injection was significantly higher than that in the contralateral basal ganglia (n=6/group, both P<0.01), but there was no difference between WT and HO2−/− mice in brain water content of the basal ganglia, cortex, or cerebellum (Fig. 1C, n=6/group, all P>0.05).
We next measured the percentage of hemispheric enlargement to evaluate brain swelling, which is most reflective of overall edema and is believed to be responsible for much of the brain damage and death that results from severe stroke. The hemispheric enlargement was quantified by digitizing serial brain sections and calculating the cumulative area. We found that hemispheric enlargement was significantly greater in HO2−/− mice (13.2±3.3%) than in WT mice (7.6±2.5%; Fig. 1D, n=6/group, P=0.009).
Neuronal death is increased in HO2−/− mice
To examine whether neuronal death was increased in the peri-ICH region of HO2−/− mice, we used FJB histological staining, a specific marker for degenerating neurons (Schmued and Hopkins, 2000; Wang et al., 2003). The results showed that in brain sections with similarly sized injuries, HO2−/− mice had more degenerating neurons in the peri-ICH region than did WT mice at 72 h after ICH (Fig. 2A), a finding confirmed by cell count analysis (Fig. 2B, 27.3±7.5 vs. 12.9±3.6 cells/field, n=6/group, P=0.0001). FJB-positive neurons were not observed in the contralateral side or normal brain, but were occasionally observed along the needle track in sham-operated WT and HO2−/− mice (data not shown).
Fig. 2.
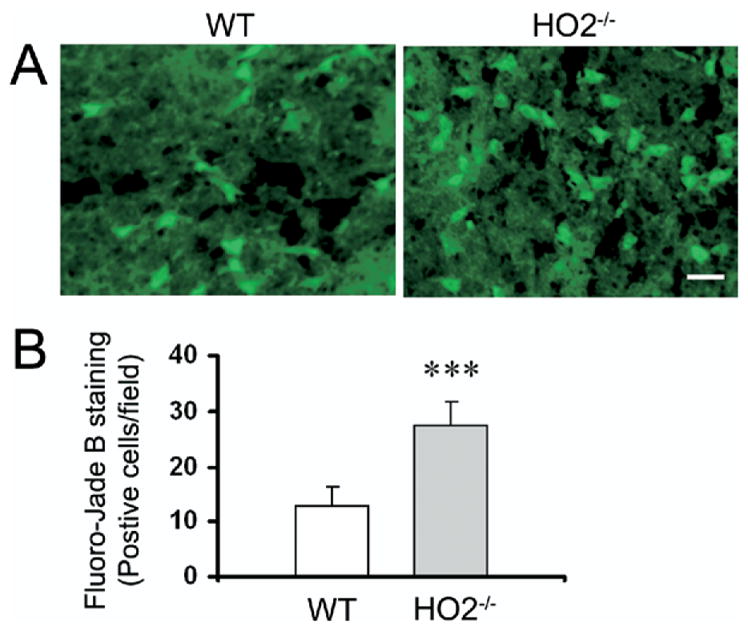
Deletion of HO2 increases the number of degenerating neurons in mice subjected to ICH. (A) FJB histological staining of degenerating neurons in sections collected 72 h after collagenase injection shows intensely labeled neurons and processes in the peri-ICH region in WT and HO2−/− mice. Scale bar=20 μm. (B) Three sections per mouse with similar brain injury size were chosen from six WT and six HO2−/− mice. Positive cells were counted randomly from 12 locations per animal (four fields per section×three sections per animal) and the numbers were averaged and expressed as positive cells/field. Cell count analysis demonstrated that HO2−/− mice had more degenerating neurons than WT control mice (n=6/group, *** P=0.0001). Values are means±S.D.
Neuroinflammation is exacerbated in HO2−/− mice
As indicated by immunoreactive MPO, ICH produces a robust infiltration of neutrophils into the affected striatum that can be observed as early as 4 h after ICH (Wang and Tsirka, 2005b). Although infiltrating neutrophils were evident in and around the injury site in WT and HO2−/− mice 72 h post-ICH (Fig. 3A), HO2−/− mice had significantly more neutrophils in the affected striatum than did WT mice (Fig. 3D, 43.2±5.4 vs. 32.1±7.8 cells/field, n=6/group, P=0.019). This exaggerated infiltration of neutrophils was unlikely due to increased size of hematoma in HO2−/− mice because brain sections with similar hematoma size were chosen from WT and HO2−/− mice.
Fig. 3.

Deletion of HO2 increases neuroinflammation in mice subjected to ICH. (A) Infiltrating neutrophils (MPO-positive cells), (B) activated microglia/macrophages (Iba1-immunoreactive cells), and (C) reactive astrocytes (GFAP-positive cells) were apparent in or around the injury site in WT and HO2−/− mice 72 h post-ICH. (D) Three sections per mouse with similar brain injury size were chosen from six WT and six HO2−/− mice. Positive cells were counted randomly from 12 locations per animal (four fields per section×three sections per animal) and the numbers were averaged and expressed as positive cells/field. Cell count analysis indicated that HO2−/− mice had significantly more infiltrating neutrophils, activated microglia/macrophages and astrocytes than did WT mice at 72 h post-ICH (all n=6/group, * P<0.05, ** P<0.01). Scale bar=30 μm (A–C); IR, immunoreactive. Values are means±S.D.
Microglia/macrophage activation occurs within 1 h after ICH (Wang and Doré, 2007a), much earlier than neutrophil infiltration, and it contributes to ICH-induced early brain injury (Aronowski and Hall, 2005; Wang and Tsirka, 2005a; Wang and Doré, 2007b). To clarify the effect of HO2 deletion on the state of microglia/macrophage activation after ICH, immunofluorescence staining of Iba1, a marker for microglia/macrophages, was used (Ito et al., 2001). After ICH, activated microglia/macrophages were characterized as cells with a spherical, amoeboid, or rod-like appearance, and a cell body usually more than 10 μm in diameter, with short, thick processes and intense immunoreactivity; resting microglia were characterized by small cell bodies, long processes, and weak immunoreactivity. By using a combination of morphological criteria and a cell body diameter cutoff of 10 μm, microglia/macrophages were classified as either resting or activated (Rogove et al., 2002; Wang and Doré, 2007a). The results showed that resting microglia were sparse but distributed similarly in WT and HO2−/− mice on the uninjected side 72 h after ICH (Fig. 3B). Cell count analysis confirmed that in brain sections with similarly sized injuries, more activated microglia/macrophages were present around the injury site in HO2−/− mice than in WT mice (Fig. 3D, 12.1±2.0 vs. 8.5±1.4 cells/field, n=6/group, P=0.005).
Astrocytes react to many CNS challenges/insults, and reactive astrocytes are a hallmark of various neuropathologic conditions (Anderson et al., 2003; Miller, 2005). To examine the effect of HO2 deletion on astrocytic reaction after ICH, immunofluorescence labeling of GFAP was conducted. Reactive astrocytes exhibit striking increases in GFAP immunoreactivity and in the number, length, and thickness of GFAP-positive processes. Resting (nonreactive) astrocytes with small cell bodies, fine terminal processes, and weak immunoreactivity appeared to be distributed similarly in WT and HO2−/− mice on the uninjected side 72 h after ICH (Fig. 3C); increased GFAP immunoreactivity was observed around the injury site in WT and HO2−/− mice. Cell count analysis showed that HO2−/− mice had more reactive astrocytes than did WT mice around the border region of injury at 72 h post-ICH (Fig. 3D, 14.2±2.3 vs. 9.8±1.6 cells/field, n=6/group, P=0.004).
DNA damage, ONOO− production, and cytochrome c immunoreactivity is exacerbated in HO2−/− mice
To examine the effect of HO2 deletion on DNA damage after ICH, we used immunofluorescence staining of 8-OHG, a commonly used biomarker for oxidative DNA damage caused by superoxide anion. We previously reported that nearly all of the 8-OHG immunoreactive cells were neurons 24 h after ICH (Wang et al., 2007). Here, we detected 8-OHG immunoreactive cells around the injury site 24 h post-ICH in WT and HO2−/− mice (Fig. 4A). 8-OHG-immunoreactive cells were observed very rarely in the contralateral side or in normal brain or sham-operated WT and HO2−/− mice (data not shown). Cell count analysis showed that HO2−/− mice had more 8-OHG-immunoreactive cells than did WT mice around the border region of injury at 24 h post-ICH (Fig. 4D, 28.6±7.6 vs. 13.8±4.5 cells/field, n=6/group, P=0.003).
Fig. 4.

Deletion of HO2 increases oxidative damage in mice subjected to ICH. (A) 8-OHG, a marker for DNA oxidation, (B) nitrotyrosine, a marker for ONOO−, and (C) cytochrome c release, a marker for apoptosis, were used to investigate oxidative damage. Increased immunoreactivity of 8-OHG, nitrotyrosine, and cytochrome c was detected around the injury site 24 h post-ICH in tissue sections from WT and HO2−/− mice. Scale bar=20 μm for A, B; 30 μm for C. (D) Three sections per mouse with similar brain injury size were chosen from six WT and six HO2−/− mice. Positive cells were counted randomly from 12 locations per animal (four fields per section×three sections per animal) and the numbers were averaged and expressed as positive cells/field. Cell count analysis showed that HO2−/− mice had significantly more cells immunoreactive for 8-OHG, nitrotyrosine, and cytochrome c than did WT mice (all n=6/group, * P<0.05, ** P<0.01). Values are the means±S.D.
ONOO− is one of the ROS produced by the interaction of nitric oxide (NO) and superoxide. ONOO−, acting as an oxidant, is more stable than NO or superoxide and can readily diffuse across phospholipid membranes (Marla et al., 1997). To examine the effect of HO2 deletion on ONOO− production, immunofluorescence labeling of nitrotyrosine, a biomarker for ONOO−, was used. We previously reported that at 24 h after ICH, nearly all of the nitrotyrosine-immunoreactive cells were neurons (Wang et al., 2007). Here, intensely stained nitrotyrosine-positive cells were detected around the injury site 24 h post-ICH in WT and HO2−/− mice (Fig. 4B). We did not detect intensely stained nitrotyrosine-immunoreactive cells on the contralateral side or in normal brain or sham-operated WT and HO2−/− mice (data not shown). Cell count analysis showed that HO2−/− mice had significantly more nitrotyrosine-immunoreactive cells than did WT mice around the border region of injury (Fig. 4C, 43.2±5.4 vs. 32.1±7.1 cells/field, n=6/group, P=0.02).
Release of mitochondrial cytochrome c has been linked to apoptotic cell death (Garrido et al., 2006), a significant contributor to ICH-induced brain damage (Matsushita et al., 2000; Qureshi et al., 2003; Wang et al., 2003). To examine the effect of HO2 deletion on cytochrome c immunoreactivity after ICH, immunofluorescence labeling of cytochrome c was conducted. We previously reported that at 24 h after ICH, most cytochrome c-immunoreactive cells were neurons (Wang et al., 2007). Here, intensely stained cytochrome c-positive cells were not detected in the control hemisphere or in sham-operated WT and HO2−/− mice (data not shown). In contrast, we did detect enhanced cytochrome c immunoreactivity in the cells around the border region of injury 24 h post-ICH in WT and HO2−/− mice (Fig. 4C). Cell count analysis showed that HO2−/− mice had more of these cytochrome c-positive cells than did WT mice (Fig. 4D, 26.2±6.7 vs. 12.9±2.9 cells/field, n=6/group, P=0.003).
HO2 deletion does not affect HO1 expression
HO1 and HO2 catalyze the same rate-limiting biochemical reaction to degrade free heme. Because we found previously that HO1 may play a detrimental role in ICH-induced early brain injury (Wang and Doré, 2007a), we examined here whether HO2 deletion affects HO1 expression in the HO2−/− mice. Immunofluorescence labeling of HO1 showed that HO1 immunoreactivity was strongly upregulated in microglia/macrophage-like cells around the border region of injury in WT and HO2−/− mice 72 h post-ICH (Fig. 5A). However, cell count analysis revealed no apparent differences in numbers of HO1 immunoreactive cells between WT and HO2−/− mice (Fig. 5D, 8.3±1.7 vs. 8.7±1.8 cells/field, n=6/group, P=0.748).
Fig. 5.

Deletion of HO2 has no effect on HO1 expression in mice subjected to ICH. (A) Increased HO1 immunoreactivity was detected in microglia/macrophage-like cells in areas adjacent to the site of hematoma 72 h post-ICH in WT and HO2−/− mice. (B) Double labeling of HO1 and Iba1 in HO2−/− mice indicated that almost all HO1-immu-nopositive cells were microglia/macrophages. (C) Double labeling of HO1 and GFAP in HO2−/− mice indicated that HO1-immunopositive cells were not astrocytes. Scale bar=20 μm for A, B; 50 μm for C. (D) Three sections per mouse with similar brain injury size were chosen from six WT and six HO2−/− mice. Positive cells were counted randomly from 12 locations per animal (four fields per section×three sections per animal) and the numbers were averaged and expressed as positive cells/field. Cell count analysis showed no difference in numbers of HO1-immunoreactive cells between WT and HO2−/− mice (n=6/group, P=0.748). Values are means±S.D.
To define the cellular sources of HO1 expression in HO2−/− mice after ICH, we double-stained serial sections obtained at 72 h post-ICH for HO1 and cell-specific antigens. We detected co-localization of HO1 and Iba1 in HO2−/− mice (Fig. 5B), similar to our previous observations in WT mice (Wang and Doré, 2007a). Interestingly, no co-localization of HO1 and GFAP was detected in HO2−/− mice (Fig. 5C).
DISCUSSION
In our previous work, we demonstrated that HO2−/− mice develop significantly larger brain injury volume and greater neurologic deficit than their WT counterparts; HO2 deletion makes primary neurons more vulnerable to hemin (oxidized heme)-induced toxicity (Wang et al., 2006). Here, we found that brain swelling and neuronal death were increased in HO2−/− mice and that these were associated with a marked increase in ICH-induced neuroinflammation (neutrophil infiltration, microglial/macrophage and astrocyte activation) and oxidative damage (DNA damage, ONOO− production, and cytochrome c immunoreactivity). To exclude the possibility that the greater hemorrhagic damage in HO2−/− mice could be attributed to more bleeding, initial levels of hemoglobin in the injured tissue were measured, but no significant difference between WT and HO2−/− mice was detected. Brain water content, commonly used to measure brain edema, was increased significantly in the ipsilateral basal ganglia after ICH, but no difference between WT and HO2−/− mice was observed. Interestingly, brain swelling, measured as a percentage of hemispheric enlargement, was significantly greater in HO2−/− mice than in WT mice. In addition, we found that HO1 was highly induced in the microglia/macrophages of WT and HO2−/− mice but that its induction was not affected by HO2 deletion. Overall, these novel findings strongly suggest that HO2 provides endogenous protection and that absence of HO2 could enhance the cascade of events that lead to ICH-induced early brain injury.
ICH is associated with enhanced neuroinflammation and oxidative damage (Xi et al., 2006; Wang and Doré, 2007b; Wasserman and Schlichter, 2007b), most likely because of the accumulation of free heme within the brain. Free heme is a potent pro-oxidant and also a strong inducer of inflammation (Wagener et al., 2001, 2003; Wang and Doré, 2007a). It is mainly released from red blood cells that leak during hemorrhage or through the damaged blood–brain barrier. It is also released from other cellular components of brain tissue, including injured and dying neurons, glia, and endothelial cells. A large accumulation of free heme following hemorrhage could result in increased vasopermeability, oxidative damage, and tissue infiltration of leukocytes (Wagener et al., 2001). Because extracellular free heme cannot be recycled, heme catabolism is critical for the resolution of hematoma after ICH to maintain normal brain function.
Although HO1 and HO2 catalyze the same biochemical reaction, they play distinct roles in collagenase-induced ICH; it appears that HO1 might be detrimental while the HO2 has a beneficial role (Wang et al., 2006; Wang and Doré, 2007b). The distinct biological functions of HO1 and HO2 are likely attributable to their different patterns of cellular expression after hemorrhage. We have shown that HO1 is induced in microglia/macrophages after ICH, whereas HO2 is constitutively expressed in neurons throughout the brain (Wang and Doré, 2007b). The endogenous protective role of HO2 in collagenase-induced ICH is also consistent with previous observations in preclinical models of ischemic stroke and traumatic brain injury (Doré et al., 1999, 2000; Chang et al., 2003).
To further understand the protective role of HO2 in collagenase-induced ICH, we examined HO1 expression in HO2−/− mice to exclude the possible involvement of HO1, as HO1 induction contributes to ICH-induced early brain injury (Wang and Doré, 2007a). Interestingly, we found that HO1 was highly induced in microglia/macrophages, but not in astrocytes and that there was no difference between WT and HO2−/− mice at 72 h post-ICH. Other in vitro and in vivo studies also have shown that HO2 deletion does not alter cellular expression of HO1 (Chang et al., 2003; Rogers et al., 2003). These findings establish the fact that the greater brain damage observed in HO2−/− mice is not related to general incapacity; enhanced HO1 expression may be necessary for optimal function of the ICH-activated microglia/macrophages, but not astrocytes. Our results tend to differ from those published by Qu et al. (2007), who observed attenuation of oxidative injury in HO2−/− mice after whole blood infusion. The differences may reside in the ICH model used (collagenase model vs. blood infusion model) and the use of anticoagulant heparin in the blood injected.
The present data demonstrate that HO2−/− mice have enhanced neutrophil infiltration, microglia/macrophage and astrocyte activation, DNA damage, ONOO− production, and cytochrome c release. Following early brain injury, infiltrating leukocytes, activated microglia/macrophages, and reactive astrocytes could damage brain tissues by increasing vascular permeability, releasing proinflammatory proteases, and generating ROS (Weiss, 1989; Facchinetti et al., 1998; Eder, 2005; Wang and Tsirka, 2005a; Tejima et al., 2007). ROS can trigger cytochrome c release, which is often followed by DNA damage and cell death (Matz et al., 2001). When cytochrome c is released from the mitochondria into the cytosol as a result of increased mitochondrial permeability, it activates the initiator caspase-9, which then cleaves and activates caspase-3, finally leading to apoptotic cell death (Garrido et al., 2006); therefore, cytochrome c immunoreactivity can be used as a means of predicting apoptosis (Garrido et al., 2006). In this study, we observed more cytochrome c immunoreactivity in HO2−/− mice than in WT mice 24 h post-ICH. Consistent with this result, we also observed more degenerating neurons in HO2−/− mice than in WT mice at 72 h, using FJB staining as a marker for neuronal death.
Associated with the increased neuroinflammation and oxidative damage, we observed increased brain swelling in HO2−/− mice. Brain swelling caused by edema could result in herniation after ICH. Usually, brain swelling after ICH is examined by measuring percentage water content. Although we did observe a significant increase in brain water content in the ipsilateral basal ganglia 72 h after collagenase injection in WT and HO2−/− mice, no difference was observed between the two genotypes. We next investigated brain swelling, which represents the overall brain edema formation (Kondo et al., 1997; Manley et al., 2000). Interestingly, we found that brain swelling, determined by quantitative image analysis of hemispheric enlargement, was significantly greater in HO2−/− mice than that in WT mice, suggesting that hemispheric enlargement is likely to be more sensitive than brain water content for the detection of subtle changes in brain edema formation, at least in our collagenase-induced mouse model.
CONCLUSION
In conclusion, our study demonstrated that HO2 deletion does not affect collagenase-induced bleeding. HO2−/− mice had enhanced brain swelling and neuronal death, but the exacerbation of brain injury appeared to be associated with increases in neutrophil infiltration, microglial/macrophage and astrocyte activation, DNA damage, ONOO− production, and cytochrome c immunoreactivity. Furthermore, our data indicate that hemispheric enlargement is a more sensitive measure than brain water content for quantification of brain edema formation in the collagenase ICH model. Taken together, these novel findings have extended our previous observations and demonstrated that HO2 deficiency increases brain swelling, neuroinflammation and oxidative damage, providing further support that HO2 represents an important endogenous neuroprotective system in the brain and, thus, plays a critical protective role against ICH-induced early brain injury.
Acknowledgments
This work was supported by an AHA-SDG 0630223N (J.W.), and NIH grants AG022971, NS046400 (S.D.). We thank Claire Levine for assistance with this manuscript.
Abbreviations
- Avertin
2-2-2 tribromoethanol
- FJB
Fluoro-Jade B
- GFAP
glial fibrillary acidic protein
- HO
heme oxygenase
- ICH
intracerebral hemorrhage
- MPO
myeloperoxidase
- NO
nitric oxide
- ONOO−
peroxynitrite
- ROS
reactive oxygen species
- WT
wild type
- 8-OHG
8-hydroxyguanosine
- −/−
knockout
References
- Anderson MF, Blomstrand F, Blomstrand C, Eriksson PS, Nilsson M. Astrocytes and stroke: networking for survival? Neurochem Res. 2003;28:293–305. doi: 10.1023/a:1022385402197. [DOI] [PubMed] [Google Scholar]
- Aronowski J, Hall CE. New horizons for primary intracerebral hemorrhage treatment: experience from preclinical studies. Neurol Res. 2005;27:268–279. doi: 10.1179/016164105X25225. [DOI] [PubMed] [Google Scholar]
- Chang EF, Wong RJ, Vreman HJ, Igarashi T, Galo E, Sharp FR, Stevenson DK, Noble-Haeusslein LJ. Heme oxygenase-2 protects against lipid peroxidation-mediated cell loss and impaired motor recovery after traumatic brain injury. J Neurosci. 2003;23:3689–3696. doi: 10.1523/JNEUROSCI.23-09-03689.2003. [DOI] [PMC free article] [PubMed] [Google Scholar]
- Clark W, Gunion-Rinker L, Lessov N, Hazel K. Citicoline treatment for experimental intracerebral hemorrhage in mice. Stroke. 1998;29:2136–2140. doi: 10.1161/01.str.29.10.2136. [DOI] [PubMed] [Google Scholar]
- Del Bigio MR, Yan HJ, Buist R, Peeling J. Experimental intracerebral hemorrhage in rats. Magnetic resonance imaging and histopathological correlates. Stroke. 1996;27:2312–2319. doi: 10.1161/01.str.27.12.2312. discussion 2319–2320. [DOI] [PubMed] [Google Scholar]
- Doré S. Decreased activity of the antioxidant heme oxygenase enzyme: implications in ischemia and in Alzheimer’s disease. Free Radic Biol Med. 2002;32:1276–1282. doi: 10.1016/s0891-5849(02)00805-5. [DOI] [PubMed] [Google Scholar]
- Doré S, Goto S, Sampei K, Blackshaw S, Hester LD, Ingi T, Sawa A, Traystman RJ, Koehler RC, Snyder SH. Heme oxygenase-2 acts to prevent neuronal death in brain cultures and following transient cerebral ischemia. Neuroscience. 2000;99:587–592. doi: 10.1016/s0306-4522(00)00216-5. [DOI] [PubMed] [Google Scholar]
- Doré S, Sampei K, Goto S, Alkayed NJ, Guastella D, Blackshaw S, Gallagher M, Traystman RJ, Hurn PD, Koehler RC, Snyder SH. Heme oxygenase-2 is neuroprotective in cerebral ischemia. Mol Med. 1999;5:656–663. [PMC free article] [PubMed] [Google Scholar]
- Eder C. Regulation of microglial behavior by ion channel activity. J Neurosci Res. 2005;81:314–321. doi: 10.1002/jnr.20476. [DOI] [PubMed] [Google Scholar]
- Facchinetti F, Dawson VL, Dawson TM. Free radicals as mediators of neuronal injury. Cell Mol Neurobiol. 1998;18:667–682. doi: 10.1023/A:1020685903186. [DOI] [PMC free article] [PubMed] [Google Scholar]
- Garrido C, Galluzzi L, Brunet M, Puig PE, Didelot C, Kroemer G. Mechanisms of cytochrome c release from mitochondria. Cell Death Differ. 2006;13:1423–1433. doi: 10.1038/sj.cdd.4401950. [DOI] [PubMed] [Google Scholar]
- Geisler S, Heilmann H, Veh RW. An optimized method for simultaneous demonstration of neurons and myelinated fiber tracts for delineation of individual trunco- and palliothalamic nuclei in the mammalian brain. Histochem Cell Biol. 2002;117:69–79. doi: 10.1007/s00418-001-0357-z. [DOI] [PubMed] [Google Scholar]
- Ito D, Tanaka K, Suzuki S, Dembo T, Fukuuchi Y. Enhanced expression of Iba1, ionized calcium-binding adapter molecule 1, after transient focal cerebral ischemia in rat brain. Stroke. 2001;32:1208–1215. doi: 10.1161/01.str.32.5.1208. [DOI] [PubMed] [Google Scholar]
- Kondo T, Reaume AG, Huang TT, Carlson E, Murakami K, Chen SF, Hoffman EK, Scott RW, Epstein CJ, Chan PH. Reduction of CuZn-superoxide dismutase activity exacerbates neuronal cell injury and edema formation after transient focal cerebral ischemia. J Neurosci. 1997;17:4180–4189. doi: 10.1523/JNEUROSCI.17-11-04180.1997. [DOI] [PMC free article] [PubMed] [Google Scholar]
- MacLellan CL, Colbourne F. Mild to moderate hyperthermia does not worsen outcome after severe intracerebral hemorrhage in rats. J Cereb Blood Flow Metab. 2005;25:1020–1029. doi: 10.1038/sj.jcbfm.9600099. [DOI] [PubMed] [Google Scholar]
- Manley GT, Fujimura M, Ma T, Noshita N, Filiz F, Bollen AW, Chan P, Verkman AS. Aquaporin-4 deletion in mice reduces brain edema after acute water intoxication and ischemic stroke. Nat Med. 2000;6:159–163. doi: 10.1038/72256. [DOI] [PubMed] [Google Scholar]
- Marla SS, Lee J, Groves JT. Peroxynitrite rapidly permeates phospholipid membranes. Proc Natl Acad Sci U S A. 1997;94:14243–14248. doi: 10.1073/pnas.94.26.14243. [DOI] [PMC free article] [PubMed] [Google Scholar]
- Matsushita K, Meng W, Wang X, Asahi M, Asahi K, Moskowitz MA, Lo EH. Evidence for apoptosis after intercerebral hemorrhage in rat striatum. J Cereb Blood Flow Metab. 2000;20:396–404. doi: 10.1097/00004647-200002000-00022. [DOI] [PubMed] [Google Scholar]
- Matz PG, Fujimura M, Lewen A, Morita-Fujimura Y, Chan PH. Increased cytochrome c-mediated DNA fragmentation and cell death in manganese-superoxide dismutase-deficient mice after exposure to subarachnoid hemolysate. Stroke. 2001;32:506–515. doi: 10.1161/01.str.32.2.506. [DOI] [PubMed] [Google Scholar]
- Miller G. Neuroscience. The dark side of glia. Science. 2005;308:778–781. doi: 10.1126/science.308.5723.778. [DOI] [PubMed] [Google Scholar]
- Poss KD, Tonegawa S. Heme oxygenase 1 is required for mammalian iron reutilization. Proc Natl Acad Sci U S A. 1997;94:10919–10924. doi: 10.1073/pnas.94.20.10919. [DOI] [PMC free article] [PubMed] [Google Scholar]
- Qu Y, Chen-Roetling J, Benvenisti-Zarom L, Regan RF. Attenuation of oxidative injury after induction of experimental intracerebral hemorrhage in heme oxygenase-2 knockout mice. J Neuro-surg. 2007;106:428–435. doi: 10.3171/jns.2007.106.3.428. [DOI] [PubMed] [Google Scholar]
- Qureshi AI, Suri MF, Ostrow PT, Kim SH, Ali Z, Shatla AA, Guterman LR, Hopkins LN. Apoptosis as a form of cell death in intracerebral hemorrhage. Neurosurgery. 2003;52:1041–1047. discussion 1047–1048. [PubMed] [Google Scholar]
- Rogers B, Yakopson V, Teng ZP, Guo Y, Regan RF. Heme oxygenase-2 knockout neurons are less vulnerable to hemoglobin toxicity. Free Radic Biol Med. 2003;35:872–881. doi: 10.1016/s0891-5849(03)00431-3. [DOI] [PubMed] [Google Scholar]
- Rogove AD, Lu W, Tsirka SE. Microglial activation and recruitment, but not proliferation, suffice to mediate neurodegeneration. Cell Death Differ. 2002;9:801–806. doi: 10.1038/sj.cdd.4401041. [DOI] [PubMed] [Google Scholar]
- Rosenberg GA, Mun-Bryce S, Wesley M, Kornfeld M. Collagenase-induced intracerebral hemorrhage in rats. Stroke. 1990;21:801–807. doi: 10.1161/01.str.21.5.801. [DOI] [PubMed] [Google Scholar]
- Schmued LC, Hopkins KJ. Fluoro-Jade B: a high affinity fluorescent marker for the localization of neuronal degeneration. Brain Res. 2000;874:123–130. doi: 10.1016/s0006-8993(00)02513-0. [DOI] [PubMed] [Google Scholar]
- Smith A. Homeostasis of heme in health and disease: current aspects of the structural biology of heme-protein interactions and of gene regulation. DNA Cell Biol. 2002;21:245–249. doi: 10.1089/104454902753759663. [DOI] [PubMed] [Google Scholar]
- Tang J, Liu J, Zhou C, Alexander JS, Nanda A, Granger DN, Zhang JH. MMP-9 deficiency enhances collagenase-induced intracerebral hemorrhage and brain injury in mutant mice. J Cereb Blood Flow Metab. 2004;24:1133–1145. doi: 10.1097/01.WCB.0000135593.05952.DE. [DOI] [PubMed] [Google Scholar]
- Tejima E, Zhao BQ, Tsuji K, Rosell A, van Leyen K, Gonzalez RG, Montaner J, Wang X, Lo EH. Astrocytic induction of matrix metalloproteinase-9 and edema in brain hemorrhage. J Cereb Blood Flow Metab. 2007;27:460–468. doi: 10.1038/sj.jcbfm.9600354. [DOI] [PubMed] [Google Scholar]
- Wagener FADTG, Eggert A, Boerman OC, Oyen WJG, Verhofstad A, Abraham NG, Adema G, van Kooyk Y, de Witte T, Figdor CG. Heme is a potent inducer of inflammation in mice and is counteracted by heme oxygenase. Blood. 2001;98:1802–1811. doi: 10.1182/blood.v98.6.1802. [DOI] [PubMed] [Google Scholar]
- Wang J, Doré S. Heme oxygenase-1 exacerbates early brain injury after intracerebral haemorrhage. Brain. 2007a;130:1643–1652. doi: 10.1093/brain/awm095. [DOI] [PMC free article] [PubMed] [Google Scholar]
- Wang J, Doré S. Inflammation after intracerebral hemorrhage. J Cereb Blood Flow Metab. 2007b;27:894–908. doi: 10.1038/sj.jcbfm.9600403. [DOI] [PubMed] [Google Scholar]
- Wang J, Fields J, Zhao C, Langer J, Thimmulappa RK, Kensler TW, Yamamoto M, Biswal S, Doré S. Role of Nrf2 in protection against intracerebral hemorrhage injury in mice. Free Radic Biol Med. 2007;43:408–414. doi: 10.1016/j.freeradbiomed.2007.04.020. [DOI] [PMC free article] [PubMed] [Google Scholar]
- Wang J, Rogove AD, Tsirka AE, Tsirka SE. Protective role of tuftsin fragment 1–3 in an animal model of intracerebral hemorrhage. Ann Neurol. 2003;54:655–664. doi: 10.1002/ana.10750. [DOI] [PubMed] [Google Scholar]
- Wang J, Tsirka SE. Contribution of extracellular proteolysis and microglia to intracerebral hemorrhage. Neurocrit Care. 2005a;3:77–85. doi: 10.1385/NCC:3:1:077. [DOI] [PubMed] [Google Scholar]
- Wang J, Tsirka SE. Neuroprotection by inhibition of matrix metalloproteinases in a mouse model of intracerebral haemorrhage. Brain. 2005b;128:1622–1633. doi: 10.1093/brain/awh489. [DOI] [PubMed] [Google Scholar]
- Wang J, Zhuang H, Doré S. Heme oxygenase 2 is neuroprotective against intracerebral hemorrhage. Neurobiol Dis. 2006;22:473–476. doi: 10.1016/j.nbd.2005.12.009. [DOI] [PubMed] [Google Scholar]
- Wasserman JK, Schlichter LC. Minocycline protects the blood-brain barrier and reduces edema following intracerebral hemorrhage in the rat. Exp Neurol. 2007a;207:227–237. doi: 10.1016/j.expneurol.2007.06.025. [DOI] [PubMed] [Google Scholar]
- Wasserman JK, Schlichter LC. Neuron death and inflammation in a rat model of intracerebral hemorrhage: effects of delayed minocycline treatment. Brain Res. 2007b;1136:208–218. doi: 10.1016/j.brainres.2006.12.035. [DOI] [PubMed] [Google Scholar]
- Weiss SJ. Tissue destruction by neutrophils. N Engl J Med. 1989;320:365–376. doi: 10.1056/NEJM198902093200606. [DOI] [PubMed] [Google Scholar]
- Xi G, Keep RF, Hoff JT. Mechanisms of brain injury after intracerebral haemorrhage. Lancet Neurol. 2006;5:53–63. doi: 10.1016/S1474-4422(05)70283-0. [DOI] [PubMed] [Google Scholar]
- Xue M, Hollenberg MD, Yong VW. Combination of thrombin and matrix metalloproteinase-9 exacerbates neurotoxicity in cell culture and intracerebral hemorrhage in mice. J Neurosci. 2006;26:10281–10291. doi: 10.1523/JNEUROSCI.2806-06.2006. [DOI] [PMC free article] [PubMed] [Google Scholar]