ABSTRACT
Background:
Insulin resistance is common in septic patients. The level at which the serum glucose should be maintained using insulin infusions for optimal utilization by skeletal muscles is not yet established.
Objective:
The objective of the present study was to compare glucose transporter 4 (GLUT4) mRNA and GLUT4 expression and glucose utilization at the recommended glucose levels of 6–8 mmol/L (110-140 mg/dL) and 8–10 mmol/L (140–180 mg/dL) in septic rats.
Subjects and Methods:
This was a prospective randomized study using 44 Sprague-Dawley rats (260– 330 g). Rats were anaesthetized with gaseous diethyl ether. Catheters were implanted into the jugular vein and artery. Following a laparotomy, rats in the experimental group (n = 36) were rendered septic by standard caecal ligation and puncture (CLP) and intraperitoneal lipopolysaccharide (LPS) infusion (O111:[B4], 1 mg/kg). Control animals (n = 8) underwent laparotomy, but no caecal ligation or puncture and no LPS injection. Four experimental groups were studied: sham-operated control, sepsis treated with fluid maintenance only, sepsis treated with fluid and insulin infusion controlling blood glucose concentration at 6–8 mmol/L and sepsis treated with fluid and insulin infusion controlling blood glucose concentration at 8–10 mmol/L. Hyperinsulinaemic-euglycaemic clamp experiment was done before fluid maintenance and insulin treatment to calculate average glucose infusion rate.
Results:
All septic rats were markedly hyperglycaemic compared with sham-operated controls two hours after operation. Glucose infusion rate during hyperinsulinaemic-euglycaemic clamp experiment was slower in septic rats, suggesting that they were insulin resistant. At the 12th and 24th hour, skeletal muscle was taken to observe pathological change and analyse the GLUT4 mRNA and GLUT4 levels. There were more inflammatory cells, less GLUT4 mRNA and GLUT4 expression in the skeletal muscles of septic rats. Insulin increased the expression of GLUT4 mRNA and GLUT4 in the skeletal muscle of septic rats. Among all septic rats, the expression of GLUT4 mRNA and GLUT4 was more in the 8–10 mmol/L group.
Conclusion:
Blood glucose concentration of 8–10 mmol/L results in more glucose utilization than 6–8 mmol/L in the skeletal muscle of septic rats during insulin therapy.
Keywords: Animals, glucose transporter 4 (GLUT4), insulin resistance, sepsis, skeletal muscle
RESUMEN
Antecedentes:
La resistencia a la insulina es común en pacientes sépticos. Todavía no se ha determinado el nivel al que la glucosa sérica debe mantenerse mediante infusiones de insulina para su utilización óptima por los músculos esqueléticos.
Objetivo:
El objetivo del presente estudio fue comparar el transportador de glucosa 4 (GLUT4) mRNA y la utilización de la glucosa y la expresión de GLUT4 en los niveles recomendados de glucosa de 6–8 mmol/L (110-140 mg/dL) y 8–10 mmol/L (140–180 mg/dL) en ratas sépticas.
Sujetos y método:
Se trató de un estudio prospectivo aleatorio con 44 ratas Sprague-Dawley (260–330 g). Las ratas fueron anestesiadas con éter dietílico gaseoso. Se les implantaron catéteres en la vena yugular y la arteria. Luego de una laparotomía, las ratas en el grupo experimental (n = 36) fueron reducidas a condición séptica mediante el método estándar de ligadura y punción cecal e infusión intraperitoneal de lipopolisacárido (LPS) (O111: [B4], 1 mg/kg). A los animales de control (n = 8) se les practicó la laparotomía, pero no se les hizo ligadura cecal o punción, ni se les administró inyección de LPS. Se estudiaron cuatro grupos experimentales: control de simulación, sepsis tratada con mantenimiento de fluidos solamente, sepsis tratada con infusión de fluídos e infusión de insulina para el control de la concentración de glucosa sanguínea en 6 – 8 mmol/L, sepsis tratada con infusión de fluídos e infusión de insulina para el control de la concentración de glucosa sanguínea en 8–10 mmol/L. Se realizó un experimento de pinzamiento euglucémico hiperinsulinémico antes del mantenimiento del fluido y el tratamiento con insulina a fin de calcular la velocidad media de infusión de glucosa (VIG).
Resultados:
Todas las ratas sépticas fueron ostensiblemente hiperglicémicas en comparación con los controles de simulación dos horas después de la operación. La velocidad de infusión de glucosa durante el experimento de pinzamiento euglucémico hiperinsulinémico fue más lenta en ratas sépticas, sugiriendo que eran resistentes a la insulina. A las 12 y a las 24 horas, el músculo esquelético fue llevado para observar los cambios patológicos, y para analizar los niveles de GLUT4 mRNA y GLUT4. Había más células inflamatorias, y menos expresión de GLUT4 mRNA y GLUT4 en los músculos esqueléticos de las ratas sépticas. La insulina aumenta la expresión de mRNA de GLUT4 y GLUT4 en el músculo esquelético de ratas sépticas. Entre todas las ratas sépticas, la expresión de GLUT4 mRNA y GLUT4 fue mayor en el grupo de 8 – 10 mmol/L.
Conclusión:
La concentración de glucosa sanguínea de 8–10 mmol/L trae como resultado más utilización de glucosa que la de 6–8 mmol/L en el músculo esquelético de ratas sépticas durante la terapia con insulina.
INTRODUCTION
Although the concept of insulin resistance has been reported over a century ago, insulin resistance in human sepsis has been recognized fairly recently (1). Insulin resistance refers to an impairment in insulin action in target tissues, such as skeletal muscle, adipocytes and liver. In sepsis, it may develop within a few hours and last for a few weeks (2). Skeletal muscles metabolize approximately 80% of total body glucose (3); hence it is not surprising that loss of insulin sensitivity has its main effect in skeletal muscles (4). Utilization of glucose is enabled by glucose transporter 4 (GLUT4), a protein that is encoded by the GLUT4 gene. Glucose transporter 4 is expressed primarily in muscle and fat cells, the major tissues in the body that respond to insulin, and is responsible for insulin-regulated glucose transport. During sepsis, the transcription and translocation of GLUT4 is impaired, leading to impaired insulin mediated glucose uptake in skeletal muscles (3).
Hyperglycaemia is reported to be associated with increased morbidity and mortality for a variety of disorders and settings. Several published studies have provided strong evidence that lowering blood glucose levels improves outcomes (5). In order to counteract the effect of insulin resistance and the resulting hyperglycaemia in sepsis, intensive insulin therapy is commonly used in intensive care units. Intensive insulin therapy decreases glucose level by stimulating glucose uptake and increasing mRNAexpression of GLUT4 (6). However, it also increases the risk of hypoglycaemia and its complications (7). Hence controlling blood glucose to levels of more utilization by tissues is optimized while avoiding hyper or hypoglycaemia. However, the level at which blood glucose control should be maintained in septic patients to ensure optimal tissue glucose utilization is unclear. To avoid the risk of hyperglycaemia or hypoglycaemia, some have suggested a glucose level of 8–10 mmol/L (140–180 mg/dL), while others suggest 6–8 mmol/L [110–140 mg/dL] (8). Which of these blood glucose levels is optimal for utilization of glucose by the tissues during sepsis is unknown.
The objective of the present study was to compare GLUT4 mRNA and GLUT4 expression and glucose utilization in the skeletal muscle at glucose levels of 8–10 mmol/L (140–180 mg/dL) and 6–8 mmol/L (110–140 mg/dL) in septic rats.
SUBJECTS AND METHODS
Experimental design and tissue collection
A total of 44 male Sprague-Dawley rats (260–330 g) were quarantined in quiet, humidified, light-cycled rooms for one week before use. Standard caecal ligation and puncture-induced sepsis was undertaken according to the method described by Rittirsch et al (9). Specifically, rats were anaesthetized with gaseous diethyl ether following which catheters were implanted into the jugular vein and artery and affixed to the skin. A midline abdominal incision was then made; the caecum was mobilized, ligated and punctured once with a 16-gauge needle. The bowel was repositioned and abdomen was closed, following which 1 mg/kg lipopolysaccharide [LPS] (O111:[B4], Sigma-Aldrich, Shanghai, China) was injected into the abdominal cavity (n = 36). Sham-operated control animals underwent the similar surgical incision, but no caecal ligation or puncture and no LPS injection (n = 8). Each rat received normal saline infusion (2 ml) via the jugular venous catheters immediately after the operation.
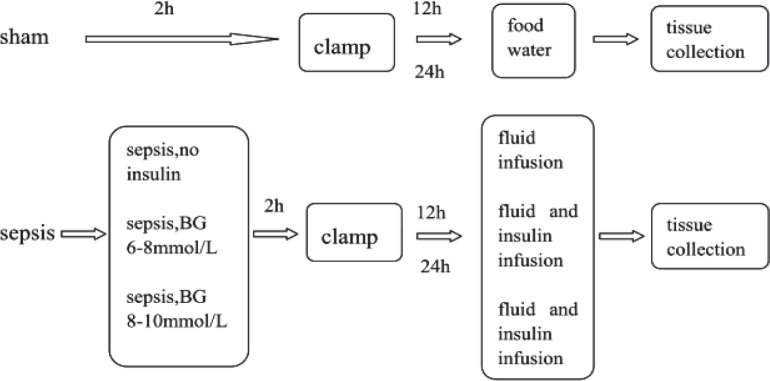
Hyperinsulinaemic-euglycaemic clamp studies were undertaken after the rats recovered from anaesthesia (usually about two hours), according to the method described by Kraegen et al (10). Septic rats were randomly divided into three groups. One group (n = 12) was given only fluid maintenance (glucose 15%, sodium chloride 3%, potassium chloride 1.5% at 1.7 ml/h) by microinfusion pumps (Terumo, Tokyo, Japan) after the clamp experiment. The other two groups (n = 12 for each) received both fluid maintenance at similar rates as above and insulin infusion to control blood glucose concentration at 6–8 mmol/L or 8–10 mmol/L. The sham-operated group was allowed open access to food and water after the clamp experiment. At the 12th and 24th hour, half the animals of each group were terminally anaesthetized with pentobarbital, following which the gastrocnemius muscle was removed (Fig. 1). Half of the muscle was immediately frozen with liquid nitrogen and half was put into 10% neutral formalin (Sinopharm, Shanghai, China). All were stored in the laboratory for further analysis.
Fig. 1. Schema of the interventions.
sham: sham-operated control; sepsis, no insulin: sepsis group with only fluid maintenance; sepsis, BG 6–8: sepsis group with insulin treatment controlling blood glucose concentration at 6–8 mmol/L; sepsis, BG 8–10: sepsis group with insulin treatment controlling blood glucose concentration at 8–10 mmol/L
Blood glucose concentration
Blood was obtained from all animals and tested by glucometer (Bayer, Mishawaka, USA) at indicated times. Before the clamp study (two hours after surgical procedure), blood glucose concentration was compared between septic and control group to determine whether hyperglycaemia was present in septic groups.
Glucose infusion rates
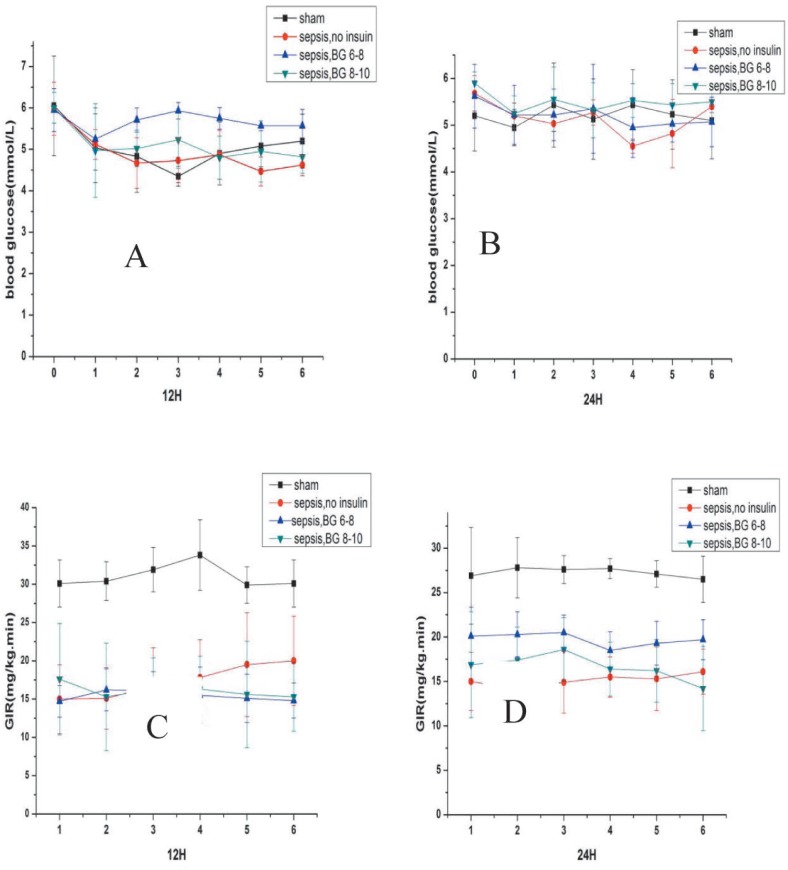
All hyperinsulinaemic-euglycaemic clamp studies were started after rats recovered from anaesthesia (about two hours after surgical procedure). To determine whether insulin resistance was present in septic rats, every rat in each group underwent the hyperinsulinaemic-euglycaemic clamp test. Insulin (Novo Nordisk, Tianjin, China) was infused continuously by microinfusion pumps (Terumo, Tokyo, Japan). The insulin dose was started at 10 mU/kg/minute. When blood glucose concentration was down to 5.0–6.0 mmol/L, the insulin infusion dose was decreased to 5 mU/kg/minute and a glucose infusion was started. Blood glucose concentrations were tested every 10 minutes and glucose infusion rate was modified to maintain basal blood glucose concentration (about 5.0 mmol/L) at the steady state. Insulin resistance was expressed by the average glucose infusion rate (GIR; mg/kg/min) for the last 60 minutes (Fig. 2).
Fig. 2. Blood glucose concentration and glucose infusion rate (GIR) for the last 60 minutes during hyperinsulinaemic-euglycaemic clamp.
Values are expressed as mean ± SD. Aand B show blood glucose concentration for the last 60 minutes during hyperinsulinaemic-euglycaemic clamp experiment. ‘0’ on the x-axis means the time when fasting blood glucose concentration was taken before the clamp experiment. 1–6 on the x-axis means the last 60 minutes. C and D show the GIR for the last 60 minutes during clamp experiment.
sham: sham-operated control; sepsis, no insulin: sepsis group with only fluid maintenance; sepsis, BG 6–8: sepsis group with insulin treatment controlling blood glucose concentration at 6–8 mmol/L; sepsis, BG 8–10: sepsis group with insulin treatment controlling blood glucose concentration at 8–10 mmol/L
Pathological change in skeletal muscle
The gastrocnemius muscle was removed from neutral formalin and paraffin sections were made. Pathological changes were observed by photon microscope after section haematoxylin and eosin (HE) staining in the pathology department of Children's Hospital of Fudan University, which is an accredited laboratory. The pathologist analysing the specimens was blinded to the experimental conditions.
Real-time polymerase chain reaction measurements
Frozen muscle (20–30 mg) was analysed by using one-step polymerase chain reaction (PCR) kit RNA-direct SYBR Green Realtime PCR Master Mix (Toyobo, Osaka, Japan). The primers sequences for GLUT4 were designed: 5′-CTGCCCGAAAGAGTCTAAAGC-3′ (forward) and 5′- TAAGAGCACCGAGACCAACG-3′ (reverse). The primers for glyceraldehyde 3-phosphate dehydrogenase (GAPDH) were designed: 5′-AGGTTGTCTCCTGCGACTTCA-3′ (forward) and 5′-GAGGTCCACCACTCTGTTGCT-3′ (reverse). Relative quantification of gene expression was calculated using the 2−ΔΔCt method (11).
Western blot analysis
Proteins were extracted from approximately 20 mg frozen wet muscle and quantified using the Lowry assay. Western blot was carried out following procedures described by Constantin et al (12). The GLUT4 antibody was anti-mouse IgG (Abcam, Hong Kong, China). Levels of protein expression were quantitated by densitometric scanning. Polymerase chain reaction and western blot procedures and analyses were done by technicians in the laboratory of the Institute of Pediatrics of Children's Hospital of Fudan University, Shanghai, China.
Statistical analysis
Statistical analyses were performed using SPSS 16.0 software. Numerical data are expressed as means ± SEM. Statistical assessment of the data was made by Student's t-test or one-way analysis of variance (ANOVA). Differences were considered statistically significant when p < 0.05.
RESULTS
Insulin resistance in septic rats
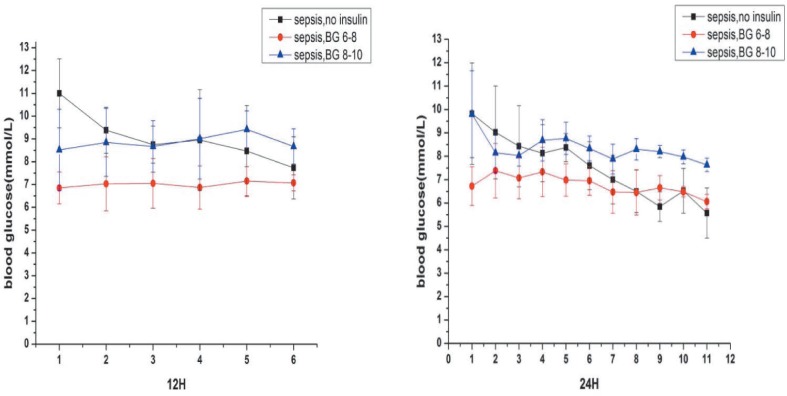
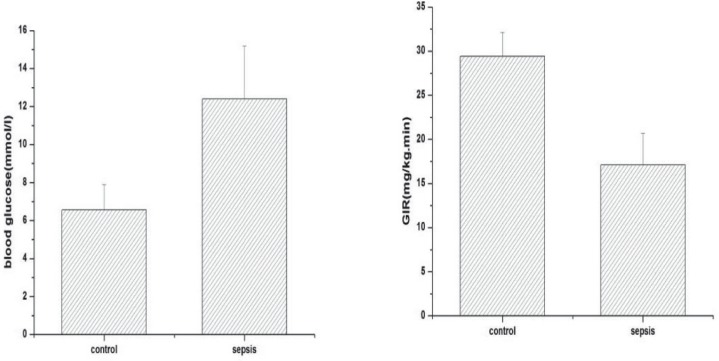
Body weight (292 ± 28.9 versus 293 ± 24.9 versus 287 ± 15.8 versus 286 ± 20.7; p > 0.05) and fasting blood glucose levels (5.6 ± 1.0 versus 5.8 ± 0.5 versus 5.8 ± 0.6 versus 6.0 ± 0.3; p > 0.05) were not significantly different among the four groups before surgery. Hyperglycaemia occurred after the operation. The blood glucose concentration of septic rats was much higher than sham-operated control two hours after surgery [12.4 ± 2.79 versus 6.57 ± 1.32; p < 0.05] (Fig. 3) and was associated with insulin resistance. The average glucose infusion rate in septic rats was lower than in the sham-operated control [17.1 ± 3.6 versus 29.4 ± 2.7; p < 0.001] (Fig. 4).
Fig. 3. Blood glucose concentration of septic groups. Values are expressed as mean ± SD.
sepsis, no insulin: sepsis group with only fluid maintenance; sepsis, BG 6–8: sepsis group with insulin treatment controlling blood glucose concentration at 6–8 mmol/L; sepsis, BG 8–10: sepsis group with insulin treatment controlling blood glucose concentration at 8–10 mmol/L
Fig. 4. Blood glucose concentration after surgery and glucose infusion rate between sham-operated control and septic rats.
Values are expressed as mean ± SD; *p < 0.05, ***p < 0.001
control: sham-operated control; sepsis: septic groups including sepsis with only fluid maintenance, sepsis with insulin treatment controlling blood glucose concentration at 6–8 mmol/L and sepsis with insulin treatment controlling blood glucose concentration at 8–10 mmol/L
Pathological changes in skeletal muscle
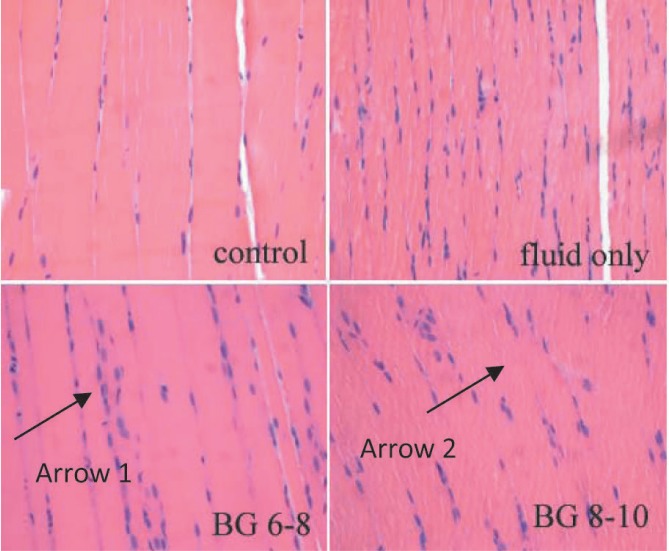
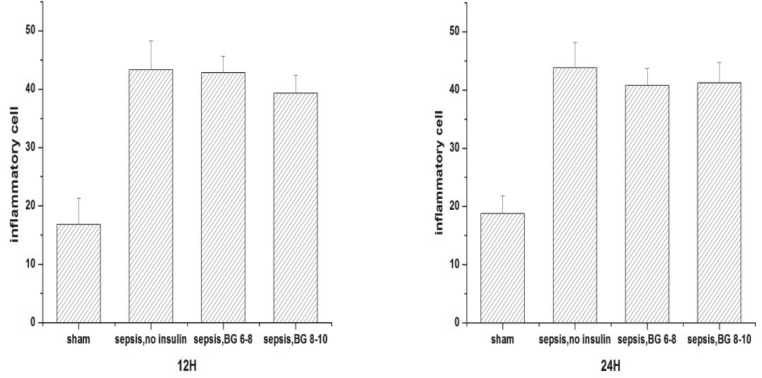
Pathological changes were observed by optical electron microscope after HE staining. Compared with sham-operated controls, inflammatory cell infiltration and myocytolysis were observed in the skeletal muscle of septic rats (Fig. 5). The number of inflammatory cells in the skeletal muscle of septic rats was more than in the sham-operated control at both the 12th and 24th hour (Fig. 6). Although insulin was said to decrease pro-inflammatory factors (such as tumour necrosis factor alpha (TNF-α) and interleukin (IL)-6) in septic models (13), the number of inflammatory cells in the skeletal muscles among the three septic groups was not significantly different. At the 12th hour, the number of inflammatory cells in the sepsis group treated with fluid maintenance only, sepsis group treated with fluid and insulin infusion controlling blood glucose concentration at 6–8 mmol/L and sepsis group treated with fluid and insulin infusion controlling blood glucose concentration at 8– 10 mmol/L were 43.3 ± 4.97, 42.8 ± 2.86, and 39.3 ± 3.08 (p > 0.05). At the 24th hour, they were 43.8 ± 4.31, 40.8 ± 2.86 and 41.2 ± 3.54 (p > 0.05).
Fig. 5. Pathological changes in the skeletal muscle of septic rats (HE staining, 10×40). Arrow 1 shows a lot of inflammatory cells infiltrated in the skeletal muscle of septic rat; arrow 2 shows part of the muscle fibre dissolved.
Fig. 6. The number of inflammatory cells in skeletal muscle.
Values are expressed as mean ± SD; ***p < 0.001
sham: sham-operated control; sepsis, no insulin: sepsis group with only fluid maintenance; sepsis, BG 6–8: sepsis group with insulin treatment controlling blood glucose concentration at 6–8 mmol/L; sepsis, BG 8–10: sepsis group with insulin treatment controlling blood glucose concentration at 8–10 mmol/L
Muscle GLUT4 mRNA expression
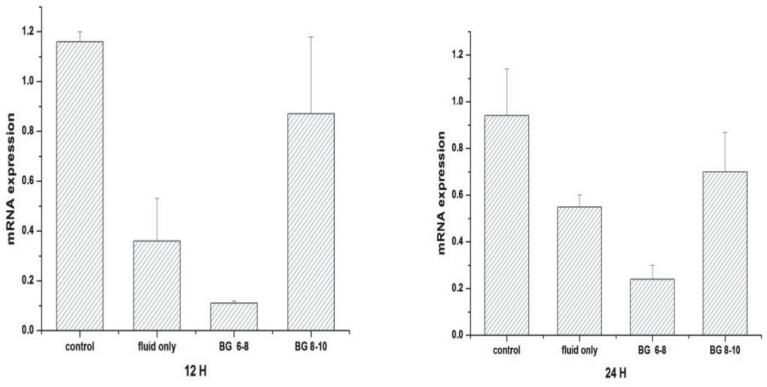
Figure 7 shows GLUT4 mRNA expression in the gastrocnemius muscle of the various groups. At the 12th hour, mRNA expression in the septic rats treated with fluid maintenance only was less than the sham-operated controls (0.36 ± 0.17 versus 1.16 ± 0.04; p < 0.05). With insulin treatment, the mRNA expression in the group receiving glucose concentration at 8– 10 mmol/L (0.87 ± 0.31) was increased, but in the group with glucose concentration at 6–8 mmol/L (0.11 ± 0.01), it was the lowest. At the 24th hour, mRNA expression were similarly ordered, from the highest to the lowest as follows: sham-operated control, sepsis group treated with fluid and insulin infusion controlling blood glucose concentration at 8–10 mmol/L, sepsis group treated with fluid maintenance only and sepsis group treated with fluid and insulin infusion controlling blood glucose concentration at 6–8 mmol/L (0.94 ± 0.20 versus 0.70 ± 0.17 versus 0.55 ± 0.05 versus 0.24 ± 0.06, respectively; p < 0.05).
Fig. 7. Glucose transporter 4 (GLUT4) mRNA expression in skeletal muscle.
Values are expressed as mean ± SD; *p < 0.05
control: sham-operated control; fluid only: sepsis group with only fluid maintenance; BG 6–8: sepsis group with insulin treatment controlling blood glucose concentration at 6–8 mmol/L; BG 8–10: sepsis group with insulin treatment controlling blood glucose concentration at 8–10 mmol/L
Muscle GLUT4 protein expression
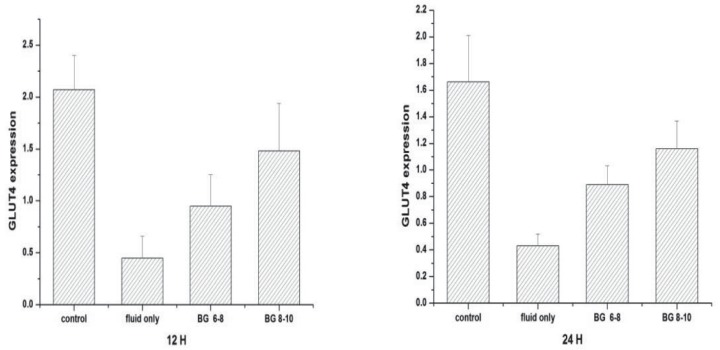
There was a significant reduction in GLUT4 protein expression in septic rats treated with fluid maintenance only compared with sham-operated control (0.45 ± 0.21 versus 2.07 ± 0.33; p < 0.05) at the 12th hour (Fig. 8). Under insulin treatment, GLUT4 protein expression was increased. Glucose transporter 4 protein expression in the glucose concentration at 8–10 mmol/L group was significantly higher than in the glucose concentration at 6–8 mmol/L group (1.48 ± 0.46 versus 0.95 ± 0.30; p < 0.05). At the 24th hour, protein expression followed the same order, from the highest to the lowest as follows: sham-operated control, sepsis group treated with fluid and insulin infusion controlling blood glucose concentration at 8–10 mmol/L, sepsis group treated with fluid and insulin infusion controlling blood glucose concentration at 6–8 mmol/L and sepsis group treated with fluid maintenance only [1.66 ± 0.35 versus 1.16 ± 0.21 versus 0.89 ± 0.14 versus 0.43 ± 0.09, respectively; p < 0.05] (Fig. 8).
Fig. 8. Glucose transporter 4 (GLUT4) expression in skeletal muscle.
Values are expressed as mean ± SD; *p < 0.05, **p < 0.01
control: sham-operated control; fluid only: sepsis group with only fluid maintenance; BG 6–8: sepsis group with insulin treatment controlling blood glucose concentration at 6–8 mmol/L; BG 8–10: sepsis group with insulin treatment controlling blood glucose concentration at 8–10 mmol/L
DISCUSSION
Previous studies have demonstrated the effects of bacterial lipopolysaccharide on glucose metabolism, including the presence of hyperglycaemia and insulin resistance in both humans and animals (1). Hyperglycaemia is reported to be associated with increased morbidity and mortality for a variety of disorders and settings, including sepsis. Several published studies have provided strong evidence that lowering blood glucose levels improves outcomes (5, 14). Insulin is a commonly used drug for hyperglycaemia. It also down-regulates pro-inflammatory cytokines and reactive oxygen species through inhibition of NF-κB. Intensive insulin treatment decreases pro-inflammatory factors (such as TNF-α, IL-6) and increases anti-inflammatory cytokines (IL-4, IL-10) in septic models (5, 13). In order to counteract the effect of insulin resistance and the resulting hyperglycaemia in sepsis, intensive insulin therapy is commonly used in intensive care units. However, intensive insulin therapy was reported to increase the risk of hypoglycaemia and its complications (7). To avoid the risk of hyperglycaemia or hypoglycaemia, some have suggested a glucose level of 8–10 mmol/L (140–180 mg/dL), while others suggest 6–8 mmol/L [110–140 mg/dL] (8). However, it is not known which of these levels ensures optimal utilization of glucose by skeletal muscles. We therefore undertook this study to compare GLUT4 mRNA and GLUT4 expression and glucose utilization at the glucose levels of 6–8 mmol/L (110– 140mg/dL) and 8–10 mmol/L (140–180mg/dL) in septic rats.
Glucose transporter 4 is a transport protein which acts as a transporter of glucose across the cell surface in muscle and fat cells. Glucose transporter 4 expression in the skeletal muscle relates directly to the effect of LPS, which is a major component of the outer membrane of bacteria. When LPS is introduced into the circulation, it causes metabolic endotoxaemia, which can induce an immune response leading to inflammation. Endotoxaemia causes an increase in the expression of TNF-α and IL-6 (15, 16), which are responsible for the down-regulation of GLUT4 transcription and inhibitory PI3-K/Akt pathway [phosphoinositide-3-kinase/serine threonine kinase] (17, 18). Inhibition of PI3-K/Akt pathway signalling suppresses the translocation of GLUT4 from an intracellular component to the plasma membrane (19, 20). Both the inhibition of GLUT4 expression and suppression of translocation reduce glucose uptake and lead to insulin resistance in sepsis.
In the present study, we used a clinically relevant CLP model of sepsis, which causes peritonitis, leads to polymicrobial sepsis and possesses a number of the hallmarks of clinical sepsis (21). Our model was a severe sepsis model. Its natural survival time was about 30–40 hours. We chose 12 hours and 24 hours as the end point. In our study, blood glucose levels in septic rats were much higher than in sham-operated controls two hours after the operation. From the pathological change in skeletal muscle, we can see that inflammation was present in the skeletal muscle of septic animals. Compared with shamoperated control, there were more inflammatory cells in the skeletal muscle of septic rats which may indicate the expression of pro-inflammatory cytokines. Myocytolysis was also noticed in septic skeletal muscle. The mechanisms leading to sepsis-induced changes in skeletal muscle are linked to excessive localized elaboration of pro-inflammatory cytokines, marked increases in free-radical generation, and activation of proteolytic pathways (22, 23). Muscle protein degraded through the activation of ubiquitin-proteasome pathway after decrease in PI3-K activation (24). PI3-K pathway is also an insulin signal conduction pathway for GLUT4 translocation. The loss of functional muscle and abnormality of transcription and translocation of GLUT4 may both explain the occurrence of insulin resistance in skeletal muscle.
Glucose infusion rates of septic rats were lower than sham-operated control during hyperinsulinaemic-euglycaemic clamp experiment, indicating that septic rats were obviously insulin resistant. Glucose transporter 4 is a transporter of glucose across the cell surface in muscle and fat cells. The expression of pro-inflammatory factors caused by endotaxaemia and oxidative stress can down-regulate GLUT4 transcription (17, 18, 25). Inflammation caused disruption of normal insulin stimulated cellular distribution of insulin receptor substrate 1 (IRS-1) and PI3-kinase activation suppresses GLUT4 translocation (26). These two mechanisms are likely to lead to insulin resistance.
There are many metabolic disturbances during severe sepsis and septic shock, and one of the most striking is hyperglycaemia (27). Intensive insulin therapy became popular in the intensive care unit (ICU) after research reporting its effectiveness on glycaemic control (28, 29). However, a large randomized trial reported that intensive glycaemic control is not effective in reducing ICU mortality, but increased the risk of hypoglycaemia and its complications (7). To avoid hyperglycaemia or hypoglycaemia, some have suggested a glucose level of 8–10 mmol/L (140–180 mg/dL) and 6–8 mmol/L [110–140 mg/dL] (8). In our study, we examined the pathological changes and compared GLUT4 mRNA and GLUT4 expression under these two levels. Although insulin was said to decrease pro-inflammatory factors (such as TNF-α and IL-6) in septic models (13), we did not measure the amount of different inflammatory factors in each group. However, the numbers of inflammatory cells in the skeletal muscles of three septic groups were not significantly different. We found that insulin treatment maintaining glucose level of 6–8 mmol/L (110–140 mg/dL) and 8–10 mmol/L (140–180 mg/dL) can both increase the expression of GLUT4 in the skeletal muscle of septic rats. The expression of GLUT4 mRNA and GLUT4 was higher when blood glucose concentration was maintained at 8–10 mmol/L. In sepsis, TNF-α can suppress the transcription of GLUT4 gene and markedly destabilize the GLUT4 mRNA (19). Indeed, when exposed to TNF-α, the half-life of GLUT4 mRNA decreases from nine hours to 4.5 hours (25, 30). Although there is no significant difference in the number of inflammatory cells in the skeletal muscles, according to previous studies (13, 28, 29), it is possible that insulin decreases inflammation and TNF-α production, and results in reversing GLUT4 mRNA destabilization in sepsis.
In conclusion, blood glucose concentration of 8–10 mmol/L results in more glucose utilization than 6–8 mmol/L in the skeletal muscle of septic rats during insulin therapy. Whether controlling glucose levels at 8–10 mmol/L in humans results in similar increases in the expression of GLUT4 mRNA and GLUT4 and whether these increases result in better outcomes in patients in sepsis is undetermined. Our study provides compelling physiological rationale to explore these possibilities in patients with sepsis.
Limitations
We studied the impact of controlling glucose at two different levels on GLUT4 expression in the skeletal muscle of septic rats. However, the exact mechanism of utilization of glucose in these two groups and other changes in insulin signalling pathway is still unclear and awaits exploration. In addition, the pathological and metabolic changes in sepsis are complex and whether manipulating GLUT4 protein expression to increase glucose utilization is likely to be beneficial or leads to disturbances in other areas such as muscle mitochondrial function cannot be answered.
REFERENCES
- 1.Agwunobi AO, Reid C, Maycock P, Little RA, Carlson GL. Insulin resistance and substrate utilization in human endotoxemia. J Clin Endocrinol Metab. 2000;85:3770–3778. doi: 10.1210/jcem.85.10.6914. [DOI] [PubMed] [Google Scholar]
- 2.Carlson GL. Insulin resistance in sepsis. Br J Surg. 2003;90:259–260. doi: 10.1002/bjs.4081. [DOI] [PubMed] [Google Scholar]
- 3.Abdul-Ghani MA, DeFronzo RA. Pathogenesis of insulin resistance in skeletal muscle. J Biomed Biotechnol. 2010:476279–476279. doi: 10.1155/2010/476279. 2010. [DOI] [PMC free article] [PubMed] [Google Scholar]
- 4.Saeed M, Carlson GL, Little RA, Irving MH. Selective impairment of glucose storage in human sepsis. Br J Surg. 1999;86:813–821. doi: 10.1046/j.1365-2168.1999.01140.x. [DOI] [PubMed] [Google Scholar]
- 5.Falciglia M. Causes and consequences of hyperglycemia in critical illness. Curr Opin Clin Nutr Metab Care. 2007;10:498–503. doi: 10.1097/MCO.0b013e3281a3bf0a. [DOI] [PubMed] [Google Scholar]
- 6.Mesotten D, Swinnen JV, Vanderhoydonc F, Wouters PJ, Van den Berghe G. Contribution of circulating lipids to the improved outcome of critical illness by glycemic control with intensive insulin therapy. J Clin Endocrinol Metab. 2004;89:219–226. doi: 10.1210/jc.2003-030760. [DOI] [PubMed] [Google Scholar]
- 7.NICE-SUGAR Study Investigators. Finfer S, Chittock DR, Su SY, Blair D, Foster D, et al. Intensive versus conventional glucose control in critically ill patients. N Engl J Med. 2009;360:1283–1297. doi: 10.1056/NEJMoa0810625. [DOI] [PubMed] [Google Scholar]
- 8.Hirasawa H, Oda S, Nakamura M. Blood glucose control in patients with severe sepsis and septic shock. World J Gastroenterol. 2009;15:4132–4136. doi: 10.3748/wjg.15.4132. [DOI] [PMC free article] [PubMed] [Google Scholar]
- 9.Rittirsch D, Huber-Lang MS, Flierl MA. Immunodesign of experimental sepsis by cecal ligation and puncture. Nat Protoc. 2009;4:31–36. doi: 10.1038/nprot.2008.214. [DOI] [PMC free article] [PubMed] [Google Scholar]
- 10.Kraegen EW, James DE, Bennet SP. In vivo insulin sensitivity in the rat determined by euglycemia clamp. Am J Physiol. 1983;245:E1–E7. doi: 10.1152/ajpendo.1983.245.1.E1. [DOI] [PubMed] [Google Scholar]
- 11.Livak KJ, Schmittgen TD. Analysis of relative gene expression data using real-time quantitative PCR and the 2 (-Delta Delta C (T)) method. Methods. 2001;25:402–408. doi: 10.1006/meth.2001.1262. [DOI] [PubMed] [Google Scholar]
- 12.Constantin D, Constantin-Teodosiu D, Layfield R, Tsintzas K, Bennett AJ, Greenhaff PL. PPARdelta agonism induces a change in fuel metabolism and activation of an atrophy programme, but does not impair mitochondrial function in rat skeletal muscle. J Physiol. 2007;583:381–390. doi: 10.1113/jphysiol.2007.135459. [DOI] [PMC free article] [PubMed] [Google Scholar]
- 13.Jeschke MG, Klein D, Bolder U, Einspanier R. Insulin attenuates the systemic inflammatory response in endotoxemic rats. Endocrinol. 2004;145:4084–4093. doi: 10.1210/en.2004-0592. [DOI] [PubMed] [Google Scholar]
- 14.Brierre S, Kumari R, Deboisblanc BP. The endocrine system during sepsis. Am J Med Sci. 2004;328:238–247. doi: 10.1097/00000441-200410000-00007. [DOI] [PubMed] [Google Scholar]
- 15.Cani PD, Bibiloni B, Knauf C, Waget A, Neyrinck AM, Delzenne NM, et al. Changes in gut microbiota control metabolic endotoxemia-induced inflammation in high-fat diet-induced obesity and diabetes in mice. Diabetes. 2008;57:1470–1481. doi: 10.2337/db07-1403. [DOI] [PubMed] [Google Scholar]
- 16.Dandona P, Ghanim H, Bandyopadhyay A. Insulin suppresses endotoxininduced oxidative, nitrosative, and inflammatory stress in humans. Diabetes Care. 2010;33:2416–2423. doi: 10.2337/dc10-0929. [DOI] [PMC free article] [PubMed] [Google Scholar]
- 17.Stephen JM, Bagby GJ, Pekala PH, Shepherd RE, Spitzer JJ, Lang CH. Differential regulation of glucose transporter gene expression in adipose tissue of septic rats. Biochem Biophys Res Commun. 1992;183:417–422. doi: 10.1016/0006-291x(92)90497-9. [DOI] [PubMed] [Google Scholar]
- 18.Qi C, Pekala PH. Tumor necrosis factor-α-induced insulin resistance in adipocytes. Pro Soc Exp Biol Med. 2000;223:128–135. doi: 10.1046/j.1525-1373.2000.22318.x. [DOI] [PubMed] [Google Scholar]
- 19.Matsuda N, Yamamoto S, Yokoo H, Tobe K, Hattori Y. Nuclear factorkappaB decoy oligodeoxynucleotides ameliorate impaired glucose tolerance and insulin resistance in mice with cecal ligation and puncture-induced sepsis. Crit Care Med. 2009;37:2791–2799. doi: 10.1097/CCM.0b013e3181ab844d. [DOI] [PubMed] [Google Scholar]
- 20.Chang L, Chiang SH, Saltiel AR. Insulin signaling and the regulation of glucose transport. Mol Med. 2004;10:65–71. doi: 10.2119/2005-00029.Saltiel. [DOI] [PMC free article] [PubMed] [Google Scholar]
- 21.Deitch EA. Animal models of sepsis and shock: a review and lessons learned. Shock. 1998;9:1–11. doi: 10.1097/00024382-199801000-00001. [DOI] [PubMed] [Google Scholar]
- 22.Callahan LA, Supinski GS. Sepsis-induced myopathy. Crit Care Med. 2009;37:S354–S367. doi: 10.1097/CCM.0b013e3181b6e439. [DOI] [PMC free article] [PubMed] [Google Scholar]
- 23.Peruchi BB, Petronilho F, Rojas HA, Constantino L, Mina F, Vuolo F, et al. Skeletal muscle electron transport chain dysfunction after sepsis in rats. J Surg Res. 2011;167:e333–e338. doi: 10.1016/j.jss.2010.11.893. [DOI] [PubMed] [Google Scholar]
- 24.Wang XN, Hu ZY, Hu JP, Du J, Mitch WE. Insulin resistance accelerates muscle protein degradation: activation of the ubiquitin-proteasome pathway by defects in muscle cell signaling. Endocrinology. 2006;147:4160–4168. doi: 10.1210/en.2006-0251. [DOI] [PubMed] [Google Scholar]
- 25.Stephens J, Pekala PH. Transcriptional repression of C/EBP and GLUT4 genes in the 3T3-L1 adipocytes by tumor necrosis factor-α: regulation is coordinate and independent of protein synthesis. J Biol Chem. 1992;267:13580–13584. [PubMed] [Google Scholar]
- 26.Tirosh A, Potashnik R, Bashan N, Rudich A. Oxidative stress disrupts insulin-induced cellular redistribution of insulin receptor substrate-1 and phosphatidylinositol 3-kinase in 3T3-L1 adipocytes. A putative cellular mechanism for impaired protein kinase B activation and GLUT4 translocation. J Biol Chem. 1999;274:10595–10602. doi: 10.1074/jbc.274.15.10595. [DOI] [PubMed] [Google Scholar]
- 27.Taylor JH, Beilman GJ. Hyperglycemia in the intensive care unit: no longer just a marker of illness severity. Surg Infect. 2005;6:233–245. doi: 10.1089/sur.2005.6.233. [DOI] [PubMed] [Google Scholar]
- 28.Van den Berghe G, Wouters P, Weekers F. Intensive insulin therapy in the critically ill patients. N Engl J Med. 2001;345:1358–1367. doi: 10.1056/NEJMoa011300. [DOI] [PubMed] [Google Scholar]
- 29.Van den Berghe G, Wilmer A, Hermans G, Meersseman W, Wouters PJ, Milants I. Intensive insulin therapy in the medical ICU. N Engl J Med. 2006;354:449–461. doi: 10.1056/NEJMoa052521. [DOI] [PubMed] [Google Scholar]
- 30.Stephen J, Lee J, Pilch P. Tumor necrosis factor-alpha-induced insulin resistance in 3T3-L1 adipocytes is accompanied by a loss of insulin receptor substrate-1 and GLUT4 expression without a loss of insulin receptor-mediated signal transduction. J Biol Chem. 1997;272:971–976. doi: 10.1074/jbc.272.2.971. [DOI] [PubMed] [Google Scholar]


