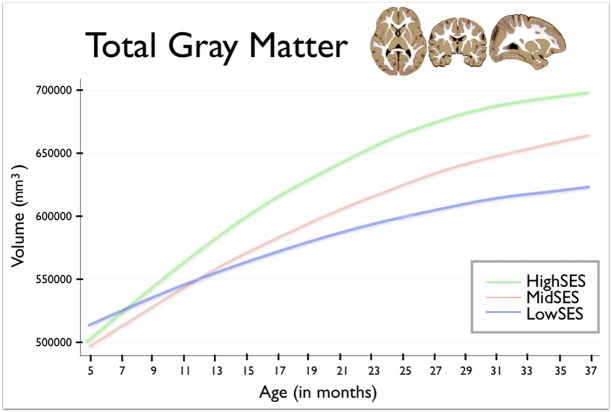
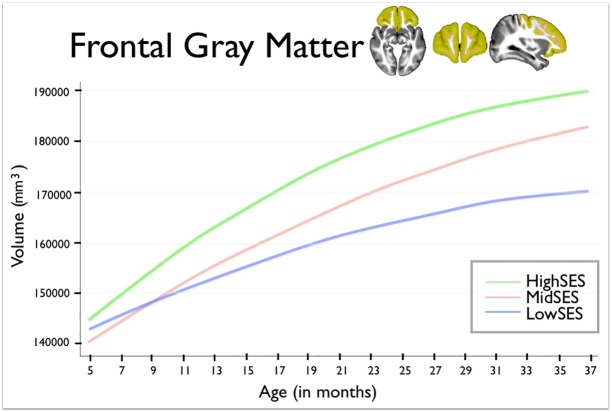
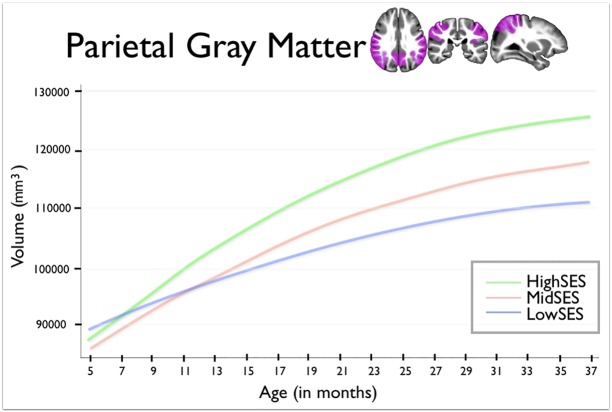
In Figs 2, 3 and 4 of the published article the units of volume are incorrectly noted as cm3. The correct units are mm3.
Fig 2. This figure shows total gray matter volume for group by age.
Age in months is shown on the horizontal axis, spanning from 5 to 37 months. Total gray matter volume is shown on the vertical axis. The blue line shows children from Low SES households; children from Mid SES households are shown in red. The green line shows children from High SES households.
Fig 3. This figure shows frontal lobe gray matter volumes for group by age.
Age in months is shown on the horizontal axis, spanning from 5 to 37 months. Total gray matter volume is shown on the vertical axis. The blue line shows children from Low SES households; children from Mid SES households are shown in red. The green line shows children from High SES households.
Fig 4. This figure shows parietal lobe gray matter volumes for group by age.
Age in months is shown on the horizontal axis, spanning from 5 to 37 months. Total gray matter volume is shown on the vertical axis. The blue line shows children from Low SES households; children from Mid SES households are shown in red. The green line shows children from High SES households.
Reference
- 1. Hanson JL, Hair N, Shen DG, Shi F, Gilmore JH, Wolfe BL, et al. (2013) Family Poverty Affects the Rate of Human Infant Brain Growth. PLoS ONE 8(12): e80954 doi: 10.1371/journal.pone.0080954 [DOI] [PMC free article] [PubMed] [Google Scholar]


