Abstract

This report describes a fragment-based approach to the examination of congeneric organic compounds by NMR spectroscopy. The method combines the classic interpretation of 1D- and 2D-NMR data sets with contemporary computer-assisted NMR analysis. Characteristic NMR profiles of key structural motifs were generated by 1H iterative full spin analysis and then joined together as building blocks to recreate the 1H NMR spectra of increasingly complex molecules. To illustrate the methodology described, a comprehensive analysis of steviol (1), seven steviol glycosides (2–8) and two structurally related isosteviol compounds (9, 10) was carried out. The study also assessed the potential impact of this method on relevant aspects of natural product research including structural verification, chemical dereplication, and mixture analysis.
The characterization of structurally related compounds (e.g., isomers, analogues, homologues, precursors, and derivatives) is an essential part of chemical research, particularly in the fields of organic synthesis and natural product analysis. In the former, the elucidation of reaction products is frequently carried out by comparison with the starting materials, while in the latter, multiple secondary metabolites belonging to the same structural class might be produced by a single biosynthetic locus and hence be present in a given extract.
Nuclear magnetic resonance (NMR) spectroscopy plays a crucial role in structure elucidation and verification,1 providing strong evidence in the form of chemical shifts, coupling constants, nuclear Overhauser effects, and relaxation and exchange rates, among others. As a result, the analysis of congeneric molecules by NMR spectroscopy commonly involves the identification of conserved structural motifs, either by a comparison with previously reported data or the superposition of 1D- and/or 2D-NMR experiments, followed by a comprehensive examination of the experimental observations that pinpoints significant differences between the molecules being compared.
This raises the question as to whether the spectroscopic parameters of known structural motifs can be collected (either by measurement or calculation), digitally stored, and subsequently transferred to other case studies, thereby facilitating the structural characterization of structurally related compounds. By analogy with the formation of a mosaic using small tiles or the construction of objects utilizing interlocking toy bricks, such a methodology will be equivalent to a molecular assembly set, in which each computer-generated 1H NMR profile that depicts a common structural motif (including the characteristic parameters for one or more spin systems) plays the role of a building block.
The present study describes a new method for the development of digital NMR profiles and their subsequent utilization as building blocks to interpret the 1D 1H NMR spectra of a series of increasingly complex, structurally related compounds. This method relies on the application of 1H iterative full spin analysis (HiFSA),2 a postacquisition processing strategy for deriving digital, all-inclusive 1H NMR profiles as well as spectral replicas (i.e., 1H NMR fingerprints) for organic molecules.3 HiFSA has been used typically in combination with conventional 2D-NMR analysis in order to expedite the assignment of proton resonances. The applicability and effectiveness of this method was assessed by performing an in-depth analysis of the 1H NMR spectra of seven steviol glycosides (2–8, Chart 1), a well-known class of glycosylated diterpenoids isolated from the leaves of the stevia plant [Stevia rebaudiana (Bertoni) Bertoni (Asteraceae)].4 The compounds selected for this study share a common aglycone, steviol (ent-13-hydroxykaur-16-en-19-oic acid, 1), which was used as the foundation for developing comprehensive 1H NMR profiles of its derivatives 2–8.
Chart 1.
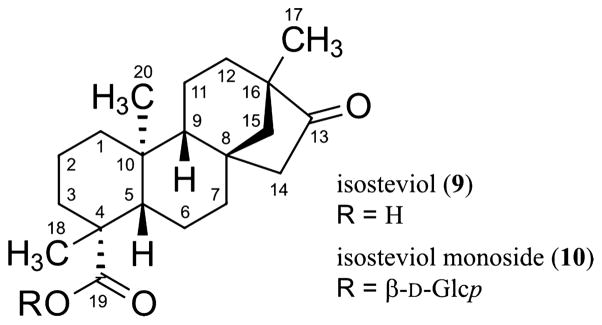
This report also covers the analysis of the 1D 1H NMR spectrum of isosteviol (9, Chart 2), a rearrangement product obtained by hydrolysis of 4.5 In addition, and as an extension of the described approach, the NMR profile of isosteviol monoside (10) was generated using the aglycone 9 as the starting point. Finally, potential applications for the resulting digital 1H NMR profiles are discussed, with particular emphasis on the qualitative and quantitative analysis of commercial stevia (S. rebaudiana) products.
Chart 2.
RESULTS AND DISCUSSION
NMR Profile of Steviol
As a first step toward the development of 1H fingerprints for compounds 2–8, a thorough analysis of the 1H NMR spectrum of the aglycone 1 was carried out. Given the complexity of the tetracyclic ent-kaurene carbon skeleton, and considering the profound effect that conformation can have on the prediction of spectroscopic parameters, a 3D model of 1 was constructed using the crystal structure of atractyloside, an ent-kaurene diterpenoid glycoside isolated from Atractylis gummifera,6 as a molecular template. Next, the 3D model was imported into the PERCH software,7,8 in which relevant NMR descriptors [i.e., chemical shifts (δ), scalar coupling constants (J), and effective line widths (Δν1/2)] were predicted and, following the HiFSA workflow,3 subsequently optimized against the experimental 1H NMR spectrum of 1. In order to reduce the overall computing time, preliminary proton assignments were made using common 2D-NMR experiments (1H,1H-COSY; 1H,1H-NOESY; 1H,13C-HSQC, and 1H,13C-HMBC). As a result, a detailed NMR profile of 1 was generated (see Figure 1 and Supporting Information).
Figure 1.
Section of the calculated (in red) and experimental (in blue) 1H NMR spectra of steviol in DMSO-d6 (1, 44 mM, 600 MHz, 298 K). Calculated residuals are shown in green.
This digital profile, which represents the first building block in this fragment-based strategy, contains the NMR descriptors of three discrete spin systems, including optimized δ and Δν1/2 values for 26 proton resonances, as well as 39 J-couplings. It also contains a full set of proton assignments, thereby creating a strong connection between the calculated NMR spectrum and the 3D molecular model used to predict trial NMR descriptors. Concomitant with its capability to replicate the signal patterns observed in the 1H NMR spectrum (Figure 1), the HiFSA profile also provides a complete description of all diastereotopic methylenes in 1, defining all axial and equatorial hydrogens in the saturated six-membered rings, as well as the prochirality of the methylene hydrogens at C-15. When combined, the 3D molecular model and the digital NMR profile not only provide the means to verify the relative configuration of 1 but also help understand other experimental observations. For example, it is possible to interpret significant differences in the intensity of cross-peaks in 2D-NMR experiments (e.g., COSY and HMBC) by analyzing dihedral angular relationships between atoms in the 3D molecular model and the wide array of calculated coupling constants in the optimized HiFSA profile.
NMR Profiles of Steviol Glycosides
Considering that compounds 2–8 possess different arrangements of glucose and rhamnose residues attached to the steviol core (see Chart 1), the development of 1H fingerprints required the generation of additional building blocks in the form of NMR profiles for β-glucopyranosyl (β-Glcp) and α-rhamnopyranosyl (α-Rhap) moieties. The HiFSA workflow could be readily applied to build these profiles, each one containing a single spin system. However, as one of the objectives of the present study was to effectively transfer building blocks between case studies, the digital NMR profiles of the β-Glcp and α-Rhap units were taken from the previously reported analysis of rutin (quercetin-3-O-α-L-rhamnopyranosyl-(1→6)-β-D-glucopyranoside, 11).2 These trial profiles made available an initial set of NMR descriptors that had to be optimized on a case-by-case basis. Nevertheless, because the pyranose forms of monosaccharides have characteristic, highly conserved coupling patterns,9 the optimization process could focus predominantly on the refinement of chemical shifts (vide infra).
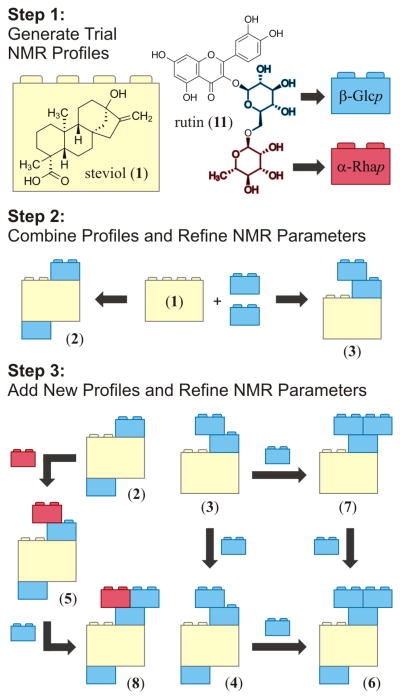
Figure 2 summarizes the general strategy to connect digital building blocks and subsequently generate the 1H fingerprints of the steviol glycosides 2–8. Initially, for the analysis of compounds 2 and 3, two β-Glcp units were combined with the steviol building block by transcribing two copies of the trial β-Glcp descriptors into the text file containing the HiFSA profile of 1. Next, preliminary δ values for the β-Glcp moieties were obtained through the examination of 2D-NMR experiments. Although the analysis of spectral regions with significant signal overlap often represents a challenge, individual 1H resonances were assigned by the analysis of COSY experiments using the anomeric and exchangeable protons to access each spin system. Other NMR experiments such as 1D selective COSY or TOCSY, 2D TOCSY, and 2D HSQC-TOCSY might also provide valuable information. The connectivities between the sugar units and the steviol core were verified by analysis of long-range 1H,13C correlations in 2D HMBC experiments. In a final step, the NMR parameters of the three building blocks were refined simultaneously against the experimental 1H NMR spectrum of the corresponding steviol glycoside by using the quantum-mechanical total-line-shape (QMTLS) iterators built within PERCH.12
Figure 2.
Fragment-based strategy to computer-aided NMR analysis, illustrated using interlocking toy bricks. The digital NMR profiles of key structural motifs (1, α-Rhap, and β-Glcp) were combined and optimized simultaneously to reproduce the 1D 1H NMR spectra of congeneric molecules 2–8.
The 1H fingerprints of compounds 4–8 were constructed using the same general strategy, although each new profile was generated by adding an extra monosaccharide building block to an already optimized HiFSA profile (Figure 2). After each new building block was added to an existing HiFSA profile, additional parameter optimization steps were carried out. This process included the determination of preliminary proton assignments for the new monosaccharide by 2D-NMR analysis, as well as the adjustment of the NMR parameters in the original HiFSA profile to account for chemical shift perturbations associated with the presence of the new substituent. These perturbations, which commonly originate from steric, electric-field, hydrogen-bonding, or magnetic anisotropy effects, give rise to chemical shift differences (Δδ) that may require manual corrections to the original HiFSA profile. However, in the case of the steviol glycosides analyzed in this study, these Δδ values were relatively small (typically in the 0.1–0.3 ppm range). Therefore, the parameter re-optimization process was performed largely by automation using the QMTLS iterators.12
As a result, the incorporation of one α-Rhap unit to the digital profile of 2 gave access to the 1H fingerprint of 5, and the subsequent addition of one β-Glcp unit enabled the assembly of the NMR profile of 8, which encompasses a total of 64 chemical shifts, an equivalent number of effective line widths, and 81 scalar coupling constants. In a similar manner, the addition of β-Glcp units to the digital HiFSA profile of 3 eventually led to the generation of 1H fingerprints for compounds 4, 7, and 6 (Figure 2). Notably, the optimized 1H NMR profile of 6 contains as many as 66 optimized δ values and 85 J-couplings. In some cases, agreement between the experimental and calculated NMR spectra was achieved only after considering the presence of residual solvents such as methanol and ethanol, which are most likely remnants of final (re)crystallization steps.10 Text files containing the HiFSA profiles generated in this study can be found in the Supporting Information, together with comparisons between calculated 1H fingerprints and experimental 1D-NMR spectra.
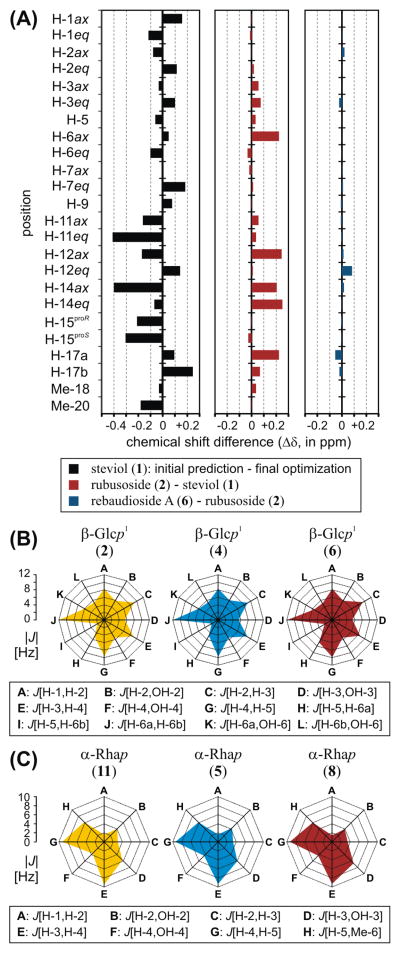
The rationale for utilizing pre-existing profiles as building blocks to develop 1H fingerprints of complex molecules can be illustrated by comparing some of the digital NMR profiles generated during the course of this study (Figure 3A). For example, in the case of steviol, the predicted 1H chemical shift values exhibited significant deviations from their optimized counterparts. This gap between prediction output and optimization results is not uncommon.11 Assuming that experimental NMR data are available for comparison, this gap frequently can be overcome either by performing semi-automatic analysis of plausible solutions with PERCH’s Automated Consistency Analysis (ACA) module12 or by making manual adjustments. However, as the number of NMR descriptors to be optimized increases, bridging this gap can be challenging. Furthermore, the successive analysis of congeneric molecules may require a recurrent correction of chemical shifts corresponding to conserved structural motifs.
Figure 3.
(A) Chemical shift differences (Δδ) between protons located in the ent-kaurene cores of steviol (1), rubusoside (2), and rebaudioside A (6). (B) Radar graphs built using the optimized J-coupling patterns of β-glucopyranosyl (β-Glcp) moieties in rubusoside (2), stevioside (4), and rebaudioside A (6). (C) Radar graphs built using the optimized J-coupling patterns of α-rhamnopyranosyl (α-Rhap) moieties in rutin (11), dulcoside A (5), and rebaudioside C (8).
Conversely, the use of preorganized collections of NMR parameters obtained in previous analyses narrows the gap between initial and final δ values. For instance, a comparison between the optimized chemical shifts of the steviol core of compounds 1 and 2 (Figure 3A) showed that chemical shift differences are less than 0.25 ppm, with the greatest Δδ values matching the regions in close proximity to the points of attachment of the two β-Glcp units in 2. A similar comparison between the chemical shifts of the aglycones of 2 and 6 indicated that the presence of two additional β-Glcp moieties in remote locations results in only minor perturbations to the chemical shifts of the steviol core (Figure 3A). As a result, this fragment-based strategy reduces substantially the time and effort required for the optimization process, enabling the user to focus on the examination and assignment of new building blocks.
The analysis of scalar coupling constants also provides insightful information on the quality of the simulation outcome. As building blocks are transferred between case studies and honed against new experimental 1H NMR data sets, the consistency of the J-coupling patterns serves as an additional means of authentication. As an example, the optimized J values of β-Glcp and α-Rhap units in different steviol glycosides were plotted in the radar graphs shown in Figure 3B and 3C, respectively. In both cases, the matching shapes of the irregular polygons indicate that the monosaccharides share common sets of coupling constants, thereby corroborating the identity of the β-Glcp and α-Rhap moieties.
Disassembling the NMR Spectra of Steviol Glycosides
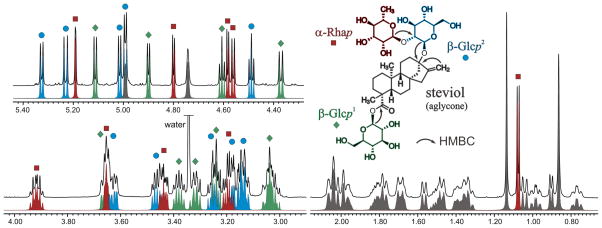
Considering that each of the digital building blocks contains a detailed description of one or more spin systems that remain independent during and after the optimization process, the resulting 1H fingerprints also can be disassembled. In other words, the contribution of each building block to the overall signal profile can be extracted and plotted, thus enabling a thorough interpretation of crowded spectral regions. As an example, Figure 4 shows the individual contributions of the four digital building blocks (i.e., steviol plus one α-Rhap and two β-Glcp units) utilized to recreate the 1H NMR spectrum of 5. The approach described herein enabled the unequivocal assignment of all proton resonances, including those located in the crowded region between 3 and 4 ppm. Importantly, this approach simultaneously enables a rapid verification of the relative configuration of each of the individual stereoclusters, which on its own represents a major task and a potential source of misidentification.
Figure 4.
Characteristic resonances corresponding to the four building blocks that form the 1H fingerprint of dulcoside A (5). The experimental 1H NMR spectrum in DMSO-d6 (33 mM, 600 MHz, 298 K) is shown in black. Arrows denote key HMBC correlations to establish connectivities between the four building blocks.
NMR Profile of Isosteviol
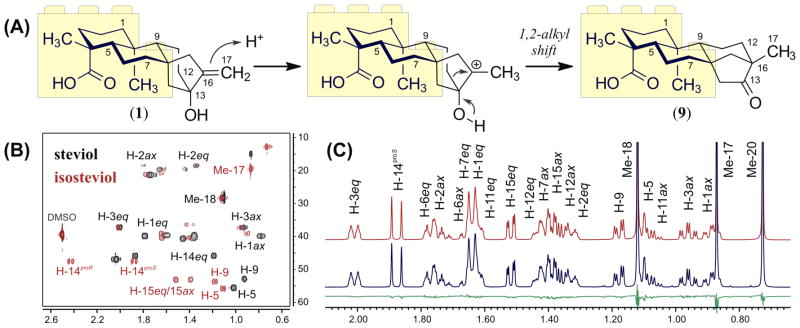
The assembly/disassembly of 1H fingerprints of the steviol glycosides 2–8 demonstrates that characteristic HiFSA profiles of known structural motifs can be combined to replicate complex NMR signal patterns. At the same time, the fact that discrete spin systems remain independent during the optimization steps opens new possibilities for this fragment-based strategy. For instance, the descriptors of a given spin system can be transferred between digital NMR profiles to facilitate the analysis of congeneric molecules. As part of a proof-of-concept case study, fragments of the HiFSA profile of 1 were incorporated into the computer-aided analysis of isosteviol (9), a derivative produced by a Wagner–Meerwein rearrangement of the steviol core under acidic conditions (Figure 5A).
Figure 5.
(A) Wagner–Meerwein rearrangement of steviol (1) to form isosteviol (9), highlighting the conserved fragment C-1/C-7. (B) Comparison between sections of the 2D 1H,13C-HSQC experiments of 1 (in black) and 9 (in red). (C) Section of the calculated (in red) and experimental (in blue) 1H NMR spectra of 9 in DMSO-d6 (37 mM, 600 MHz, 298 K). Calculated residuals are shown in green.
First, a trial set of predicted NMR descriptors for 9 was obtained using the conventional HiFSA workflow. Next, the spectroscopic parameters (δ, J, Δν1/2) corresponding to the C-1/C-7 fragment of 9 were replaced with the optimized parameters within the HiFSA profile of 1. The chemical shifts of the C-1/C-7 fragment, which comprises two discrete spin systems, were successively adjusted using an HSQC overlay (Figure 5B), whereas the remaining assignments were made by 2D-NMR analysis. After subsequent optimization, the complex resonance patterns observed in the 1H NMR spectrum of 9 were effectively replicated (Figure 5C). The digital NMR profile of 9 includes optimized δ and Δν1/2 values for 24 resonances, as well as 34 scalar coupling constants, with 21 of them belonging to the conserved C-1/C-7 fragment. This example demonstrates that complex NMR profiles (such as that of 1) can be taken apart to form smaller building blocks, which then can be transferred to other case studies. Moreover, the development of a comprehensive NMR profile of the isosteviol core enables the application of this fragment-based approach to additional derivatives such as isosteviol monoside (10), for which a complete 1H fingerprint was readily generated using the NMR profile of the aglycone 9 and a β-Glcp unit as initial building blocks (see Supporting Information).
Qualitative and Quantitative Applications
The development of characteristic NMR profiles of compounds 2–8 provides a valuable platform for the examination of additional samples containing steviol glycosides. In the case of pure substances, rapid structural verification can be achieved by comparing the 1D 1H NMR spectrum of the analyte in DMSO-d6 with the digital 1H fingerprints developed in this study. In fact, as the NMR parameters that describe each spin system are magnetic-field-independent, the HiFSA profiles can be effectively exploited to analyze 1H NMR data acquired at different field strengths. Applications for this methodology in de novo structure elucidation also can be foreseen, as comparisons between the 1D 1H NMR spectrum of a new chemical entity and available 1H fingerprints can aid in identifying conserved structural motifs.
Mixture analysis is perhaps the area in which the digital NMR profiles generated in this study can have the greatest and most immediate impact. Previous reports have described in detail the application of 1H fingerprints to analyze a wide variety of complex samples, ranging from botanical extracts to biofluids.2,13–15 This approach, recently coined quantitative quantum mechanical spectral analysis (qQMSA),16 represents the foundation for the application of quantitative 1H NMR (qHNMR) spectroscopy and HiFSA in tandem2,15 and utilizes 1H fingerprints as surrogate standards to carry out a targeted analysis of multiple substances of interest simultaneously.
Given the growing demand for stevia (S. rebaudiana) products as sugar substitutes, there is an increasing interest in the development of analytical methods for the determination of steviol glycosides in crude extracts, enriched fractions, reference standards, and even commercial sweeteners. At least two previous reports have described the use of quantitative 1H NMR to examine mixtures of steviol glycosides,17,18 making a compelling case for the application of NMR spectroscopy as a complementary approach to conventional LC-UV and LC-MS methods.
Taking this into account, a qHNMR method to determine the content of steviol glycosides in mixtures was developed by using the 1H fingerprints of compounds 2–8 as input. As a proof-of-concept, the composition of two commercial samples (an over-the-counter, prepackaged sweetener and a certified stevia reference material) was assessed. Both samples were dissolved in DMSO-d6, and their 1D 1H NMR spectra were subsequently recorded under quantitative conditions.19 Next, the resulting NMR data were imported into PERCH, and the available 1H fingerprints were simultaneously fitted into the NMR spectra using the QMTLS iterators as described before.3 Relative proportions between the components identified were calculated using the 100% qHNMR method.20
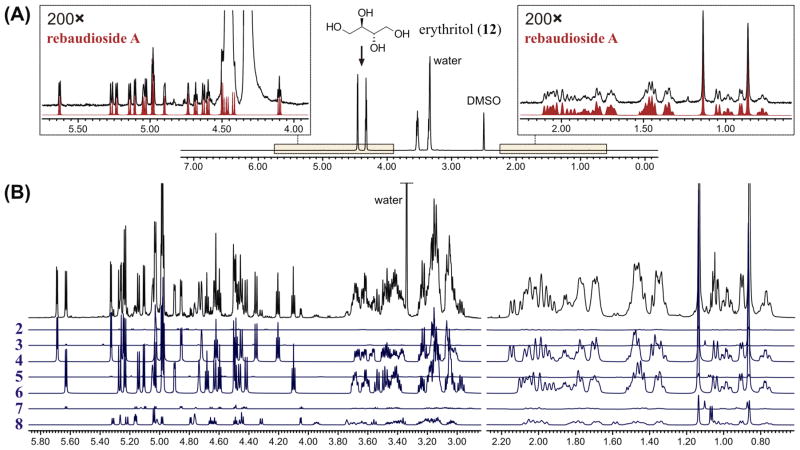
In the case of the commercial sweetener, a preliminary examination of the 1H NMR spectrum (Figure 6A) showed that all of the predominant resonances corresponded to erythritol (12), one of the ingredients specified in the product label. In order to include 12 among the target analytes, its digital NMR profile was generated using HiFSA (see Supporting Information) and then transcribed into the input file that contains the other 1H fingerprints generated in this study. As a result, it was determined that the relative molar proportion between 12 and rebaudioside A (6) was approximately 650:1. On a weight basis, this is equivalent to 98.8% w/w of 12 and 1.2% w/w of 6, as the level of all of the other steviol glycosides fell below the limit of detection of NMR under the quantitative conditions used. Given that 6 exhibits a relative sweetness potency of approximately 200 times that of sucrose and a noticeable bitter taste at high concentrations,21 commercial stevia products often contain blends of other sweeteners, such as 12, with small amounts of high-purity 6 (also known as “rebiana”).10 Overall, this example demonstrates that quantitative 1H NMR spectroscopy can be effectively applied to the analysis of tabletop stevia sweeteners without the need for chemical separation.
Figure 6.
Analysis of mixtures using 1H fingerprints. (A) Determination of rebaudioside A (6) in a commercial sweetener. The experimental 1H NMR spectrum (21.6 mg in 600 μL of DMSO-d6, 600 MHz, 298 K) is shown in black, and the intensity-adjusted 1H fingerprint of 6 is shown in red. (B) Determination of the major components of a stevia reference standard. The experimental 1H NMR spectrum (3.6 mg in 180 μL of DMSO-d6, 600 MHz, 298 K) is shown in black, and the intensity-adjusted 1H fingerprints of compounds 2–8 are shown in blue.
Regarding the certified stevia reference material, computer-aided analysis enabled the simultaneous identification and quantitative assessment of the seven steviol glycosides tested (Figure 6B). Rebaudioside A (6) and stevioside (4), the two main steviol glycosides commonly found in stevia extracts, were identified as the major constituents of the sample, accounting for 48.5% and 38.8% w/w, respectively. The reference material also contained a substantial amount of rebaudioside C (8, 9.0% w/w), as well as smaller but yet significant amounts of rebaudioside B (7, 1.5% w/w), dulcoside A (5, 0.9% w/w), steviolbioside (3, 0.8% w/w), and rubusoside (2, 0.5% w/w). This example provides further evidence of the broad applicability of qNMR and HiFSA fingerprinting for the analysis of mixtures, particularly in cases where the examination of characteristic resonance patterns is hindered by extensive overlap.
Although HiFSA fingerprinting can be carried out in a variety of deuterated solvents,3 DMSO-d6 was selected for this study because it provides several practical advantages, including good signal dispersion in the 1D 1H NMR spectra and access to exchangeable protons, which facilitates the overall assignment process. Despite its well-known shortcomings (e.g., it is difficult to remove, highly viscous, and hygroscopic), the fact that many organic substances are soluble in DMSO-d6 makes this solvent a widely suitable option for small-molecule NMR analysis. Importantly, as HiFSA profiles can be readily transposed between compound classes, the generation of additional NMR fingerprints in a standardized solvent (such as DMSO-d6, as much as its use is practically feasible) will create a unique resource and enable original applications in natural products research, ranging from structural dereplication to targeted quantitation in complex mixtures.
In conclusion, the present study demonstrates that digital representations of known structural motifs can be generated, transferred, and subsequently combined as building blocks to facilitate the interpretation of complex NMR data sets. As an example, complete 1H fingerprints of seven steviol glycosides (2–8) were assembled using three basic interchangeable modules (i.e., the HiFSA profiles of 1, α-Rhap, and β-Glcp). The main strength of this fragment-based strategy resides in its adaptability to a broad range of applications, as the development of new digital building blocks will enable a thorough analysis of a large variety of organic molecules. These building blocks may include biosynthetic precursors and intermediates in natural product analysis, common substituents and protecting groups in synthetic organic chemistry, and privileged structures and other molecular scaffolds in medicinal chemistry, among others. Therefore, the assembly of data repositories containing HiFSA profiles and 1H NMR fingerprints of a wide variety of organic compounds bears much potential for the advanced documentation, quantitation, and dereplication of isolated natural products,22,23 as well as for the analysis of more complex materials such as metabolomic samples. Ultimately, this methodology will foster creative and innovative ways of analyzing complex resonance patterns, while improving our understanding of intricate NMR spectra.
EXPERIMENTAL SECTION
Materials
Authenticated samples and certified reference standards were kindly provided by the United States Pharmacopeial Convention, Inc. (Rockville, MD, USA) and ChromaDex Inc. (Irvine, CA, USA). The commercial stevia sweetener was purchased in a local supermarket in the Chicago metropolitan area. All materials were used as received. Hexadeuterodimethyl sulfoxide (DMSO-d6, D 99.9%) was obtained from Cambridge Isotope Laboratories, Inc. (Tewksbury, MA, USA). NMR tubes were purchased from Norell Inc. (Landisville, NJ, USA).
Sample Preparation
NMR samples of compounds 1–10 and 12 were prepared by precisely weighing 1–10 mg of material (±0.01 mg), followed by the addition of 180 μL of DMSO-d6. Next, the solutions were transferred to 3 mm, 7 in. NMR tubes. Samples were prepared at the following concentrations: 1, 44 mM; 2, 21 mM; 3, 20 mM; 4, 29 mM; 5, 33 mM; 6, 23 mM; 7, 26 mM; 8, 35 mM; 9, 37 mM; 10, 8.3 mM; and 12, 107 mM. Samples of the commercial sweetener containing steviol glycosides were prepared by precisely weighing 20–25 mg of material directly into 5 mm, 7 in. NMR tubes, followed by the addition of 600 μL of DMSO-d6.
NMR Spectroscopy
NMR measurements were recorded at 600.13 MHz 1H frequency using a Bruker AVANCE NMR spectrometer equipped with a 5 mm, triple-resonance inverse detection TXI cryoprobe. All NMR experiments were carried out at 298 K. Chemical shifts (δ) are expressed in ppm with reference to the residual solvent signals (2.500 ppm for 1H and 39.510 ppm for 13C, relative to TMS). Scalar coupling constants (J) and effective line widths (Δν1/2) are given in Hz.
The 1D 1H NMR spectra were recorded under quantitative conditions using a 90° flip angle, an acquisition time of 4.0 s, and a relaxation delay of 60 s. A total of eight transients were collected with a spectral width of 30 ppm (centered at 7.5 ppm), 143 882 data points, and a fixed receiver gain of 16. The NMR spectra of samples intended for quantitative analysis were recorded with an increased number of transients (16 to 64) in order to achieve a greater signal-to-noise ratio. The NMR data were processed with either TopSpin software (v. 3.2, Bruker BioSpin GmbH, Rheinstetten, Germany) or NUTS software (v. 201004, Acorn NMR Inc., Livermore, CA, USA) using a Lorentzto-Gaussian window function (line broadening = −0.3 Hz, Gaussian factor = 0.05). Zero filling to 262 144 data points was applied prior to Fourier transformation, and the resulting NMR spectra were subjected to manual phase adjustment and automatic baseline correction using polynomial functions. All 2D-NMR experiments (magnitude-mode 1H,1H-COSY; phase-sensitive 1H,13C-HSQC; 1H,13C-HMBC optimized for 8 Hz heteronuclear couplings; and 1H,1H-NOESY) were recorded with 2048 data points in F2 and 256 increments in F1. Subsequent 2D-NMR data processing was carried out with Mnova software (v. 6.0.2, Mestrelab Research S.L., Santiago de Compostela, Spain). The NMR data sets were zero filled to obtain 4096 × 4096 data matrices. After Fourier transformation, 2D-NMR experiments were phase-adjusted (if needed) and baseline-corrected using polynomial functions.
Computer-Assisted NMR Analysis
Full spin analysis was carried out with PERCH NMR Tools (v. 2010.1 and v. 2013.1, PERCH Solutions Ltd., Kuopio, Finland).7,8 The 3D molecular models of 1 and 9 were built using the X-ray crystal structures of atractyloside6 and isosteviol benzoyloxymethyl ester,24 respectively, as templates. Standard crystallographic information files (CIF) were obtained from the Cambridge Crystallographic Data Centre (CCDC)25 and converted to Tripos Sybyl Mol2 format files using OpenBabelGUI software (v. 2.3.0, http://openbabel.org).26 The resulting .mol2 files were imported and edited in PERCH’s Molecular Modeling Software (MMS). The 3D molecular model of erythritol (12) was built from scratch in the MMS module.
Steviol (1) was subjected to semi-automated HiFSA as described in detail previously.3 Briefly, the 3D molecular structure and processed NMR data were imported into PERCH’s Automated Consistency Analysis (ACA) module.12 ACA automatically performed the peak picking and integration of the 1H NMR spectra, as well as the prediction of suitable NMR descriptors (δ, J, Δν1/2). Proton assignments were established on the basis of 2D-NMR analysis and transcribed to PERCH using the ACA graphical user interface (ACA GUI). The predicted NMR parameters were then refined in the PERCH shell using QMTLS iteration until the calculated 1H NMR spectra matched the experimental observations. The optimized δ, J, and Δν1/2 values were then saved in a HiFSA profile, i.e., a text-format, digital file with PERCH parameters (.pms) extension (see Supporting Information).
Preliminary analysis of isosteviol (9) was carried out with the ACA module. Prior to the optimization steps, the trial digital profile of 9 was modified using Notepad++ software (v. 5.9.6.2, http://notepad-plus-plus.org) to include the optimized NMR parameters corresponding to the C-1/C-7 fragment of 1. Additional proton assignments were established by 2D-NMR analysis and transcribed to the trial NMR profile of 9, which was subsequently imported into the PERCH shell and honed using the QMTLS iterators until convergence was reached. The optimized parameters were then saved in the HiFSA profile of 9 (see Supporting Information). Comprehensive NMR profiles of the remaining compounds were generated by combining the digital NMR profiles of the corresponding aglycone and sugar units. Trial NMR descriptors of β-glucopyranosyl and α-rhamnopyranosyl moieties were obtained from the full spin analysis of rutin (11).2 In each case, the digital profiles of the aglycone and the sugar units were combined in a single .pms file using Notepad++ and imported into the PERCH shell for subsequent optimization following the procedure described above. The digital NMR profile of erythritol (12) was generated using the conventional HiFSA workflow.3
All HiFSA profiles were generated on a portable PC equipped with a 2.10 GHz Intel Core 2 Duo T8100 processor, 4 GB RAM, a 150 GB hard drive, and Windows XP Professional with Service Pack 3. A modest familiarity with the PERCH software should enable users to generate a complete HiFSA profile of a molecule such as steviol (1) in less than 60 min (including complete parameter optimization steps). Digital profiles generated by combination of building blocks (such as those of the steviol glycosides 2–8) can be generated in 60–90 min, depending on manual chemical shift adjustments needed.
Quantitative 1H NMR Analysis
The analysis of commercial products was carried out using the relative (100%) qHNMR method.20 Available HiFSA profiles were combined in a single .pms text file using Notepad++. Next, the resulting .pms file and the experimental 1D 1H NMR spectra of the commercial stevia products were imported into the PERCH shell, where all of the HiFSA profiles were simultaneously fitted to each NMR spectrum using QMTLS iteration. To avoid distortion of known splitting patterns, the optimized J values were kept constant during the iteration processes. Molar ratios were calculated automatically as part of the optimization process.
Supplementary Material
Acknowledgments
The authors thank M. Niemitz and Dr. S.-P. Korhonen (PERCH Solutions Ltd.) as well as Drs. K. Adams, A. Potts, G. Giancaspro, and M. Lipp (United States Pharmacopeial Convention, Inc.) for their valuable comments and insight toward this research study. J.G.N. thanks Dr. A. Hernández Daranas and the Marine Natural Products research team at Universidad de La Laguna for their kind hospitality and assistance during a brief sojourn in Tenerife, Spain. We also acknowledge Dr. B. Ramirez (University of Illinois at Chicago) for his timely assistance as facility director of the NMR Laboratory at the Center for Structural Biology. This research study was co-funded by the NIH through grant RC2 AT005899 (awarded to G.F.P. by NCCAM) and by the United States Pharmacopeial Convention through the USP Global Research Program (fellowship awarded to J.G.N.).
Footnotes
Notes
The authors declare no competing financial interest.
Raw 1D 1H NMR data, HiFSA profiles in PERCH .pms format, and comparisons between experimental and calculated NMR spectra. This material is available free of charge via the Internet at http://pubs.acs.org.
References
- 1.Breton RC, Reynolds WF. Nat Prod Rep. 2013;30:501–524. doi: 10.1039/c2np20104f. [DOI] [PubMed] [Google Scholar]
- 2.Napolitano JG, Gödecke T, Rodríguez-Brasco MF, Jaki BU, Chen SN, Lankin DC, Pauli GF. J Nat Prod. 2012;75:238–248. doi: 10.1021/np200949v. [DOI] [PMC free article] [PubMed] [Google Scholar]
- 3.Napolitano JG, Lankin DC, McAlpine JB, Niemitz M, Korhonen SP, Chen SN, Pauli GF. J Org Chem. 2013;78:9963–9968. doi: 10.1021/jo4011624. [DOI] [PMC free article] [PubMed] [Google Scholar]
- 4.Ceunen S, Geuns JMC. J Nat Prod. 2013;76:1201–1228. doi: 10.1021/np400203b. [DOI] [PubMed] [Google Scholar]
- 5.Avent AG, Hanson JR, De Oliveira BH. Phytochemistry. 1990;29:2712–2715. [Google Scholar]
- 6.Brucoli F, Borrello MT, Stapleton P, Parkinson GN, Gibbons S. J Nat Prod. 2012;75:1070–1075. doi: 10.1021/np300080w. [DOI] [PubMed] [Google Scholar]
- 7.Laatikainen R, Niemitz M, Malaisse WJ, Biesemans M, Willem R. Magn Reson Med. 1996;36:359–365. doi: 10.1002/mrm.1910360306. [DOI] [PubMed] [Google Scholar]
- 8.Laatikainen R, Niemitz M, Weber U, Sundelin J, Hassinen T, Vepsalainen J. J Magn Reson, Ser A. 1996;120:1–10. [Google Scholar]
- 9.Duus JO, Gotfredsen CH, Bock K. Chem Rev. 2000;100:4589–4614. doi: 10.1021/cr990302n. [DOI] [PubMed] [Google Scholar]
- 10.Carakostas M, Prakash I, Kinghorn AD, Wu CD, Soejarto DD. In: Alternative Sweeteners. O’Brien-Nabors L, editor. Chapter 11. CRC Press; Boca Raton: 2012. pp. 159–180. [Google Scholar]
- 11.Lodewyk MW, Siebert MR, Tantillo DJ. Chem Rev. 2011;112:1839–1862. doi: 10.1021/cr200106v. [DOI] [PubMed] [Google Scholar]
- 12.Laatikainen R, Tiainen M, Korhonen S-P, Niemitz M. In: Encyclopedia of Magnetic Resonance. Harris RK, Wasylishen RE, editors. John Wiley & Sons; Chichester: 2011. pp. 1–12. [Google Scholar]
- 13.Aranibar N, Borys M, Mackin NA, Ly V, Abu-Absi N, Abu-Absi S, Niemitz M, Schilling B, Li ZJ, Brock B, Russell RJ, II, Tymiak A, Reily MD. J Biomol NMR. 2011;49:195–206. doi: 10.1007/s10858-011-9490-8. [DOI] [PubMed] [Google Scholar]
- 14.Makinen VP, Tynkkynen T, Soininen P, Peltola T, Kangas AJ, Forsblom C, Thorn LM, Kaski K, Laatikainen R, Ala-Korpela M, Groop PH. J Proteome Res. 2012;11:1782–1790. doi: 10.1021/pr201036j. [DOI] [PubMed] [Google Scholar]
- 15.Napolitano JG, Gödecke T, Lankin DC, Jaki BU, McAlpine JB, Chen SN, Pauli GF. J Pharm Biomed Anal. 2014;93:59–67. doi: 10.1016/j.jpba.2013.06.017. [DOI] [PMC free article] [PubMed] [Google Scholar]
- 16.Tiainen M, Soininen P, Laatikainen R. J Magn Reson. 2014;242:67–78. doi: 10.1016/j.jmr.2014.02.008. [DOI] [PubMed] [Google Scholar]
- 17.Pieri V, Belancic A, Morales S, Stuppner H. J Agric Food Chem. 2011;59:4378–4384. doi: 10.1021/jf104922q. [DOI] [PubMed] [Google Scholar]
- 18.Tada A, Takahashi K, Ishizuki K, Sugimoto N, Suematsu T, Arifuku K, Tahara M, Akiyama T, Ito Y, Yamazaki T, Akiyama H, Kawamura Y. Chem Pharm Bull. 2013;61:33–38. doi: 10.1248/cpb.c12-00736. [DOI] [PubMed] [Google Scholar]
- 19.Pauli GF, Gödecke T, Jaki BU, Lankin DC. J Nat Prod. 2012;75:834–851. doi: 10.1021/np200993k. [DOI] [PMC free article] [PubMed] [Google Scholar]
- 20.Pauli GF, Jaki BU, Lankin DC, Walter JA, Burton IW. In: Bioactive Natural Products: Detection, Isolation and Structural Determination. Colegate SM, Molyneux RJ, editors. Chapter 4. Taylor & Francis CRC Press; New York: 2008. pp. 113–142. [Google Scholar]
- 21.Prakash I, DuBois GE, Clos JF, Wilkens KL, Fosdick LE. Food Chem Toxicol. 2008;46:S75–S82. doi: 10.1016/j.fct.2008.05.004. [DOI] [PubMed] [Google Scholar]
- 22.Pauli GF, Chen SN, Lankin DC, Bisson J, Case RJ, Chadwick LR, Gödecke T, Inui T, Krunic A, Jaki BU, McAlpine JB, Mo S, Napolitano JG, Orjala J, Lehtivarjo J, Korhonen SP, Niemitz M. J Nat Prod. 2014;77:1473–1487. doi: 10.1021/np5002384. [DOI] [PMC free article] [PubMed] [Google Scholar]
- 23.Pauli GF, Chen SN, Simmler C, Lankin DC, Gödecke T, Jaki BU, Friesen JB, McAlpine JB, Napolitano JG. J Med Chem. 2014;57:9220–9231. doi: 10.1021/jm500734a. [DOI] [PMC free article] [PubMed] [Google Scholar]
- 24.Cai J, Zhou W, Chen J, Sun M, Ji M. J Chem Crystallogr. 2009;39:108–111. [Google Scholar]
- 25.Allen FH. Acta Crystallogr, Sect B. 2002;B58:380–388. doi: 10.1107/s0108768102003890. [DOI] [PubMed] [Google Scholar]
- 26.O’Boyle NM, Banck M, James CA, Morley C, Vandermeersch T, Hutchison GR. J Cheminf. 2011;3:33–46. doi: 10.1186/1758-2946-3-33. [DOI] [PMC free article] [PubMed] [Google Scholar]
Associated Data
This section collects any data citations, data availability statements, or supplementary materials included in this article.


