

Abstract
Purpose
To investigate the feasibility of utilizing brain stiffness as a potential biomarker for behavioral variant frontotemporal dementia (bvFTD) patients. Magnetic resonance elastography (MRE) is a noninvasive technique for evaluating the mechanical properties of brain tissue in vivo. MRE has demonstrated decreased brain stiffness in patients with Alzheimer's disease.
Materials and Methods
We examined five male subjects with bvFTD and nine cognitively normal age‐matched male controls (NC) with brain 3T MRE. Stiffness was calculated in nine regions of interest (ROIs): whole brain (entire cerebrum excluding cerebellum), frontal lobes, occipital lobes, parietal lobes, temporal lobes, deep gray matter / white matter (GM/WM; insula, deep gray nuclei and white matter tracts), cerebellum, sensorimotor cortex (pre‐ and postcentral gyri), and a composite region labeled FT (frontal and temporal lobes excluding the pre‐ and postcentral gyri).
Results
Significantly lower stiffness values were observed in the whole brain (P = 0.007), frontal lobe (P = 0.001), and temporal lobes (P = 0.005) of bvFTD patients compared to NC. No significant stiffness differences were observed in any other ROIs of bvFTD patients compared to NC (P > 0.05). These results demonstrate that statistically significant brain softening occurs in the frontal and temporal lobes of bvFTD patients, which corresponds to the expected pathophysiology of bvFTD.
Conclusion
Future studies evaluating the feasibility of brain MRE for early disease detection and monitoring disease progression could shed new insights into understanding the mechanisms involved in bvFTD. J. Magn. Reson. Imaging 2016;43:474–478.
Keywords: behavioral variant frontotemporal dementia (bvFTD), brain stiffness, frontotemporal dementia (FTD), magnetic resonance elastography (MRE)
Magnetic resonance elastography (MRE) is a technique to noninvasively measure tissue stiffness akin to palpation.1 MRE is a three‐step process beginning with the introduction of shear waves via an external vibration source. The shear waves are then imaged with a phase‐contrast MRI pulse sequence with motion‐encoding gradients synchronized to the external motion. Finally, the shear wave images are mathematically inverted to calculate tissue stiffness.
MRE has been used for brain imaging because of its potential as a diagnostic aid,2, 3, 4, 5, 6 with recent studies showing decreased brain stiffness in multiple sclerosis 7 and Alzheimer's disease (AD).8 It has also been used to study the stiffness of meningiomas preoperatively.9
Recent work has demonstrated that MRE is capable of detecting region‐specific alterations in stiffness in AD that follow the known topography of the disease.10 The purpose of this work was to apply this technique to measure brain stiffness in frontotemporal dementia (FTD), which has a distinct spatial pattern, to further investigate the spatial specificity of stiffness changes in neurodegenerative disease.
Materials and Methods
This study was approved by our Institutional Review Board, and the behavioral variant FTD (bvFTD) subjects as well as the normal controls (NC) were imaged after obtaining written informed consent from the subjects and/or their proxies.
Subjects
We studied brain stiffness in five male subjects with bvFTD (age range 53–65 years, mean 60 years). The diagnosis of bvFTD was based on the guidelines from the International Behavioral Variant FTD Criteria Consortium 11 as well as positron emission tomography (PET) imaging and genetic testing. The bvFTD patients included monozygotic twins with a mutation in the gene encoding progranulin, two patients with mutations in the gene encoding microtubule‐associated protein tau, and one patient with the GGGGCC expansion in chromosome 9 open reading frame 72.
Given a recent observation that brain stiffness is altered in AD,8 all nine NC male subjects (age range 55–66 years, mean 61 years) used for comparison with the bvFTD subjects were documented to be free from AD beta‐amyloid pathology via automated analysis of Pittsburgh Compound‐B PET images.12
MRE Acquisition
The MRE images were collected with the same protocol for both bvFTD and NC subjects using a modified single‐shot spin‐echo EPI pulse sequence on a 3T MR imager (SIGNA Excite, GE Healthcare, Waukesha, WI). Shear waves of 60 Hz were introduced into the brain as previously described.8 An active pneumatic driver (located outside the scanner room) vibrated a soft, pillow‐like passive driver placed under the subject's head. The resulting displacement field was imaged with the following parameters: relaxation time / echo time (TR/TE) = 3600/62 msec; field of view (FOV) = 24 cm; bandwidth (BW) = 250 kHz; 72 × 72 imaging matrix reconstructed to 80 × 80; frequency encoding in the right–left direction; 3× parallel imaging acceleration; 48 contiguous 3‐mm‐thick axial slices; motion encoding in the positive and negative x, y, and z directions; and 8 phase offsets sampled over one period of the 60‐Hz motion. The resulting images have 3 mm isotropic resolution and were acquired in less than 7 minutes. Two additional phase offsets with the motion turned off were acquired for subsequent signal‐to‐noise ratio (SNR) calculations.
Image Processing
The MRE processing pipeline (Fig. 1) for measuring regional brain stiffness has been described 12, 13 and begins by calculating the complex phase‐difference images in each of the x, y, and z motion‐encoding directions. The curl field was calculated from the displacement field to reduce longitudinal and boundary effects. To reduce slice‐to‐slice phase discontinuities, a 2D lowpass filter was applied to the complex phase difference images. Wave images were then calculated as the phase‐difference between the original complex phase difference images and the lowpass‐filtered phase difference images.
Figure 1.
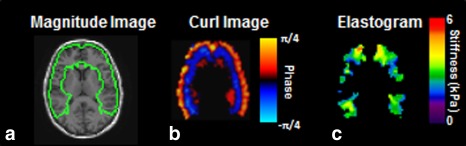
Summary of the regional MRE pipeline. On the left is the magnitude image from the MRE data with the frontal and temporal lobes ROI outlined in green (a). The center image is the ROI specific wave image with the phase scale (b). The ROI‐specific elastogram with stiffness scale is displayed on the right (c).
To create the regions of interest (ROIs) and a brain mask, we utilized a T 1‐weighted inversion recovery spoiled gradient echo (IR‐SPGR) sequence with the following parameters: sagittal orientation; frequency encoding in the superior–inferior direction; TR/TE = 6.3/2.8 msec; flip angle = 11°; TI = 400 msec; FOV = 27 cm; 256 × 256 acquisition matrix; BW = 31.25 kHz; 1.75× parallel imaging acceleration in the anterior–posterior direction; and 200 1.2‐mm slice locations. These images were segmented and registered to the MRE data with ROIs for brain regions defined so as to exclude voxels with significant partial volume of cerebrospinal fluid (CSF). A lobar atlas in a standard template space was warped to each of the individual subject's IR‐SPGR T 1‐weighted image using a unified segmentation algorithm implemented in SPM5.14
Stiffness was calculated in nine ROIs: global (whole brain excluding cerebellum), frontal lobes, occipital lobes, parietal lobes, temporal lobes, deep gray matter / white matter (GM/WM; insula, deep gray nuclei and white matter tracts), cerebellum, sensory/motor strip (pre‐ and postcentral gyri), and a composite region labeled FT (frontal and temporal lobes excluding the pre‐ and postcentral gyri). For each region, the wave images were first masked with the ROI, which was the intersection of the atlas region and the brain mask (Fig. 1). Finally, a stiffness map was calculated by direct inversion of the Helmholtz equation that models shear wave motion in a homogeneous, linear, viscoelastic material. Stiffness was calculated as the median from the ROI after excluding one voxel from the surface of the region mask to eliminate edge‐related bias. Adaptive derivative calculations were used in the inversion to ensure that only information from within an ROI was used to calculate its stiffness.
Statistical Analysis
The Wilcoxon rank sum test was used for pairwise comparisons of the groups to determine if they were significantly different from one another (P < 0.05 considered significant).
Results
Group‐wise difference in global stiffness demonstrated decreased brain stiffness in bvFTD (2.59 kPa) compared with NC (2.77 kPa) (P = 0.007). Typical regional differences observed between an NC and a bvFTD patient can be seen in Fig. 2, with the most prominent changes being in the frontal lobes (P = 0.001) and the temporal lobes (P = 0.005). Stiffness differences did not reach statistical significance in the parietal or occipital lobes or the pre‐ and postcentral gyri. Based on these results, a summary ROI composed of the frontal and temporal lobes but excluding the sensorimotor areas was generated, which obtains complete separation between the two groups as seen in a boxplot of these data (Fig. 3). A summary of all the mean median stiffness values calculated for each region and the corresponding P‐values between NC and bvFTD patients is shown in Table 1.
Figure 2.
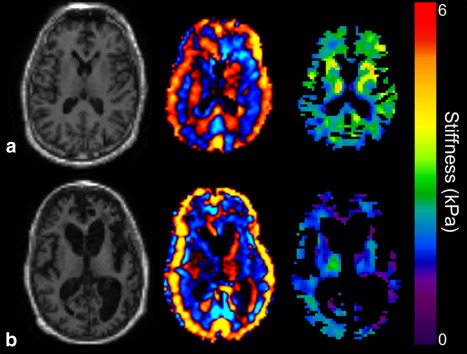
Results of MRE from a normal control (a) and a monozygotic twin (b) with a mutation in the gene encoding progranulin demonstrating expected brain atrophy in the bvFTD subject (magnitude image on the left). The wave image (center) and elastogram (left) show decreased brain stiffness in the frontal lobes and the temporal lobes in this bvFTD subject.
Figure 3.
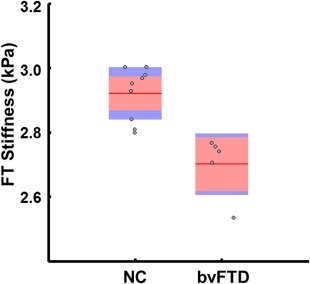
Boxplot of brain stiffness in the frontal/temporal lobes of bvFTD patients compared to NC. The bvFTD patients have decreased brain stiffness in these regions compared to the controls. The red line demarcates the group mean with the pink box spanning the 95% confidence interval and the blue box spanning 1 standard deviation. Jittered gray circles display individual subject values. NC: normal controls; bvFTD: behavioral variant frontotemporal dementia.
Table 1.
Mean Median Stiffness on Each Brain Volume for Normal Controls and bvFTD Patients
| Region | Stiffness (kPa) ± SD | P‐value | |
|---|---|---|---|
| NC | bvFTD | P < 0.05* | |
| Cerebrum | 2.76 ± 0.08 | 2.59 ± 0.17 | 0.0073 |
| Frontal lobes | 2.95 ± 0.10 | 2.70 ± 0.12 | 0.0010* |
| Occipital lobes | 2.92 ± 0.09 | 2.86 ± 0.28 | 0.4174 |
| Parietal lobes | 2.70 ± 0.08 | 2.60 ± 0.25 | 0.2233 |
| Temporal lobes | 3.00 ± 0.13 | 2.73 ± 0.20 | 0.0052* |
| Deep gray matter & white matter | 3.12 ± 0.33 | 2.91 ± 0.34 | 0.1479 |
| Cerebellum | 2.36 ± 0.16 | 2.33 ± 0.22 | 0.8440 |
| Sensory motor | 2.99 ± 0.18 | 2.97 ± 0.30 | 0.8934 |
| Frontotemporal composite | 2.91 ± 0.09 | 2.70 ± 0.13 | 0.0007* |
bvFTD, behavioral variant frontotemporal dementia; NC, normal controls.
Discussion
FTD is a neurodegenerative disorder manifested by behavioral/personality changes and/or language changes, and is as common as AD in those whose symptoms begin prior to age 60.15 Due to the variety of clinical symptoms, FTD has recently been reclassified into the primary behavioral syndrome bvFTD 11 and three variants of primary progressive aphasia.16
The pathophysiology of FTD is based on heterogeneous protein accumulation causing atrophic changes in specific parts of the brain.17, 18 The heterogeneous pathophysiology and clinical manifestations of FTD result in overlapping signs and symptoms between FTD and other types of dementia, such as AD. This has created some diagnostic challenges in this field. Despite the lack of effective therapeutic and preventive options at this point in time, establishing an accurate diagnostic method would be beneficial for patient enrollment in clinical trials.
In this study we measured stiffness of nine different regions of the brain using MRE in patients with bvFTD and in NC, and we demonstrated that in bvFTD global stiffness of the brain was lower compared with NC. In particular, the brain stiffness was significantly decreased in the frontal and temporal lobes of bvFTD patients, which is compatible with specific patterns of macro‐ or microstructural changes of the frontal and temporal lobes in bvFTD patients, as previously reported.19, 20, 21, 22 Mendez et al 23 previously noted atrophic changes in the frontal lobe of patients with bvFTD using other neuroimaging modalities. They were also able to determine specific patterns of atrophy in different areas of the frontal lobes, which further implied the heterogeneous pathophysiology of bvFTD itself.21, 22 In future studies, more advanced MRE image acquisition and reconstruction techniques may provide improved distinction between normal and atrophic areas of the brain.
Current MRI techniques provide morphologic features of brain atrophy in bvFTD patients including atrophic changes, both lobar as well as gray and white matter, and alterations in diffusion.17, 19, 22 The temporal relation between these anatomic changes and brain softening are not known. MRE offers a potential biomarker to characterize the viscoelastic properties of the brain in bvFTD patients and may have a role in further understanding the pathophysiology of the development and progression of the disease.
Brain tissue atrophy in FTD is basically secondary to specific protein accumulation in neurons or glial cells leading to brain network disintegration.18 Although postmortem histopathologic studies showed brain tissue changes compatible with imaging findings,21 it is still unclear how early in the process of dementia it is possible to detect the atrophic changes with current imaging modalities. Hypothetically, protein deposits at early stages of disease progression can alter the tissue stiffness even prior to gliosis and cellular damage. To evaluate the rate of brain atrophy progression, Rohrer and colleagues 17 performed serial imaging which demonstrated a significantly greater rate of atrophy among FTD patients compared with normal individuals. In a similar study, Fox and colleagues 24 also reported a higher rate of atrophy in FTD compared with AD patients. Considering the strong hereditary nature of FTD and the rapid progression of this disorder, further MRE studies will provide valuable information about the mechanical properties of the brain by providing quantitative measurements after, during, and potentially prior to the onset of symptoms.17, 25, 26, 27, 28, 29
There are several limitations to this pilot study, including the small sample size of bvFTD subjects. In addition, two of the subjects are twins, which potentially reduces the statistical power of the results. The subjects were moderately advanced in the disease and it would be important to determine the stiffness changes of subjects earlier in the disease process. Finally, a longitudinal study will be necessary to determine the relation of stiffness change to disease progression and severity.
In conclusion, we report a specific pattern of brain stiffness reduction in bvFTD patients, raising the possibility of using noninvasive brain MRE as a biomarker for the diagnosis and study of bvFTD.
Acknowledgment
Contract grant sponsor: National Institutes of Health (NIH); Contract grant numbers: R01 EB001981 and AG11378.
The authors thank Debra L. Hanson, from our institution's Research and Academic Support Services office, for help in preparing the article for publication.
References
- 1. Muthupillai R, Lomas DJ, Rossman PJ, Greenleaf JF, Manduca A, Ehman RL. Magnetic resonance elastography by direct visualization of propagating acoustic shear waves. Science 1995;269:1854–1857. [DOI] [PubMed] [Google Scholar]
- 2. Kruse SA, Rose GH, Glaser KJ, et al. Magnetic resonance elastography of the brain. Neuroimage 2008;39:231–237. [DOI] [PMC free article] [PubMed] [Google Scholar]
- 3. Sack I, Beierbach B, Hamhaber U, Klatt D, Braun J. Non‐invasive measurement of brain viscoelasticity using magnetic resonance elastography. NMR Biomed 2008;21:265–271. [DOI] [PubMed] [Google Scholar]
- 4. McCracken PJ, Manduca A, Felmlee J, Ehman RL. Mechanical transient‐based magnetic resonance elastography. Magn Reson Med 2005;53:628–639. [DOI] [PubMed] [Google Scholar]
- 5. Green MA, Bilston LE, Sinkus R. In vivo brain viscoelastic properties measured by magnetic resonance elastography. NMR Biomed 2008;21:755–764. [DOI] [PubMed] [Google Scholar]
- 6. Xu L, Lin Y, Xi ZN, Shen H, Gao PY. Magnetic resonance elastography of the human brain: a preliminary study. Acta Radiol 2007;48:112–115. [DOI] [PubMed] [Google Scholar]
- 7. Streitberger KJ, Sack I, Krefting D, et al. Brain viscoelasticity alteration in chronic‐progressive multiple sclerosis. PLoS One 2012;7:e29888. [DOI] [PMC free article] [PubMed] [Google Scholar]
- 8. Murphy MC, Huston J 3rd, Jack CR Jr, et al. Decreased brain stiffness in Alzheimer's disease determined by magnetic resonance elastography. J Magn Reson Imaging 2011;34:494–498. [DOI] [PMC free article] [PubMed] [Google Scholar]
- 9. Murphy MC, Huston J 3rd, Glaser KJ, et al. Preoperative assessment of meningioma stiffness using magnetic resonance elastography. J Neurosurg 2013;118:643–648. [DOI] [PMC free article] [PubMed] [Google Scholar]
- 10. Murphy MC, Huston J 3rd, Jack CR, et al. Regional brain stiffness changes across the Alzheimer's disease spectrum. In: Proc 21st Annual Meeting ISMRM, Salt Lake City; 2013. (abstract 2878).
- 11. Rascovsky K, Hodges JR, Knopman D, et al. Sensitivity of revised diagnostic criteria for the behavioural variant of frontotemporal dementia. Brain 2011;134:2456–2477. [DOI] [PMC free article] [PubMed] [Google Scholar]
- 12. Senjem ML, Lowe V, Kemp B, et al. IC‐P3–216: Automated ROI analysis of 11C Pittsburgh Compound B images using structural magnetic resonance imaging atlases. Alzheimer Dement 2008;4:T92. [Google Scholar]
- 13. Murphy MC, Huston J 3rd, Jack CR Jr, et al. Measuring the characteristic topography of brain stiffness with magnetic resonance elastography. PLoS One 2013;8:e81668. [DOI] [PMC free article] [PubMed] [Google Scholar]
- 14. Ashburner J, Friston KJ. Unified segmentation. NeuroImage 2005;26:839–851. [DOI] [PubMed] [Google Scholar]
- 15. Knopman DS, Petersen RC, Edland SD, Cha RH, Rocca WA. The incidence of frontotemporal lobar degeneration in Rochester, Minnesota, 1990 through 1994. Neurology 2004;62:506–508. [DOI] [PubMed] [Google Scholar]
- 16. Gorno‐Tempini ML, Hillis AE, Weintraub S, et al. Classification of primary progressive aphasia and its variants. Neurology 2011;76:1006–1014. [DOI] [PMC free article] [PubMed] [Google Scholar]
- 17. Gordon E, Rohrer JD, Kim LG, et al. Measuring disease progression in frontotemporal lobar degeneration: a clinical and MRI study. Neurology 2010;74:666–673. [DOI] [PMC free article] [PubMed] [Google Scholar]
- 18. Seelaar H, Rohrer JD, Pijnenburg YA, Fox NC, van Swieten JC. Clinical, genetic and pathological heterogeneity of frontotemporal dementia: a review. J Neurol Neurosurg Psychiatry 2011;82:476–486. [DOI] [PubMed] [Google Scholar]
- 19. Agosta F, Canu E, Sarro L, Comi G, Filippi M. Neuroimaging findings in frontotemporal lobar degeneration spectrum of disorders. Cortex 2012;48:389–413. [DOI] [PubMed] [Google Scholar]
- 20. Lu PH, Mendez MF, Lee GJ, et al. Patterns of brain atrophy in clinical variants of frontotemporal lobar degeneration. Dement Geriatr Cogn Disord 2013;35:34–50. [DOI] [PMC free article] [PubMed] [Google Scholar]
- 21. Whitwell JL, Josephs KA, Rossor MN, et al. Magnetic resonance imaging signatures of tissue pathology in frontotemporal dementia. Arch Neurol 2005;62:1402–1408. [DOI] [PubMed] [Google Scholar]
- 22. Whitwell JL, Avula R, Senjem ML, et al. Gray and white matter water diffusion in the syndromic variants of frontotemporal dementia. Neurology 2010;74:1279–1287. [DOI] [PMC free article] [PubMed] [Google Scholar]
- 23. Mendez MF, Joshi A, Tassniyom K, Teng E, Shapira JS. Clinicopathologic differences among patients with behavioral variant frontotemporal dementia. Neurology 2013;80:561–568. [DOI] [PMC free article] [PubMed] [Google Scholar]
- 24. Chan D, Fox NC, Jenkins R, Scahill RI, Crum WR, Rossor MN. Rates of global and regional cerebral atrophy in AD and frontotemporal dementia. Neurology 2001;57:1756–1763. [DOI] [PubMed] [Google Scholar]
- 25. Proudfoot M, Gutowski NJ, Edbauer D, et al. Early dipeptide repeat pathology in a frontotemporal dementia kindred with C9ORF72 mutation and intellectual disability. Acta Neuropathol 2014;127:451–458. [DOI] [PubMed] [Google Scholar]
- 26. Sarno M, Bure‐Reyes A, Rosado M, Curiel R, Crocco E. A‐20A case study of frontotemporal dementia: cognitive reserve and its implications in early detection. Arch Clin Neuropsychol 2014;29:510. [Google Scholar]
- 27. Diehl J, Grimmer T, Drzezga A, Riemenschneider M, Forstl H, Kurz A. Cerebral metabolic patterns at early stages of frontotemporal dementia and semantic dementia. A PET study. Neurobiol Aging 2004;25:1051–1056. [DOI] [PubMed] [Google Scholar]
- 28. Josephs KA Jr, Whitwell JL, Weigand SD, et al. Predicting functional decline in behavioural variant frontotemporal dementia. Brain 2011;134:432–448. [DOI] [PMC free article] [PubMed] [Google Scholar]
- 29. Rombouts SA, van Swieten JC, Pijnenburg YA, Goekoop R, Barkhof F, Scheltens P. Loss of frontal fMRI activation in early frontotemporal dementia compared to early AD. Neurology 2003;60:1904–1908. [DOI] [PubMed] [Google Scholar]