Abstract
We describe common and less common diseases that can cause magnetic resonance signal abnormalities of middle cerebellar peduncles (MCP), offering a systematic approach correlating imaging findings with clinical clues and pathologic mechanisms. Myelin abnormalities, different types of edema or neurodegenerative processes, can cause areas of abnormal T2 signal, variable enhancement, and patterns of diffusivity of MCP. Pathologies such as demyelinating disorders or certain neurodegenerative entities (e.g., multiple system atrophy or fragile X-associated tremor-ataxia syndrome) appear to have predilection for MCP. Careful evaluation of concomitant imaging findings in the brain or brainstem; and focused correlation with key clinical findings such as immunosuppression for progressive multifocal leukoencephalopahty; hypertension, post-transplant status or high dose chemotherapy for posterior reversible encephalopathy; electrolyte disorders for myelinolysis or suspected toxic-drug related encephalopathy; would yield an appropriate and accurate differential diagnosis in the majority of cases.
Keywords: Middle cerebellar peduncle, Brachium pontis, Magnetic resonance imaging, Multiple sclerosis, Progressive multifocal leukoencephalopathy, Posterior reversible encephalopathy, Toxic encephalopathy
Core tip: Though a few prior reviews have described pathologic processes involving the middle cerebellar peduncles (MCP), our paper offers not only an updated approach to include diffusion tensor imaging but also important correlations of imaging findings with anatomy, pathophysiologic insights and key clinical scenarios. Overall, this concise and comprehensive review is expected to help the readers not only to improve their approach to cases with MCP involvement, but also to increase awareness and understanding of pathologic processes increasingly seen in neuroimaging such as progressive multifocal leukoencephalopahty, posterior reversible encephalopathy and toxic encephalopathies.
INTRODUCTION
Pathologic processes can have predilection for specific anatomic locations. Our purpose is to describe not only common and less common entities, but also pathologic mechanisms causing magnetic resonance (MR) signal abnormalities of middle cerebellar peduncles (MCP). We provide a systematic approach narrowing differential diagnosis to help radiologists and clinicians.
ANATOMY AND CLINICAL CORRELATION
The MCP are the main afferent pathway to the cerebellum. MCP are composed by white matter fibers originated from the contralateral pontine nuclei (Figure 1). The pontine nuclei are intermediary gray matter scattered in the basis pons and part of the cortico-ponto-cerebellar pathway (closed loop communication between the cerebellum and pre-central /prefrontal cortex that control not only the action of motor tasks but also planning and initiation of movements)[1]. The cerebellum has a high ratio of afferent/efferent pathways (40:1); with the small superior cerebellar peduncles (SCP) as the only efferent fibers, connecting the dentate nuclei to the cortex through the dentate-rubro-thalamic tracts (Figure 1C). In general, the cerebellar pathways decussate twice, one at the level of the pons (crossing pontine fibers) and other at the level of the inferior colliculi in the tegmentum (decussation of the SCP). Thus, clinical signs (e.g., limb ataxia) are ipsilateral to MCP lesion. Difficulty walking (cerebellar ataxia), difficulty speaking (scanning speech) and in some cases vertigo and facial weakness are common clinical manifestation of MCP lesion.
Figure 1.

Anatomy of the middle cerebellar peduncles. A: Diagram shows the pontine crossing fibers (PCF) (red and pink long arrows) originating from the contralateral pontine nuclei and conforming the middle cerebellar peduncles (MCP) (only afferent fibers constitute MCP); B and C: Diffusion tensor imaging (DTI) tractography after seed ROIs placed in the bilateral MCP. Note the representation of the PCF (red on B). Here, we can envision the origin of well described signs on conventional T2 sequences such as the “hot cross bun sign” or “trident sign” where there is involvement of the PCF or central pons and sparing of the corticospinal tracts (CST) and tegmentum. Sagittal DTI (C) including the main efferent pathway (purple ascending fibers, arrow) through the pontine tegmentum and superior cerebellar peduncles which constitutes part of the dentate-rubro-thalamic tract. (DTI was acquired on a GE-3T Magnet, b = 0 and 1000 s/mm2 with 25 directions; Brain Lab Software was used to fuse T2-WI with DTI acquisition; and tractography was performed using a tensor deflection algorithm). ROIs: Regions of interest.
INSIGHTS INTO PATHOLOGIC MECHANISMS
It is not surprising that demyelinating processes affect the MCP, composed of axons, oligodendrocytes and scattered glial cells. Demyelination can occur in the setting of immune-related entities such as MS or acute disseminated encephalomyelitis (ADEM), and is usually accompanied by perivascular inflammatory infiltrates (with areas of enhancement on MRI in some cases) (Figure 2). Demyelination can also occur secondary to infectious processes such as progressive multifocal leukoencephalopathy (PML) (Figures 3 and 4) or metabolic abnormalities such as osmotic demyelination syndrome (ODS) (Figure 5), usually not accompanied by inflammatory changes (enhancement is not a characteristic feature on MR imaging). Vasogenic edema due to dys-regulation of small arteries can also cause increased T2 signal in the MCP, as is the case in posterior reversible encephalopathy (PRES) (Figure 6). However, the vascular dys-regulation and leaking edema might also be due to toxic states such as cyclosporine-related encephalopathy. Cytotoxic edema is characteristic of ischemia/infarction, a rare event in the MCP (Figure 7). Intra-myelinic edema appears to be the cause of areas of abnormal white matter signal in different entities. The edema can predominate between the myelin sheaths (potential extracellular space) or result from swelling of the oligodendrocytes, myelin sheaths or axons (intracellular compartment)[2]. This type of edema might or might not be reversible and is the main pathologic mechanism in some toxic or myelinolytic states (Figure 8). White matter vacuolization/spongyform degeneration causes abnormal T2 signal in other toxic states (e.g., chronic heroin inhalation). Damage to the axons (due to loss of antegrade or retrograde input) with subsequent myelin breakdown and end-stage gliosis/volume loss is the mechanism for wallerian degeneration (WD) (Figure 9). Myelin breakdown and white matter damage in leukodystrophies (LD) is caused by biochemical defects that interfere with myelin formation, maintenance, turnover, and catabolism (known as dysmyelination), leading to increased T2 signal and in some cases abnormal enhancement (e.g., adrenoleukodystrophy) (Figure 10). Neurodegenerative processes affecting MCP have distinct mechanisms; in general, there is preferential loss of Purkinje cells, or gray matter nuclei in the brain stem in diseases such as multiple system atrophy (MSA-C, cerebellar variant), fragile X-associated tremor-ataxia syndrome (FXTAS) or some spino-cerebellar ataxias, leading to axonal loss and degeneration of the associated MCP fibers (Figure 11). Neoplastic processes are unusual in the MCP, though lymphoma or glial neoplasms can also involve them. Rare infectious or inflammatory pathologies, such as Lyme disease, Listeria rhombencephalitis, Whipple disease, neurosarcoid, vasculitis (e.g., Bechet's), and the recently described CLIPPERS (chronic lymphocytic inflammation with pontine perivascular enhancement responsive to steroids) might also extend to MCP with variable imaging findings (usually enhancement accompany areas of increased T2 signal). Rarely, vascular malformations (Figure 12) can involve the MCP, in which case the recognition of their typical features is not challenging (“pop-corn” appearance for a cavernoma, or prominent flow voids for arteriovenous malformations).
Figure 2.
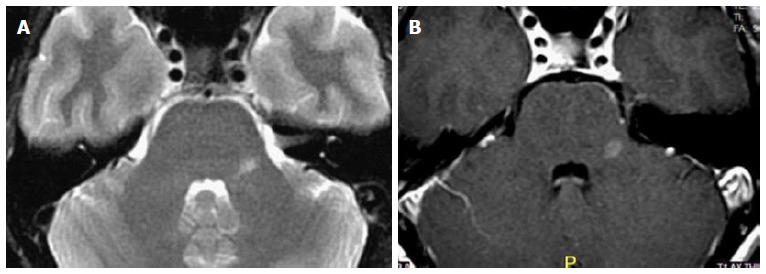
Multiple sclerosis. A 40-year-old female with 2 mo history of left facial pain/numbness and difficulty talking (scanning speech). Axial T2 (A) and axial post-contrast MR (B) images show isolated lesion in the left MCP. Due to suspicion for demyelinating disease MRI of the spine and CSF analysis was recommended. Additional lesion found in the thoracic cord (not shown) and CSF led to the diagnosis of MS. MCP: Middle cerebellar peduncles; CSF: Cerebrospinal fluid; MRI: Magnetic resonance imaging; MS: Multiple sclerosis.
Figure 3.
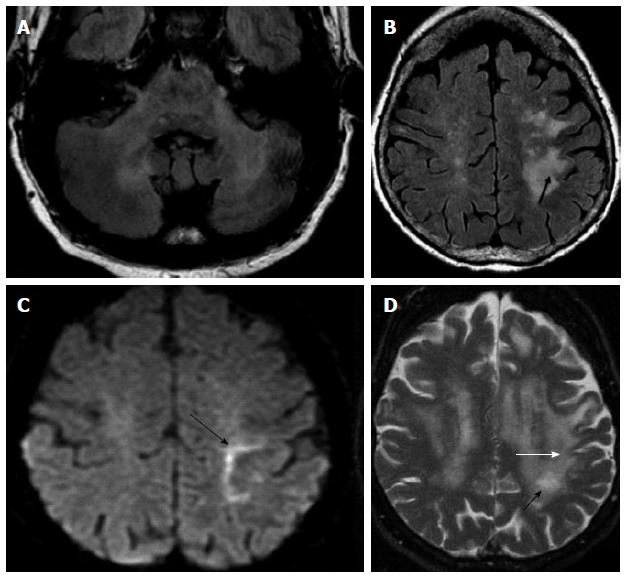
Progressive multifocal leucoencephalopathy. HIV patient with + JC virus on PCR-CSF. Bilateral involvement of MCP on axial FLAIR (A); with no enhancement (not shown); Axial FLAIR (B) and axial DWI (C) images show asymmetric confluent areas of increased signal in the subcortical WM with involvement of the u-fibers (arrow) and linear “edge” on DWI (arrow on C) consistent with advancing demyelinated edge; D: Three months f/u images better depict involvement of u-fibers (white arrow) as well as progression of WM disease with formation of small central cavitation/micro cyst, characteristic of PML (black arrow). PML: Progressive multifocal leucoencephalopathy; MCP: Middle cerebellar peduncles; CSF: Cerebrospinal fluid; DWI: Diffusion weighted-imaging; PCR: Polymerase chain reaction; HIV: Human immunodeficiency virus.
Figure 4.

Immune reconstitution inflammatory syndrome and progressive multifocal leukoencephalopathy. HIV + JC virus, irregular antiretroviral therapy, with confusion and right sided weakness. Axial FLAIR (A) and axial post contrast (B) show abnormal signal in the bilateral MCP, greater on the right with associated enhancement; Axial post contrast (C) 2 mo after treatment with steroids and antiretroviral therapy show significant improvement of abnormal enhancement. IRIS might or might not be associated with an infectious process, in this case the abnormal enhancement in a patient with positive JC virus lead to the suspicious of a superimposed neoplastic process (lymphoma), other fungal or bacterial infection. Ultimately, the response to steroid gives the diagnosis of IRIS. IRIS: Immune reconstitution inflammatory syndrome; MCP: Middle cerebellar peduncles; HIV: Human immunodeficiency virus.
Figure 5.
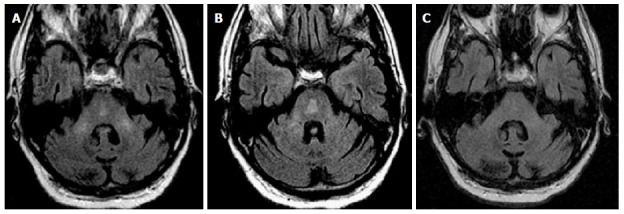
Osmotic demyelination syndrome. History of ethanol abuse and rapid correction of hyponatremia. A and B: Axial FLAIR images at two different levels of the pons show abnormal signal in the bilateral MCP as well as abnormal signal in the central pons with subtle “trident” appearance; C: Three months f/u demonstrate resolution of abnormal signal in the MCP and pons. ODS characteristically involve the central pons with sparing of the corticospinal tract, peripheral pons and tegmentum. In some acute cases, restricted diffusion is possible, differing from ischemic insult, which extends to the periphery of the pons with sparing of the midline (see Figure 9B). ODS: Osmotic demyelination syndrome; MCP: Middle cerebellar peduncles.
Figure 6.
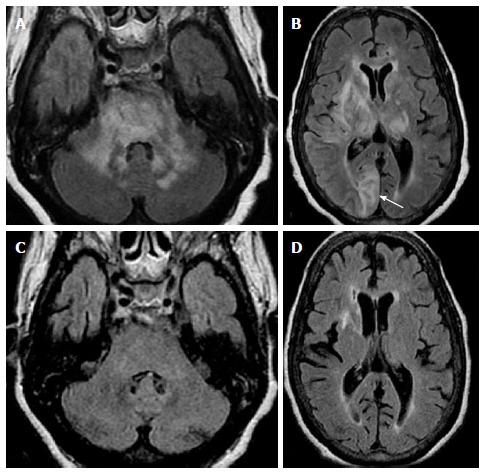
Posterior reversible encephalopathy. A and B: Axial FLAIR images in an hypertense encephalopathic patient show symmetric bilateral areas of abnormal signal in the MCP and pons. Concomitant involvement of supratentorial subcortical white matter in a “vasogenic type pattern” as well as cortical involvement (arrow on B) was noted; C and D: Three months f/u after control of hypertensive crisis show almost complete resolution of abnormal signal in MCP, pons and supratentorial regions to include the basal ganglia/thalami. Given the asymmetric distribution of supratentorial lesions, PML could be included in the differential. However, cortical involvement is not characteristic for PML. This case could be considered “atypical PRES” and proved by resolution of abnormal white matter disease (compare with Figure 3 where no resolution is noted). PRES: Posterior reversible encephalopathy; MCP: Middle cerebellar peduncles; PML: Progressive multifocal leucoencephalopathy.
Figure 7.
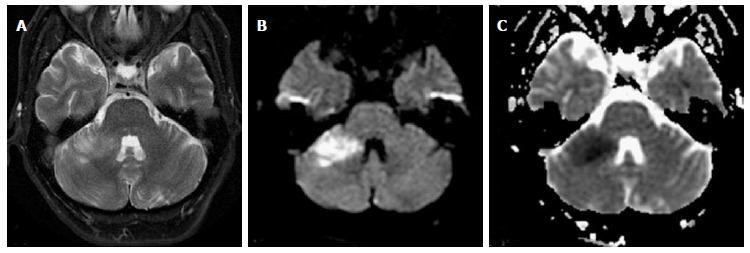
Anterior inferior cerebellar artery infarct. Patient with acute cerebellar ataxia and right-sided weakness. Axial T2 (A), DWI (B) and ADC maps (C) show well-defined area of high T2 signal and restricted diffusion consistent with ischemia. DWI: Diffusion weighted-imaging.
Figure 8.
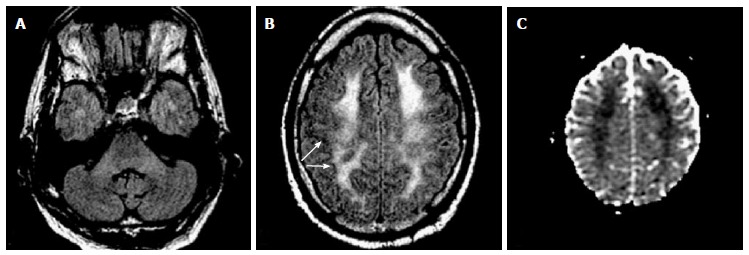
Acute heroin induced leukoencephalopathy (“chasing the dragon”). Twenty-year-old patient found down, history of recent heroin inhalation. A: Axial FLAIR shows subtle increased signal of MCP; Axial FLAIR (B) and ADC maps (C) show concomitant diffuse and confluent increased white matter signal and restricted diffusion with overall sparing of the subcortical u-fibers (arrows on B) and cortex. Though difficult to differentiate from hypoxic-ischemic event, the cortical sparing is more common in toxic leukoencephalopathies. Restricted diffusion has been described not only in the acute stage of toxic heroin inhalation, but in other hypoxic-toxic-metabolic states and could represent acute intramyelinic or excitotoxic edema, in some cases reversible. Evolution could lead to a chronic “chasing the dragon”, spongiform leukoencephalopathy, where the posterior white matter, pons and MCP are typically involved. MCP: Middle cerebellar peduncles.
Figure 9.
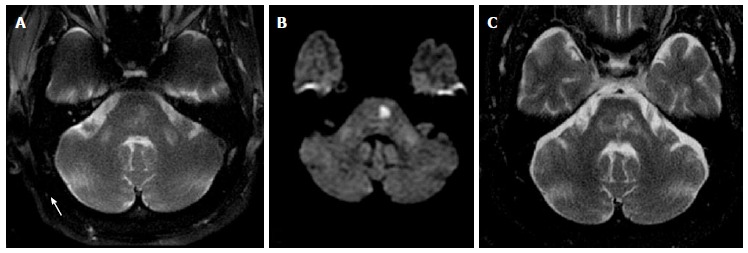
Wallerian degeneration of middle cerebellar peduncles. Axial T2 (A) and DWI (B) images show symmetric areas of abnormal signal in bilateral MCP as well as focal area of restricted diffusion in the left pons (note the characteristic spare of the midline due to occlusion of para-median branches of basilar artery); Axial T2 (C), 3 years f/u, shows evolution of lacunar infarction in the pons with resolution of abnormal signal in the right MCP and persistent abnormal signal and development of volume loss in the left MCP. Findings are consistent with WD of the MCP, with “acute” early changes in the bilateral MCP and subsequent left greater than right involvement on follow up (ipsilateral to infarct). WD: Wallerian degeneration; MCP: Middle cerebellar peduncles.
Figure 10.
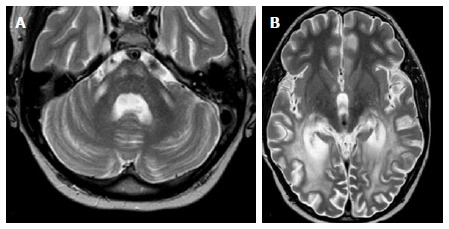
Adrenoleukodystrophy. A: Axial T2 image shows symmetric increased T2 signal in the MCP and bilateral corticospinal tracts; B: Axial T2 show concomitant symmetric and confluent white matter abnormal signal in bilateral occipito-parietal regions, typical for ADL. Note the preservation of subcortical u-fibers. Images courtesy of Dr. Lily Wang. ADL: Adrenoleukodystrophy; MCP: Middle cerebellar peduncles.
Figure 11.

Multiple system atrophy C type and fragile-X associated tremor-ataxia syndrome. Axial T2 (A) in a patient with MSA-C show typical atrophy of the pons and MCP with degeneration of the pontine crossing fibers (“hot cross bun” sign, black arrow). There is also associated increased T2 signal of the MCP bilaterally. Axial T2 (B) and diffusion tensor imaging (DTI) tractography (C) in a patient with FXTAS show cerebellar volume loss and associated increased T2 signal and volume loss of MCP. Due to decreased fractional anisotropy (white arrows on C) there is lack of fibers in the areas of abnormal T2 signal. (DTI acquisition technique similar than Figure 1, please see figure for details). Image (B) courtesy of Dr. Andrew Duker. FXTAS: Fragile-X associated tremor-ataxia syndrome; MSA-C: Multiple system atrophy C type; MCP: Middle cerebellar peduncles.
Figure 12.
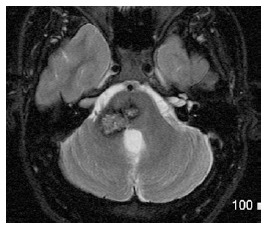
Cavernoma of middle cerebellar peduncle. Axial T2-WI shows contiguous lesions involving the pons and right MCP, with a typical mixed speckled hyper-intense and hypo-intense center and peripheral halo of hypo-intensity due to chronic hemosiderin deposition. MCP: Middle cerebellar peduncles.
PATHOLOGIC ENTITIES AND IMAGING FINDINGS
Demyelination
Cerebellar symptoms and signs are commonly seen in 50%-80% of multiple sclerosis (MS) patients. On conventional MRI, reported frequency of brainstem lesions and cerebellar lesions is 68% and 49%-88% respectively[3].
Multifocal areas of demyelination, some times areas of cavitation characterize progressive multifocal leucoencephalopathy (PML), with scanty if any inflammatory-lymphocytic infiltrates. Posterior fossa involvement of JC virus (PML) has been reported in 58% of cases[4], when present there is MCP involvement in 64%-100% of cases[5]. There is increased recognition of the common involvement of posterior fossa by PML, with reported cases of isolated/restricted posterior fossa compromise[6,7]. PML usually progresses relentlessly over a few months, resulting in increasing neurologic impairment, dementia, and eventually death. Treatment of the cause of the underlying immunosuppression can lead to remission of PML. However, white matter sequelae are seen in most cases[8] (Figure 3). White matter lesions on PML should not enhance; if so, an infectious process, inflammatory reaction or neoplastic process should be considered.
Reconstitution of the immune system (e.g., in the treatment of AIDS with highly active antiretroviral therapy) occasionally causes a paradoxical inflammatory response in the CNS, also known as IRIS (immune reconstitution inflammatory syndrome). This response might or might not be associated with an infectious agent, as in the case of PML-IRIS (Figure 4). Enhancement is present in these cases.
Vascular/toxic
Involvement of the brainstem by posterior reversible encephalopathy (PRES) has been reported in 18% of cases[9]. Isolated involvement of the brainstem or basal ganglia (no cortical or subcortical edema) can be seen in 4% of cases (central variant of PRES)[10]. In fact, there is increased awareness of “atypical distribution patterns” of PRES; thus, involvement involvement of the brainstem and MCP can actually be more common than expected (Figure 6)[11].
Toxic/metabolic
ODS is a metabolic induced demyelination characteristically involving the central pons secondary to rapid correction of hyponatremia (other disorders of the serum electrolyte such as hypernatremia could also cause it). The mechanism of demyelination is poorly understood. On imaging, there is usually preservation of the periphery of the pons and typically preservation of the corticospinal tracts (“trident sign”) (Figure 5).
Toxic/drug induced involvement of the MCP has been reported after heroin inhalation (“chasing the dragon”). The initial stage is characterized by diffuse leukoencephalopathy, presumably caused by excitotoxicity and in some cases difficult to distinguish from hypoxic-ischemic injury (though cortical involvement is also expected in the latter, potentially a characteristic to differentiate them) (Figure 8). This stage can be reversible or lead to a chronic form or spongiform leukoencephalopathy (typically involve the posterior brain white matter, midbrain and bilateral MCP)[12]. Other toxic-drug-induced abnormalities, such as toluene or methotrexate toxicity, involving the cerebellum and MCP have also been reported[13-15].
Preferential neuronal loss/volume loss of the putamen and caudate characterizes Wilson’s disease, in some cases with late spongiform white matter changes[8]. In the midbrain, abnormal signal in the tegmentum lead to the well described “panda sign”. Early work by King et al[16] described 32% of cases with MCP involvement. It appears that signal changes on T2 are less conspicuous in long-standing disease[16] and present in early or “active” forms of the disease; in some cases with concomitant restricted diffusion[17]. In our experience involvement of the MCP by Wilson’s is not a common finding.
Vascular/ischemic
MCP is supplied by the anterior inferior cerebellar artery (AICA) and in lesser degree by the superior cerebellar artery. Isolated AICA infarction (thromboembolic or secondary to severe atherosclerotic disease of basilar artery and branches) is an uncommon event. When it occurs, characteristic restricted diffusion is seen in the involved cerebellar peduncle (Figure 7).
WD in the MCP can occur in the setting of pontine ischemia or hemorrhage (Figure 9). Increased T2 signal caused by gliosis would correspond to the third of four stages in the evolution of WD, as described by Kuhn et al[18]. This stage should occur 10-14 wk after axonal injury/loss of antegrade input. Interestedly, increased signal on diffusion weighted-imaging (DWI) in the cortico-spinal tract (CST) have been reported in approximately 20% of cases of MCA/ACA infarcts as early as 72 h[19]. Similarly, restricted diffusion in the CST has been reported at 48 h after MCA ischemia in the pediatric population[20] and in the bilateral MCP at 3-4 wk after acute pontine insult[21-24]. In all cases the changes are attributed to early WD. Certainly, they represent different phases in the development of WD and should not be misinterpreted as ischemic insults.
Degenerative
MSA is a sporadic neurodegenerative disorder characterized clinically by any combination of parkinsonian, autonomic, cerebellar or pyramidal signs. The abundant presence of glial cytoplasmic inclusions in all clinical subtypes of MSA led to the recognition that Shy-Drager syndrome, striatonigral degeneration, and sporadic olivopontocerebellar atrophy are one disease characterized by neuronal multisystem degeneration with unique oligodendroglial inclusion pathology[25].
Preferential neuronal loss of the cerebellum, pons and olivary nucleus with subsequent MCP degeneration characterizes the MSA-C subtype (where cerebellar ataxia is the main motor feature)[8]. Abnormal T2 signal of MCP has been reported in 43% of cases of MSA-C[26]. Concomitant volume loss is the rule (Figure 11A)[27].
FXTAS is a genetic disorder with overexpression of the fragile-X mental retardation 1 gene (FMR1); it is most common in males and associated with progressive ataxia as the individual age. Though there are abnormal inclusions in the neurons and cortical atrophy, there is predominant loss of Purkinje cells with cerebellar axonal degeneration[8,28]. Interestedly, in some series, as much as 82% of cases demonstrated increased T2 signal in the MCP (Figure 11B) (called as the “MCP sign”, which as we described here, is not an specific sign)[28].
LD
LD are inherited metabolic disorders in which biochemical defects interfere with myelin formation. Usually, LD are associated with peroxisomal (e.g., adrenoleukodystrophy) or lysosomal defects (e.g., metachromatic LD). LD can affect the MCP. However, there is concomitant, usually symmetric involvement of the supratentorial white matter, with sparing of subcortical u-fibers (Figure 10). Few LD, such as Canavan’s or Pelizaeus-Merzbacher disase, compromise the subcortical u-fibers[8].
Infectious
ADEM or rhombencephalitis can affect MCP. In most cases, the cause of ADEM or rhombencephalitis is not known; however an association with recent systemic infectious process or vaccination is described. Most common associated virus is varicella, mumps, measles, rubella or rotavirus. Rarely, bacterial infections such as Lyme disease, Listeria or Whipple can affect the posterior fossa and compromise the MCP[29,30].
DWI AND DIFFUSION TENSOR IMAGING
As discussed, other conditions besides ischemic/cytotoxic edema can cause restriction diffusion (e.g., intra-myelinic edema) (Figure 8). Some acute toxic states can show white matter restricted diffusion[31,32]. In fact, the signal changes in these conditions could be reversible[32]. Early WD and early stages of metabolic diseases such as Wilson’s disease can also be associated with areas of restricted diffusion[17,20,21,33]. Overall, the mechanism of restricted diffusion in the “non-ischemic” cases is debatable. In addition to the mentioned intra-myelinic edema; acute white matter vacuolization or other types of excitotoxic edema could be postulated.
The use of diffusion tensor imaging (DTI) for prediction of neurologic deficits or for differential diagnosis is in continuous research. Fractional anisotropy (FA) measurements by DTI have proved involvement of the cerebellar peduncles by MS (even in the absence of T2 signal changes). Decreased FA in the MCP of MS patients as compared with controls is also correlated with motor deficits[34]. Decreased FA early in the course of WD appears to predict neurologic deficits[35]. DTI in the MCP has also been used to differentiate neurodegenerative diseases such as MSA-C from other cerebellar degenerative ataxias or Parkinson-like syndromes (Figure 11C)[36].
OTHER ADVANCED IMAGING TECHNIQUES
MR spectroscopy (MRS) evaluates the biochemical signature in normal and abnormal brain parenchyma. Multiple metabolites to include N-acetyl-aspartate (NAA - marker of neuronal tissue), choline (Cho - membrane turnover), myo-Inositol (glial tissue), lipids (necrosis) and lactate (hypoxia) are altered in different pathologic processes. Very few studies of MRS in the MCP have assessed changes in neurodegenerative diseases, particularly MSA-C[37]. They demonstrated decreased NAA in correlation with known decreased of neuronal/axonal tissue. In demyelinating processes, in addition to decreased NAA, an increase in Cho can also be demonstrated particularly in cases of acute demyelination (usually attributed to active myelin breakdown or increased macrophages in acute demyelinating plaques)[7,38,39]. In other pathophysiologic processes, such as ischemia, an increase in lactate might be expected[38,40].
MR perfusion is expecting to be altered in different pathologic processes involving the MCP. MR Perfusion, in conjunction with MRS and particularly DWI, is an important indicator of hypoxia, cell density and necrosis. Decreased perfusion on SPECT imaging has been demonstrated in MSA-C including the cerebellum and peduncles[41-43]. Demyelinating or ischemic processes usually show decreased perfusion as compared with other pathologic processes such as tumors[40,44,45].
Clinical clues
Given the improvement in the management of chronic infectious (e.g., HIV) or immune-mediated diseases (e.g., rituximab on MS or rheumatoid arthritis patients), patients in chronic immune-suppression states are not uncommon. In these populations, JC virus infection/reactivation (PML) should be high in the differential when confronting abnormal MCP signal. A post-transplant patient have also a particular risk for PRES and in less degree ODS. Other known associations for PRES includes not only hypertension but also high dose chemotherapy. Concomitant or recent history of fever should raise suspicion for infectious or post infectious process (ADEM or rombencephalitis). In the pediatric population, a leukodystrophy should be excluded. In a young encephalopathic patient, high suspicion for toxic/illicit drug use is warranted. Other toxic leukoencephalopathies, such as cyclosporine or methrotexate, should also be correlated clinically. After exclusion of relative common acquired causes of ataxia such as alcohol/anti-epileptic drugs (where cerebellar vermian atrophy predominates rather than MCP involvement), a progressive ataxic syndrome should raise suspicion for a degenerative process such as MSA-C or FXTAS (where areas of increased T2 signal in the MCP are common).
Imaging clues
As previously discussed, the involvement of the MCP or posterior fossa can be isolated (Figure 2). However, usually there is concomitant involvement of the pons or supratentorial white matter. The distribution and characteristic of the concomitant involvement can help in the differential. There is usually involvement of subcortical u-fibers in demyelinating diseases, particularly PML. To the contrary, the subcortical u-fibers are spared in other leukoencephalopathies such as toxic/metabolic entities or most LD[8]. Additionally, the involvement is usually symmetric in these cases. Vasogenic edema pattern with not only involvement of the subcortical white matter but also the adjacent cortex should rise suspicion for PRES. Restricted diffusion is characteristic of an acute ischemic process, however it can be the result of early WD, the acute phase of ODS or toxic leukoenchephalopathies. In these cases, restricted diffusion is usually bilateral. Volume loss characterizes not only neurodegenerative disorders such as MSA-C and FXTAS, but also the late stage of WD.
CONCLUSION
Pathologic entities such as demyelinating disorders and certain neurodegenerative diseases have predilection for the MCP. When approaching abnormal T2 signal in the MCP, entities such as MS, PML, PRES, and certain toxic/metabolic or neurodegenerative states should be entertained. Careful evaluation of concomitant imaging findings described, in conjunction with focused correlation with key clinical findings discussed; would yield an appropriate and accurate differential diagnosis in the majority of cases.
ACKWNOLEDGEMENTS
The authors would like to thanks Dr. Angelo Rutty, Perea Hospital - Puerto Rico, for his wonderful contribution with the anatomic drawing presented in Figure 1. Previously presented exhibit at the Annual Meeting of the American Society of Neuroradiology, Chicago, 2015.
Footnotes
Conflict-of-interest statement: The authors declare no source of funding or conflict of interest pertinent to this submitted manuscript.
Open-Access: This article is an open-access article which was selected by an in-house editor and fully peer-reviewed by external reviewers. It is distributed in accordance with the Creative Commons Attribution Non Commercial (CC BY-NC 4.0) license, which permits others to distribute, remix, adapt, build upon this work non-commercially, and license their derivative works on different terms, provided the original work is properly cited and the use is non-commercial. See: http://creativecommons.org/licenses/by-nc/4.0/
Peer-review started: July 24, 2015
First decision: August 25, 2015
Article in press: October 27, 2015
P- Reviewer: Li YZ, Shen J, Sijens PE S- Editor: Ji FF L- Editor: A E- Editor: Wu HL
References
- 1.Ramnani N. The primate cortico-cerebellar system: anatomy and function. Nat Rev Neurosci. 2006;7:511–522. doi: 10.1038/nrn1953. [DOI] [PubMed] [Google Scholar]
- 2.Moritani T, Smoker WR, Sato Y, Numaguchi Y, Westesson PL. Diffusion-weighted imaging of acute excitotoxic brain injury. AJNR Am J Neuroradiol. 2005;26:216–228. [PMC free article] [PubMed] [Google Scholar]
- 3.Ormerod IE, Miller DH, McDonald WI, du Boulay EP, Rudge P, Kendall BE, Moseley IF, Johnson G, Tofts PS, Halliday AM. The role of NMR imaging in the assessment of multiple sclerosis and isolated neurological lesions. A quantitative study. Brain. 1987;110(Pt 6):1579–1616. doi: 10.1093/brain/110.6.1579. [DOI] [PubMed] [Google Scholar]
- 4.Post MJ, Yiannoutsos C, Simpson D, Booss J, Clifford DB, Cohen B, McArthur JC, Hall CD. Progressive multifocal leukoencephalopathy in AIDS: are there any MR findings useful to patient management and predictive of patient survival? AIDS Clinical Trials Group, 243 Team. AJNR Am J Neuroradiol. 1999;20:1896–1906. [PMC free article] [PubMed] [Google Scholar]
- 5.Bag AK, Curé JK, Chapman PR, Roberson GH, Shah R. JC virus infection of the brain. AJNR Am J Neuroradiol. 2010;31:1564–1576. doi: 10.3174/ajnr.A2035. [DOI] [PMC free article] [PubMed] [Google Scholar]
- 6.Gonçalves FG, Lamb L, Del Carpio-O’Donovan R. Progressive multifocal leukoencephalopathy restricted to the posterior fossa in a patient with systemic lupus erythematosus. Braz J Infect Dis. 2011;15:609–612. [PubMed] [Google Scholar]
- 7.Horger M, Beschorner R, Beck R, Nägele T, Schulze M, Ernemann U, Heckl S. Common and uncommon imaging findings in progressive multifocal leukoencephalopathy (PML) with differential diagnostic considerations. Clin Neurol Neurosurg. 2012;114:1123–1130. doi: 10.1016/j.clineuro.2012.06.018. [DOI] [PubMed] [Google Scholar]
- 8.Ellison D, Love S, Chimelli L, Harding BN, Lowe J, Vinters HV. Neuropathology: A Reference Text of CNS Pathology (2nd edition) MOSBY: Elsevier Ltd; 2004. p. 879. [Google Scholar]
- 9.Bartynski WS, Boardman JF. Distinct imaging patterns and lesion distribution in posterior reversible encephalopathy syndrome. AJNR Am J Neuroradiol. 2007;28:1320–1327. doi: 10.3174/ajnr.A0549. [DOI] [PMC free article] [PubMed] [Google Scholar]
- 10.McKinney AM, Jagadeesan BD, Truwit CL. Central-variant posterior reversible encephalopathy syndrome: brainstem or basal ganglia involvement lacking cortical or subcortical cerebral edema. AJR Am J Roentgenol. 2013;201:631–638. doi: 10.2214/AJR.12.9677. [DOI] [PubMed] [Google Scholar]
- 11.McKinney AM, Short J, Truwit CL, McKinney ZJ, Kozak OS, SantaCruz KS, Teksam M. Posterior reversible encephalopathy syndrome: incidence of atypical regions of involvement and imaging findings. AJR Am J Roentgenol. 2007;189:904–912. doi: 10.2214/AJR.07.2024. [DOI] [PubMed] [Google Scholar]
- 12.Geibprasert S, Gallucci M, Krings T. Addictive illegal drugs: structural neuroimaging. AJNR Am J Neuroradiol. 2010;31:803–808. doi: 10.3174/ajnr.A1811. [DOI] [PMC free article] [PubMed] [Google Scholar]
- 13.Okamoto K, Tokiguchi S, Furusawa T, Ishikawa K, Quardery AF, Shinbo S, Sasai K. MR features of diseases involving bilateral middle cerebellar peduncles. AJNR Am J Neuroradiol. 2003;24:1946–1954. [PMC free article] [PubMed] [Google Scholar]
- 14.Uchino A, Sawada A, Takase Y, Kudo S. Symmetrical lesions of the middle cerebellar peduncle: MR imaging and differential diagnosis. Magn Reson Med Sci. 2004;3:133–140. doi: 10.2463/mrms.3.133. [DOI] [PubMed] [Google Scholar]
- 15.Arora A, Neema M, Stankiewicz J, Guss ZD, Guss JG, Prockop L, Bakshi R. Neuroimaging of toxic and metabolic disorders. Semin Neurol. 2008;28:495–510. doi: 10.1055/s-0028-1083684. [DOI] [PubMed] [Google Scholar]
- 16.King AD, Walshe JM, Kendall BE, Chinn RJ, Paley MN, Wilkinson ID, Halligan S, Hall-Craggs MA. Cranial MR imaging in Wilson’s disease. AJR Am J Roentgenol. 1996;167:1579–1584. doi: 10.2214/ajr.167.6.8956601. [DOI] [PubMed] [Google Scholar]
- 17.Sener RN. Diffusion MR imaging changes associated with Wilson disease. AJNR Am J Neuroradiol. 2003;24:965–967. [PMC free article] [PubMed] [Google Scholar]
- 18.Kuhn MJ, Johnson KA, Davis KR. Wallerian degeneration: evaluation with MR imaging. Radiology. 1988;168:199–202. doi: 10.1148/radiology.168.1.3380957. [DOI] [PubMed] [Google Scholar]
- 19.Castillo M, Mukherji SK. Early abnormalities related to postinfarction Wallerian degeneration: evaluation with MR diffusion-weighted imaging. J Comput Assist Tomogr. 1999;23:1004–1007. doi: 10.1097/00004728-199911000-00034. [DOI] [PubMed] [Google Scholar]
- 20.Bekiesinska-Figatowska M, Duczkowski M, Madzik J, Uliasz M, Zawadka A, Baszczeska J. Diffusion-Weighted Imaging of the Early Phase of Wallerian Degeneration. A Report of two Pediatric Cases and Literature Review. Neuroradiol J. 2012;25:657–664. doi: 10.1177/197140091202500603. [DOI] [PubMed] [Google Scholar]
- 21.De Simone T, Regna-Gladin C, Carriero MR, Farina L, Savoiardo M. Wallerian degeneration of the pontocerebellar fibers. AJNR Am J Neuroradiol. 2005;26:1062–1065. [PMC free article] [PubMed] [Google Scholar]
- 22.Fitzek C, Fitzek S, Stoeter P. Bilateral Wallerian degeneration of the medial cerebellar peduncles after ponto-mesencephalic infarction. Eur J Radiol. 2004;49:198–203. doi: 10.1016/S0720-048X(03)00132-3. [DOI] [PubMed] [Google Scholar]
- 23.Küker W, Schmidt F, Heckl S, Nägele T, Herrlinger U. Bilateral Wallerian degeneration of the middle cerebellar peduncles due to paramedian pontine infarction: MRI findings. Neuroradiology. 2004;46:896–899. doi: 10.1007/s00234-004-1287-y. [DOI] [PubMed] [Google Scholar]
- 24.Gala F, Becker A, Pfeiffer M, Kollias S. Acute Wallerian degeneration of middle cerebellar peduncles due to basilar artery thrombosis. Indian J Radiol Imaging. 2013;23:164–167. doi: 10.4103/0971-3026.116581. [DOI] [PMC free article] [PubMed] [Google Scholar]
- 25.Wenning GK, Colosimo C, Geser F, Poewe W. Multiple system atrophy. Lancet Neurol. 2004;3:93–103. doi: 10.1016/s1474-4422(03)00662-8. [DOI] [PubMed] [Google Scholar]
- 26.Naka H, Ohshita T, Murata Y, Imon Y, Mimori Y, Nakamura S. Characteristic MRI findings in multiple system atrophy: comparison of the three subtypes. Neuroradiology. 2002;44:204–209. doi: 10.1007/s00234-001-0713-7. [DOI] [PubMed] [Google Scholar]
- 27.Nicoletti G, Fera F, Condino F, Auteri W, Gallo O, Pugliese P, Arabia G, Morgante L, Barone P, Zappia M, et al. MR imaging of middle cerebellar peduncle width: differentiation of multiple system atrophy from Parkinson disease. Radiology. 2006;239:825–830. doi: 10.1148/radiol.2393050459. [DOI] [PubMed] [Google Scholar]
- 28.Tassone F, Berry-Kravis EM. Fragile X-associated tremor ataxia syndrome (FXTAS) New York, London: Springer; 2010. [Google Scholar]
- 29.Guzmán-De-Villoria JA, Ferreiro-Argüelles C, Fernández-García P. Differential diagnosis of T2 hyperintense brainstem lesions: Part 2. Diffuse lesions. Semin Ultrasound CT MR. 2010;31:260–274. doi: 10.1053/j.sult.2010.03.002. [DOI] [PubMed] [Google Scholar]
- 30.Black DF, Aksamit AJ, Morris JM. MR imaging of central nervous system Whipple disease: a 15-year review. AJNR Am J Neuroradiol. 2010;31:1493–1497. doi: 10.3174/ajnr.A2089. [DOI] [PMC free article] [PubMed] [Google Scholar]
- 31.Rollins N, Winick N, Bash R, Booth T. Acute methotrexate neurotoxicity: findings on diffusion-weighted imaging and correlation with clinical outcome. AJNR Am J Neuroradiol. 2004;25:1688–1695. [PMC free article] [PubMed] [Google Scholar]
- 32.McKinney AM, Kieffer SA, Paylor RT, SantaCruz KS, Kendi A, Lucato L. Acute toxic leukoencephalopathy: potential for reversibility clinically and on MRI with diffusion-weighted and FLAIR imaging. AJR Am J Roentgenol. 2009;193:192–206. doi: 10.2214/AJR.08.1176. [DOI] [PubMed] [Google Scholar]
- 33.Musson R, Romanowski C. Restricted diffusion in Wallerian degeneration of the middle cerebellar peduncles following pontine infarction. Pol J Radiol. 2010;75:38–43. [PMC free article] [PubMed] [Google Scholar]
- 34.Anderson VM, Wheeler-Kingshott CA, Abdel-Aziz K, Miller DH, Toosy A, Thompson AJ, Ciccarelli O. A comprehensive assessment of cerebellar damage in multiple sclerosis using diffusion tractography and volumetric analysis. Mult Scler. 2011;17:1079–1087. doi: 10.1177/1352458511403528. [DOI] [PMC free article] [PubMed] [Google Scholar]
- 35.Liang Z, Zeng J, Zhang C, Liu S, Ling X, Wang F, Ling L, Hou Q, Xing S, Pei Z. Progression of pathological changes in the middle cerebellar peduncle by diffusion tensor imaging correlates with lesser motor gains after pontine infarction. Neurorehabil Neural Repair. 2009;23:692–698. doi: 10.1177/1545968308331142. [DOI] [PubMed] [Google Scholar]
- 36.Prakash N, Hageman N, Hua X, Toga AW, Perlman SL, Salamon N. Patterns of fractional anisotropy changes in white matter of cerebellar peduncles distinguish spinocerebellar ataxia-1 from multiple system atrophy and other ataxia syndromes. Neuroimage. 2009;47 Suppl 2:T72–T81. doi: 10.1016/j.neuroimage.2009.05.013. [DOI] [PubMed] [Google Scholar]
- 37.Terakawa H, Abe K, Watanabe Y, Nakamura M, Fujita N, Hirabuki N, Yanagihara T. Proton magnetic resonance spectroscopy (1H MRS) in patients with sporadic cerebellar degeneration. J Neuroimaging. 1999;9:72–77. doi: 10.1111/jon19999272. [DOI] [PubMed] [Google Scholar]
- 38.Oz G, Alger JR, Barker PB, Bartha R, Bizzi A, Boesch C, Bolan PJ, Brindle KM, Cudalbu C, Dinçer A, et al. Clinical proton MR spectroscopy in central nervous system disorders. Radiology. 2014;270:658–679. doi: 10.1148/radiol.13130531. [DOI] [PMC free article] [PubMed] [Google Scholar]
- 39.Shah R, Bag AK, Chapman PR, Curé JK. Imaging manifestations of progressive multifocal leukoencephalopathy. Clin Radiol. 2010;65:431–439. doi: 10.1016/j.crad.2010.03.001. [DOI] [PubMed] [Google Scholar]
- 40.Chu WJ, Mason GF, Pan JW, Hetherington HP, Liu HG, San Pedro EC, Mountz JM. Regional cerebral blood flow and magnetic resonance spectroscopic imaging findings in diaschisis from stroke. Stroke. 2002;33:1243–1248. doi: 10.1161/01.str.0000015240.75199.be. [DOI] [PubMed] [Google Scholar]
- 41.Miyoshi F, Kanasaki Y, Shinohara Y, Fujii S, Kaminou T, Tanabe Y, Ogawa T. Significance of combined use of MRI and perfusion SPECT for evaluation of multiple system atrophy, cerebellar type. Acta Radiol. 2015:Aug 7; Epub ahead of print. doi: 10.1177/0284185115598810. [DOI] [PubMed] [Google Scholar]
- 42.Cilia R, Marotta G, Benti R, Pezzoli G, Antonini A. Brain SPECT imaging in multiple system atrophy. J Neural Transm (Vienna) 2005;112:1635–1645. doi: 10.1007/s00702-005-0382-5. [DOI] [PubMed] [Google Scholar]
- 43.Matsuda H, Imabayashi E, Kuji I, Seto A, Ito K, Kikuta D, Yamada M, Shimano Y, Sato N. Evaluation of both perfusion and atrophy in multiple system atrophy of the cerebellar type using brain SPECT alone. BMC Med Imaging. 2010;10:17. doi: 10.1186/1471-2342-10-17. [DOI] [PMC free article] [PubMed] [Google Scholar]
- 44.Song SS. Advanced imaging in acute ischemic stroke. Semin Neurol. 2013;33:436–440. doi: 10.1055/s-0033-1364214. [DOI] [PubMed] [Google Scholar]
- 45.Fayed-Miguel N, Morales-Ramos H, Modrego-Pardo PJ. Magnetic resonance imaging with spectroscopy, perfusion and cerebral diffusion in the diagnosis of brain tumours. Rev Neurol. 2006;42:735–742. [PubMed] [Google Scholar]


