

Background: Cytokines are administered to patients to eliminate viral infections and cancer yet often have side effects.
Results: Antibody fragments have been designed that recognize cytokine-receptor complexes and change cytokine biological activity profiles.
Conclusion: Designed proteins enhance interferon antiviral activity without inducing antiproliferative signaling pathways.
Significance: Antibody fragments targeted to cytokine-receptor complexes provide new tools for manipulating cytokine signaling.
Keywords: cell signaling, conformational change, cytokine, interferon, phage display, protein structure, receptor, receptor
Abstract
Exogenous cytokine therapy can induce systemic toxicity, which might be prevented by activating endogenously produced cytokines in local cell niches. Here we developed antibody-based activators of cytokine signaling (AcCS), which recognize cytokines only when they are bound to their cell surface receptors. AcCS were developed for type I interferons (IFNs), which induce cellular activities by binding to cell surface receptors IFNAR1 and IFNAR2. As a potential alternative to exogenous IFN therapy, AcCS were shown to potentiate the biological activities of natural IFNs by ∼100-fold. Biochemical and structural characterization demonstrates that the AcCS stabilize the IFN-IFNAR2 binary complex by recognizing an IFN-induced conformational change in IFNAR2. Using IFN mutants that disrupt IFNAR1 binding, AcCS were able to enhance IFN antiviral potency without activating antiproliferative responses. This suggests AcCS can be used to manipulate cytokine signaling for basic science and possibly for therapeutic applications.
Introduction
Cytokines are α-helical proteins that regulate cell growth as well as innate and adaptive immunity (1, 2). Thus, cytokine-based therapies have the potential to stimulate immune responses that eliminate pathogens and/or enhance antitumor activities. However, bolus injections of exogenous cytokines often induce toxicity in patients at concentrations below that required for therapeutic efficacy (3, 4). Toxicity is thought to be associated with systemic activation of signaling pathways in cell types that are not associated with the infection or malignancy. Cytokine toxicity and/or poor efficacy is also associated with the activation of multiple cellular responses in the same cells (e.g. cytokine pleiotropy) (5). To address these problems, cytokines have been engineered to target specific cell types and exhibit different biological activity profiles that could improve their therapeutic profiles (6–9). In contrast to these efforts, we sought to identify alternative proteins, called activators of cytokine signaling (AcCS),3 which change the activity profiles of natural, or mutant cytokines, by changing the stability of the cytokine/receptor signaling complex.
It has been established that cytokines control cellular activation through a two-step engagement of cell surface receptors (10). In the first step cytokine binds to a high affinity receptor chain. In the second step, the binary complex interacts with a low affinity receptor chain resulting in the formation of a ternary cytokine-receptor signaling complex that initiates cellular responses. We hypothesized AcCS, which selectively bind to cytokine-receptor cell surface complexes (e.g. cytokine high affinity receptor chain, cytokine low affinity receptor chain, or the ternary cytokine-receptor signaling complex (TCRSC)), would enhance the biological potency of natural cytokines by increasing the stability of the TCRSC. Due to their ability to bind complex epitopes and escape host immune detection, humanized antibody scaffolds were chosen to develop as AcCS. Notably, AcCS are mechanistically and functional distinct from agonistic antibodies, which function as cytokine mimics with similar toxicity issues of normal cytokines (11, 12). In contrast, AcCS are designed to increase cytokine activity only when cytokines are bound to their cell surface receptors. Thus, AcCS may provide a novel strategy to enhance the bioactivity of endogenously produced cytokines.
AcCS were developed for the type I interferons (IFN), which are already used in the clinic (13, 14). The IFN family consists of 16 IFN subtypes that adopt conserved α-helical bundle topologies and bind to the same cell surface receptors, IFNAR1 and IFNAR2 (15, 16). In the interferon system, IFNAR2 is the high affinity receptor chain that exhibits ∼nm affinity for IFNs. The IFN low affinity receptor chain, IFNAR1, binds to the IFN-IFNAR2 binary complex with ∼μm affinity to form the ternary IFN-IFNAR1-IFNAR2 signaling complex (17). IFN-induced ternary complex formation activates the JAK/STAT pathway and the expression interferon-stimulated genes (ISGs), which ultimately give rise to antiviral (AV), antiproliferative (AP), and immunomodulatory cellular responses (18). Based on these activities, IFNs have been administered as therapies for viral infections and cancer (IFNα2) as well as for multiple sclerosis (IFNβ) (14, 19). However, IFNs often exhibit dose-limiting toxicities and limited therapeutic effectiveness, which is disappointing considering the observation of potent tumor rejection and elimination of viral infections in animal models (20–22).
The development of AcCS was initiated by the continued need to identify improved ways of activating IFN signaling without the associated toxicity problems. Toward this goal, we report the identification of two AcCS (AcCS1 and AcCS4) that potentiate IFNα2a biological activity by ∼100-fold. Biochemical and structural analysis demonstrate activation occurs due to the ability of the AcCS to stabilize the IFN-IFNAR2 binary complex. Based on this mechanism of action, we explored AcCS-mediated activation of IFNα2a mutants with disrupted IFNAR1 binding sites. In the presence of these mutants, AcCS selectively activated IFN AV activity without inducing AP activity. Thus, AcCS provide a novel strategy for modulating IFN activity that can be extended to other cytokine systems.
Experimental Procedures
Phage Display and Protein Expression
IFNα2a and IFNARs fused to an engineered immunoglobulin heterodimer (IFNAR1-FChk, IFNAR2-FChk, and IFNAR1-IFNAR2-FChk) were prepared as previously described (23). IFNα2a mutants were made by quick change mutagenesis and expressed as previously described for IFNα2a (24). For phage display, proteins were immobilized at 2 μg/ml on Nunc Maxisorp microplates. All wells were blocked with a 0.5% bovine serum albumin (BSA) in phosphate-buffered saline (PBS), pH 7.4, for 1 h at room temperature with shaking. Purified phage library F (diversity of ∼1 × 10¹⁰ at a concentration of 1013 virus particles in PBS, 0.2% BSA, 0.5% Tween (PBT)) was incubated sequentially with each immobilized protein for 30 min to remove phage with affinity for the individual components of the complex. The depleted library was subsequently incubated for 2 h with the assembled IFNα2a·IFNAR1-IFNAR2-FChk ternary complex. After incubation, the plate was washed eight times with PBT buffer. Remaining phages were eluted from the plate with 100 mm HCl. The pH of the eluted phage solution was neutralized with 1 m Tris, pH 11.0, and used to infect XL1-blue Escherichia coli cells (Stratagene). Phages were either amplified for use in further selections or plated as individual clone colonies for isolation, sequencing, and manipulation of clone DNA as previously described (25).
ELISA
Proteins (2 μg/ml) used in the negative and positive selections were immobilized by passive adsorption by incubation overnight at 4 °C in Maxisorp microplates (Nunc). The wells were subsequently blocked with 100 μl of PBS containing 0.2% BSA (PB) for 1 h at room temperature before washing four times with PBS containing 0.05% Tween (PT). The IFNα2a·IFNAR1-IFNAR2-FChk ternary complex was assembled in wells containing immobilized IFNAR1-IFNAR2-FChk heterodimer by incubating with 20 μg/ml IFNα2a in PBT for 30 min. Wells were then exposed to PBT-diluted phage (1013 phage/ml) for 15 min, washed 8× with PT buffer, and then incubated with a 1:5000 dilution of anti-M13 antibody (HRP conjugate, GE healthcare) for 30 min at room temperature. Microplates were washed again 6× with PT buffer and 2× with PBS and then developed by the addition of TMB substrate (KPL, Gaithersburg, MD). After 5 min, the reaction was stopped by the addition of an equal volume of 1 m H3PO4. The plates were read at 450 nm in a Biotek Powerwave XS microtiter plate reader (Biotek, Winooski, VT). Clones were considered specific for the interferon ternary complex if the signal was >10-fold above the individual proteins of the complex.
Subcloning, Expression, and Purification of AcCS
AcCS-phage DNA was converted into expression plasmids by Kunkel mutagenesis of a C-terminal residue Cys (TGC) to a stop codon (TAG) to encode a soluble AcCS molecule containing a C-terminal FLAG tag. Plasmids were sequence-verified, transformed into 55244 cells by standard KCM methodology, and cultured overnight in 2× yeast extract tryptone media containing carbenicillian. The overnight culture was gently pelleted and transferred to phosphate-depleted carbon-rich alkaline phosphatase (CRAP) media for expression overnight at 16 °C. Cells were harvested by centrifugation and immediately lysed in buffer containing 50 mm Tris, 150 mm NaCl, 1%Triton X-100, 1 mg/ml lysozyme, 2 mm MgCl2, and 10 units of benzonase for 4 h at 4 °C. Lysates were cleared by centrifugation at 16,000 × g for 30 min and applied to rProtein A-Sepharose columns (GE Healthcare), washed with 10 column volumes of 50 mm Tris, 150 mm NaCl, pH 7.4, and eluted with 100 mm phosphoric acid buffer, pH 2.5 (50 mm NaH2PO4, 140 mm NaCl, 100 mm H3PO4), into neutralizing buffer consisting of 1 m Tris, pH 8.0. Eluted AcCS were characterized for purity, concentration, and activity by SDS-PAGE gels, absorbance at 280 nm, and ELISA, respectively.
Surface Plasmon Resonance (SPR)
SPR experiments were performed on a Biacore T200 (GE Healthcare) at 25 °C using a running buffer consisting of 10 mm Hepes, 150 mm NaCl, 0.0125% P20 (GE Healthcare), and 125 μg/ml BSA. IFNAR-FChk fusion proteins were captured onto CM-5 sensor chips using an anti-murine FC antibody (GE Healthcare). All SPR experiments were performed in duplicate and double referenced (e.g. sensorgram data were subtracted from a control surface and from a buffer blank injection) as previously described (26). The control surface for all experiments consisted of the capture antibody. Approximately 100–250 relative units (RU) of the various IFNAR-FChks were captured onto the chip surfaces. Fresh IFNAR-FChks were coupled to the surfaces for each injection. The surfaces were regenerated between injections with a 3-min injection of 10 mm glycine, pH 1.7. The buffer flow rate for all studies was 50 μl/min. Sensorgrams were globally fit to a 1:1 binding model using Biacore T-200 evaluation software version 1.0.
Antiviral Assays
Antiviral activity was performed using Huh-7 cells infected with vesicular stomatitis virus (VSV). Huh-7 cells were maintained at 37 °C in DMEM/F-12 media (Mediatech Inc.) supplemented with 10% fetal calf serum. Cultures before the 11th passage were trypsinized and plated at 2 × 10⁵ cells/ml (100 μl/well) in 96-well flat bottom microplates followed by overnight incubation at 37 °C. The following day, AcCS/IFNs were added to the cells, and 24 h later the cells were challenged with VSV at a dilution, which induced 100% cell death in non-treated cells. Viable cells were quantified 40 h after viral challenge using Cell Titer 96 Aqueous One solution Cell Proliferation Assay kit (Promega) based on manufacturer's instructions. Dose-response curves were analyzed using PRISM (Graphpad Inc.) to derive EC50 values.
Antiproliferative Assays
Anti-proliferative assays were performed using Huh-7 cells. Cells were maintained at 37 °C in DMEM/F-12 media (Mediatech Inc.) supplemented with 10% fetal calf serum. Cultures of 5 × 10⁴ cells/ml (100 μl/well) were added to 96-well plates and incubated overnight at 37 °C followed by the addition of IFNs/AcCS. After a 72-h incubation, cell proliferation was measured using CellTiter-Glo (Promega) using the manufacturer's instructions. Dose-response curves were analyzed using PRISM (Graphpad Inc.) to derive EC50 values.
Reporter Cell Assays
HL116 cells (27) were plated in white opaque plates (Corning) at 4 × 10⁵ cells/ml (100 μl/well) and incubated overnight at 37 °C. Dilutions of IFNs or AcCS were prepared in the DMEM-glutamax, HAT (Sigma), 10% FBS media and incubated for 20 min at 37 °C followed by incubation with cells for 5 h at 37 °C. After incubation, the plates were moved to room temperature for 10 min followed by the addition of 50 μl of luciferase assay reagent (Steady-Glo, Promega) to each well. Luminescence was measured on a Biotek Synergy 2 plate reader and analyzed with PRISM software using a four parameter fit with variable slope (Graphpad Inc.).
Western Blot Analysis
Levels of tyrosine-phosphorylated STAT1 were measured by Western blot. After treatment cells were washed 3 times with Dulbecco's PBS containing 100 μm sodium orthovanadate (Na3VO4). Whole-cell lysates were prepared and quantified using the bicinchoninic acid assay (BCA, Pierce). Lysates were resolved by electrophoresis on 12% SDS-PAGE gels and then transferred to polyvinylidene difluoride membranes. The levels of tyrosine-phosphorylated STAT1 and unphosphorylated STAT1 were visualized by enhanced chemiluminescence (ECL) with anti-phospho-Y701-STAT1 (catalog #9167) and anti-STAT1 (catalog #9175) antibodies (Cell Signaling), respectively. An anti-β-actin antibody (Sigma, catalog #A5316) was used to confirm equivalent sample loading.
Quantitative Real-time PCR (qPCR)
HuS-E/2 cells were grown as previously described (28). RNA isolation was performed using the RNeasy micro kit (Qiagen). RNA was quantified using the Quant-iT RiboGreen RNA Assay kit (Life Technologies) and a Rotor-Gene Instrument (Qiagen). Reverse transcription was performed from 500 ng of RNA in 10-μl volumes using the Primescript RT master mix (Takara/Clontech) according to the manufacturer's instructions. qPCR was performed with a Roto-Gene using Premix EX Taq 2x master mix (Clontech/Takara) and Taqman MGB primer and probe sets (Life Technologies). All qPCR experiments were performed using duplex reactions, two replicates for each sample, containing the primer/probe of the gene of interest and a VIC-labeled GAPDH probe (primer pair-limited) as a housekeeping control. Relative gene expression was reported using the ΔΔCT method with the untreated control as reference (29).
Single Particle Electron Microscopy
AcCS-IFNα2a-IFNAR2 complexes were formed by incubating the three proteins at a 1:1:1 molar ratio for 1 h followed purification by gel filtration chromatography. AcCS-IFNα2a-IFNAR2 complexes (3 μl) were applied to glow discharged holey carbon grids and stained with 2% uranyl formate. The grids were characterized using a Tecnai T12 microscope operating at 120 kV. EM tilt pair images (0° and −55°) were recorded at 52,000− magnification on a Tietz 4k × 4k CCD camera with an electron dose of 40 e−/Å2 using the LEGINON software system (30).
Electron microscopy (EM) images were processed using the APPION pipeline (31). Image defocus was estimated using ctffind3 (32) and applied by phase flipping the whole micrograph in EMAN (33). Particles were selected automatically using dog/tilt Picker from 330 (AcCS1 complex) and 371 (AcCS4 complex) images (34). Phase-flipped, 2× binned stacks of particles (AcCS1 = 105,598 particles, AcCS4 = 72,637 particles) were created using a box size of 56 pixels and a pixel size of 4.1Å. After stack creation, the particles were classified using two-dimensional maximum likelihood procedures (35) implemented in XMIPP (36). Class averages that did not show all components of the complex, exhibited high noise, aggregation, or extensive distortion were rejected, resulting in stacks of 10,196 AcCS1 complex particles and 16,564 AcCS4 complex particles. Initial three-dimensional constructions were obtained using random conical tilt procedures from a subset of two-dimensional class averages, correlated in the 0° and −55° tilt images, using the back projection and refinement procedures in APPION. A 50 Å low band pass filter was applied to the resulting random conical tilt volumes of each complex and used as initial three-dimensional reference models for refinement. Particle stacks were subjected to one additional round of two-dimensional classification in RELION-1.3 (37). A total of 6,303 AcCS1 complex particles and 9,787 AcCS4 particles were used in gold-standard refinement and Fourier shell correlation (FSC) calculations in RELION-1.3 (37).
Modeling
IFNα2a-IFNAR2 (38) and Herceptin (39) crystal structures were fit into the EM reconstructions using Chimera (40). AcCS1 and AcCS4 complimentarity determining regions were modeled using Rosetta antibody 3.0 (41) implemented on the Rosie server. The top 10 low energy FV models from Rosetta were superimposed onto the Herceptin structures that had been previously positioned into the AcCS1 and AcCS4 EM reconstructions. The lowest energy FV models that exhibited essentially no steric clashes with IFNα2a-IFNAR2 were chosen from the 10 possible models. For both AcCS1 and AcCS4 models, the FV with the second lowest overall energy was chosen. No additional model refinement was performed on the docked FV models. All figures were generated using PyMOL (42).
Results
Identification of AcCS
Prior studies have demonstrated IFN biological activity is controlled by the affinity of IFNs for the individual IFNARs as well as the overall stability of the ternary signaling complex (43). Based on these data, we sought to obtain humanized antibody scaffolds that would specifically bind to the IFN-IFNAR1-IFNAR2 signaling complex and potentiate IFN activity. This was accomplished by screening a human synthetic antibody library (44) for antibody scaffolds that would bind to an IFNα2/IFNAR1-IFNAR2-FChk ternary signaling complex mimic but not to any component individually (Fig. 1A). Scaffolds with affinity for the monomeric components of the complex were removed from the naïve library by negative selections, performed against IFNα2a, the soluble receptors (IFNAR1-FCkh, IFNAR2-FCkh, IFNAR1-IFNAR2-FChk), and FChk (23). The remaining antibody scaffolds were subjected to four cycles of positive selection against IFNα2a·IFNAR1-IFNAR2-FChk. Use of an IFNAR1-IFNAR2-FChk heterodimer (23) in the selection process was essential as it produced a highly stable ternary complex, in contrast to the complexes formed with monomeric IFNAR proteins lacking the FChk domains. Following the selection procedure, the specificity of 75 antibody scaffolds were characterized by ELISA. Two scaffolds (AcCS1 and AcCS4) exhibiting the greatest affinity for the IFNα2a·IFNAR1-IFNAR2-FChk complex by ELISA (Fig. 1B) were purified for functional characterization.
FIGURE 1.

Selection strategy and biological activity of AcCS. A, schematic diagram of the selection strategy used to identify AcCS. B, specificity of AcCS for the IFNα2a·IFNAR1-IFNAR2-FChk signaling complex determined using ELISA. C, AcCS-mediated activation of IFNα2a antiviral activity. Increasing concentrations of AcCS were added to Huh-7 cells with a constant concentration of IFNα2a (+IFNα2a, 10 pm) or no IFNα2a (−IFNα2). D, AV assay performed as in C, except AcCS were either heat-inactivated (HI) or not heat-inactivated (Not-HI). E, graphical summary of IFN and IFN+AcCS EC50 values derived from AV and AP assays. For these experiments, IFNα2a concentrations were varied and assayed alone or with AcCS at a constant concentration of 200 nm. The largest differences in EC50 values, between IFNα2a and IFNα2a+AcCS4, are highlighted on the figure. Values used to prepare the graph are from Table 1.
AcCS Enhance IFNα2a Antiviral and Antiproliferative Activity
The ability of the AcCS to stimulate IFNα2a biological activity was determined by performing AV assays using VSV infection of Huh-7 cells (Fig. 1C). The addition of AcCS1 or AcCS4 to Huh-7 cells at concentrations as high as 1 μm did not protect the cells from virus-induced death (viral cytopathic effect). However, in the presence of low levels of IFNα2a, both AcCS enhanced AV activity in a concentration-dependent manner, with AcCS4 increasing IFNα2a potency to a greater extent than AcCS1. The AcCS were responsible for increasing the potency of IFNα2a, as increased potency was not observed when AcCS preparations were heat-denatured before addition to the cells (Fig. 1D).
IFNα2a induces AV and AP activity in Huh-7 cells at effective concentrations (EC50) of 29 pm and 330 pm, respectively (Table 1, Fig. 1E). To further evaluate AcCS activity, IFN dose-response curves were performed in the presence of constant concentrations of AcCS. Under these conditions, AcCS1 increased IFNα2a AV activity 6-fold, relative to IFNα2a alone, whereas AcCS4 increased IFNα2a AV activity 29-fold. Thus, the AV potency of IFNα2a+AcCS4 mixtures is greater than the activity of IFNβ in the same assay. AcCS enhanced IFNα2a AP activity (53–83-fold) to a greater extent than AV activity. In fact, both AcCS increased the AP potency of IFNα2a beyond that observed for IFNβ. In the presence of AcCS1, IFNα2a exhibited essentially identical EC50 values in the AV and AP assays, which is reflected in an AP/AV ratio of ∼1 (Table 1). Interestingly, AcCS4 increased the AV and AP potency of IFNα2a more than AcCS1 but maintained an AP/AV ratio of 4, as observed for IFNβ. Overall, these studies confirm AcCS1 and AcCS4 potently activate wild type IFNα2a biological activity, often to levels greater than observed for IFNβ.
TABLE 1.
IFNα2a and mutant biological activity (EC50) ± AcCS
Effective concentrations of IFNs were determined with or without AcCS. Experiments were performed at least three times in duplicate, and IFN EC50 (pm) values are reported as the mean and S.D. -Fold decrease in EC50 values relative to IFNα2a are shown in parentheses; AcCS concentration for all experiments was 200 nm.
| Assay-cell type | IFNα2a | +AcCS1 | +AcCS4 | IFNβ |
|---|---|---|---|---|
| AV-Huh-7 | 29 ± 2 | 5.3 ± 0.4 (5.5) | 1.0 ± 0.2 (29) | 2.0 ± 0.5 (14.5) |
| AP-Huh-7 | 330 ± 17 | 6.0 ± 0.3 (55) | 4.0 ± 0.5 (83) | 7.6 ± 0.2 (43) |
| AP/AV ratio | 11.4 | 1.1 | 4.0 | 3.8 |
| NLYY | +AcCS1 | +AcCS4 | ||
|---|---|---|---|---|
| AV-Huh-7 | 28,000 ± 5,000 | 20,000 ± 4,000 (1.4) | 300 ± 100 (93) |
AcCS Bind with High Affinity to the IFNα2a·IFNAR1-IFNAR2 Ternary Complex
To evaluate the mechanism by which AcCS induce IFNα2a biological activity, their binding affinity and specificity was quantified using SPR (Fig. 2). Consistent with the ELISA data, AcCS1 does not bind to the IFNAR1-IFNAR2-FCkh heterodimer at concentrations as high as 1 μm (Fig. 2A) but exhibits high affinity (KD = 0.21 nm) for the IFNα2a·IFNAR1-IFNAR2-FChk signaling complex mimic (Fig. 2C, Table 2). Thus, AcCS1 exhibits at least a 5000-fold greater affinity for the IFNα2a·IFNAR1-IFNAR2-FChk ternary complex than for free IFNAR receptors. In contrast to AcCS1, AcCS4 exhibited significant affinity (KD = 11.2 nm) for the IFN-free IFNAR1-IFNAR2-FChk heterodimer (Fig. 2B), which increased 7-fold (KD = 1.6 nm, Fig. 2D) for the IFNα2a·IFNAR1-IFNAR2-FChk complex. Thus, each AcCS exhibits high affinity binding and selectivity for the IFNα2a·IFNAR1-IFNAR2 signaling complex. However, AcCS4 is unique in its ability to bind to IFNARs in the absence of IFNα2a.
FIGURE 2.

AcCS exhibit increased binding affinity to the IFNα2a·IFNAR1-IFNAR2-FChk complex. SPR sensorgrams are shown for AcCS binding to IFNAR1-IFNAR2-FChk, in the absence (A and B) or presence (C and D) of IFNα2a. AcCS1 was injected over IFNAR1-IFNAR2-FChk at concentrations of 1000 nm, 200 nm, 40 nm, and 8 nm, whereas AcCS4 was injected at 200 nm, 40 nm, 8 nm, and 1.6 nm concentrations. AcCS1 or AcCS4 were injected over IFNα2a·IFNAR1-IFNAR2-FChk at concentrations of 25 nm, 5 nm, 1 nm, and 0.2 nm. Affinity constants were obtained by global fitting a 1:1 binding model (black lines) to the sensorgrams that are shown in Table 2. RU, relative units.
TABLE 2.
AcCS binding constants
Analyte corresponds to the soluble protein injected over the ligand, which is attached to the SPR chip surface.
| Analyte | Ligand | ka | kd | KD | Figurea |
|---|---|---|---|---|---|
| m−1s−1 | s−1 | nm | |||
| IFNα2a | IFNAR2-FChk | 7.0 × 10⁶ | 0.041 | 5.8 | 3B |
| AcCS1 | IFNAR1/IFNAR2-FChk | 2A | |||
| AcCS1 | IFNα2a.IFNAR1/IFNAR2-FChk | 7.0 × 10⁵ | 1.5 × 10⁻⁴ | 0.21 | 2C |
| AcCS1 + IFNα2ab | IFNAR2-FChk | 2.1 × 10⁶ | 3.1 × 10⁻⁴ | 0.15 | 3C |
| AcCS4 | IFNAR1/IFNAR2-FChk | 4.2 × 10⁶ | 0.047 | 11.2 | 2B |
| AcCS4 | IFNAR2-FChk | 1.0 × 10⁷ | 0.095 | 9.4 | 3A |
| AcCS4 | IFNα2a.IFNAR1/IFNAR2-FChk | 1.3 × 10⁶ | 0.002 | 1.6 | 2D |
| AcCS4 + IFNα2ab | IFNAR2-FChk | 2.2 × 10⁷ | 0.004 | 0.19 | 3D |
a Index of the corresponding sensorgrams used to derive the binding parameters.
b Experiment performed with constant AcCS concentrations of 50 nm with variable concentrations of IFNα2a.
AcCS Recognize the IFNα2a-IFNAR2 Complex
The receptor required for AcCS4 binding to IFNAR1-IFNAR2-FChk was identified by injecting AcCS4 over monomeric IFNAR1-FChk or IFNAR2-FChk. AcCS4 did not recognize IFNAR1-FChk but bound to IFNAR2-FChk with essentially the same affinity (KD = 9.4 nm, Fig. 3A, Table 2) observed for the AcCS4/IFNAR1-IFNAR2-FChk interaction (Fig. 2B). Thus, AcCS4 binds specifically to IFNAR2 in the absence of IFNα2a, whereas AcCS1 does not bind to IFNα2a-free IFNAR1 or IFNAR2 chains.
FIGURE 3.

AcCS bind with high affinity to the IFNα2a-IFNAR2 complex. A, sensorgrams (colored lines) of AcCS4 (50 nm, 12.5 nm, 3.125 nm, and 0.78 nm) binding to IFNAR2-FChk and model fit (black lines). An equivalent color scheme is used for all sensorgrams. B, sensorgrams of IFNα2a (20 nm, 6.6 nm, 2.2 nm, and 0.7 nm) injected over IFNAR2-FChk with associated model fit. IFNα2a concentrations used in B were then injected over IFNAR2-FChk in the presence of 50 nm constant concentration of AcCS1 (C) or AcCS4 (D). All data were collected in duplicate and fit to the binding models shown in black. Binding constants for the data are shown in Table 2.
The ability of AcCS4 to bind IFNAR2 suggested AcCS4 and/or AcCS1 may recognize the IFNα2a-IFNAR2 binary complex and not the entire IFNα2a·IFNAR1-IFNAR2 ternary complex. To evaluate this possibility, mixtures of AcCS and IFNα2a were injected over biacore chip surfaces coupled with IFNAR1-FChk or IFNAR2-FChk. Injection of AcCS+IFNα2a mixtures over IFNAR1-FChk surfaces did not result in detectable IFNα2a or AcCS binding. However, injection of AcCS1+IFNα2a or AcCS4+IFNα2a mixtures over IFNAR2-FChk resulted in the formation of high affinity AcCS-IFNα2a-IFNAR2 complexes (Fig. 3, C and D). AcCS1+IFNα2a mixtures bound to IFNAR2-FChk with a KD of 0.15 nm, which was essentially identical to the affinity of AcCS1 for the IFNα2a·IFNAR1-IFNAR2-FChk complex (Fig. 2C, Table 2). Relative to the binary IFNα2a-IFNAR2 interaction (KD = 5.8 nm; Fig. 3B), AcCS1 increased the stability of the IFNα2a-IFNAR2 complex by 39-fold.
Sensorgrams derived from AcCS4+IFNα2a mixtures were more complex due to the ability of AcCS4 and IFNα2a to independently bind to IFNAR2 (Fig. 3D). However, formation of AcCS4-IFNα2a-IFNAR2·FChk complexes could be identified with increasing IFNα2a concentrations by the observation of a very slow off-rate in the sensorgrams that were distinct from sensorgrams for IFNα2a (Fig. 3B) or AcCS4 (Fig. 3A) alone. Thus, AcCS4 is able to bind to IFNAR2 as well as stabilize the IFNα2a-IFNAR2 complex with an apparent affinity of 0.19 nm (Table 2). These data further define the distinct binding mechanisms of AcCS1 and AcCS4. Specifically, AcCS1 efficiently binds and stabilizes IFNα2a-IFNAR2 complexes once they form, whereas AcCS4 binds to IFNAR2 before IFNα2a binding yet is also able to stabilize the IFNα2a-IFNAR2 complex.
AcCS Recognize an IFNα2a-induced Conformational Change in IFNAR2
To further define the AcCS binding epitopes, structures of AcCS-IFNα2a-IFNAR2 complexes were obtained using negative stain electron microscopy (Fig. 4). The structure of AcCS1-IFNα2a-IFNAR2 Changed from FCS. (FSC½ = 16.4 Å; Figs. 4C and 3D) revealed the AcCS1 binding site is located within the IFNAR2 D1 domain where it forms putative interactions with β-strands C′ (residues Asp-51–Val-54) and F (residues Glu-84–Thr-91) (Fig. 5A). Based on the EM-derived model, prominent van der Waals contacts in the interface are made by tryptophan residues within AcCS1 complimentarity determining regions and residues on the IFNAR2 β-strand C′. In addition, IFNAR2 residues Asp-51 and Glu-84 may form an extensive hydrogen bond network with AcCS1 (Fig. 5A). To test the accuracy of this model, Asp-51 and Glu-84 were mutated to alanine (D51A, E84A, and the D51A/E84A double mutant), and AcCS1 binding affinity was evaluated (Fig. 5B). An additional mutation in IFNAR2 residue E28A, which is located on the opposite side of the AcCS1/IFNAR2 interface, was also made as a control mutation. Consistent with the EM-derived model, D51A and E84A mutants exhibited 139-fold and 35-fold reductions in AcCS1 binding affinity, respectively (Fig. 5B). No AcCS1 binding was detected to the D51A/E84A double mutant, whereas AcCS1 exhibited essentially wild type affinity for the E28A control mutation. Although the AcCS1 epitope is located within IFNAR2, AcCS1 does not bind to IFNAR2 unless it is bound to IFNα2a (Figs. 2 and 3). This suggests AcCS1 increases IFNα2a affinity by recognizing and stabilizing an IFNα2a-induced conformational change in IFNAR2. Consistent with this hypothesis, NMR studies demonstrate IFNα2a induces conformational changes in IFNAR2 residues 44–53, which includes Asp-51, that is essential for AcCS1 binding (46).
FIGURE 4.

EM analysis of AcCS-IFNα2a-IFNAR2 complexes. Gel filtration chromatograms of the AcCS1-IFNα2a-IFNAR2 (A) and AcCS4-IFNα2a-IFNAR2 (B) complexes used for EM analysis. SDS-PAGE gel inset shows starting complex (S) and fractions from the column that were pooled for analysis. Fraction 25+ corresponds to fraction 25 that was incubated with β-mercaptoethanol before the addition to the gel. Final map/model (C) and gold-standard FSC plots (D) for AcCS1-IFNAR2-IFNα2a and AcCS4-IFNAR2-IFNα2a (E and F). AcCS1 and AcCS4 are shown in yellow and green, respectively. IFNα2a is colored cyan, and IFNAR2 is in magenta.
FIGURE 5.

Validation of the AcCS1 binding site identified by EM. A, AcCS1-IFNα2a-IFNAR2 complex (light chain yellow, heavy chain green) showing the position of IFNAR2 mutants analyzed. B, sensorgrams show AcCS1 binding to IFNα2a·IFNAR1-IFNAR2(mutant)-FChk complexes, where each experiment is labeled with the mutant analyzed. Experiments were performed by injecting AcCS1 over each complex in duplicate at 20 nm, 6.67, nm and 2.22 nm concentrations. Sensorgrams (colored lines) were fit using a 1:1 binding model (black line) resulting in binding constants shown on the bottom of each sensorgram. N.D. = binding not detected.
The structure of AcCS4-IFNα2a-IFNAR2 (FSC½ = 16.4 Å, Fig. 4, E and F) revealed AcCS1 and AcCS4 share overlapping binding epitopes (Glu-51 and Glu-84) located within the IFNAR2 D1 domain (Fig. 6A). However, AcCS4 appears to form additional contacts with the IFNAR2 FG loop that are not present in the AcCS1 complex structure. These additional contacts are consistent with the ability of AcCS4, but not AcCS1, to bind to IFNAR2 in the absence of IFNα2a (Figs. 2 and 3). Because AcCS4 and AcCS1 share overlapping binding epitopes, the IFNAR2 mutants used to characterize the AcCS1-IFNα2a-IFNAR2 complex were also used to characterize the AcCS4 binding epitope (Fig. 6B). Consistent with the AcCS4-IFNα2a-IFNAR2 structural model, the IFNAR2 E84A mutant disrupted AcCS4 binding, whereas AcCS4 bound to the E28A control mutation with wild type affinity (Fig. 6). In contrast to the expectation that AcCS4 would not bind to the IFNAR2 D51A mutation, AcCS4 bound tighter to the D51A mutant than wild type IFNAR2 (Fig. 6). At this time we cannot explain the AcCS4 binding phenotype for the D51A mutation, which is located on the edge of the AcCS4/IFNAR2 interface. However, our data emphasize the energetic importance of IFNAR2 Glu-84 for AcCS4 binding, which is ∼14 Å from the IFNα2a/IFNAR2 interface and shown to undergo IFNα2-induced conformational changes upon complex formation (46). Thus, IFNα2a-induced conformational changes in IFNAR2 appear to be the mechanism by which AcCS1 and AcCS4 distinguish IFNα2a-bound IFNAR2 from IFNα2a-unbound IFNAR2.
FIGURE 6.

Validation of the AcCS4 binding site identified by EM. A, AcCS4-IFNα2a-IFNAR2 complex (yellow, light chain; green, heavy chain) showing the position of IFNAR2 mutants analyzed. B, sensorgrams show AcCS4 binding to IFNα2a·IFNAR1-IFNAR2(mutant)-FChk complexes, where each experiment is labeled with the mutant analyzed. Experiments were performed as described in Fig. 5 for AcCS1. N.D. = binding not detected.
AcCS Binding to the IFNα2a-IFNAR2 Complex Does Not Change IFNAR1 Affinity
AcCS binding to the IFNα2a-IFNAR2 complex may increase the affinity of IFNα2a for the IFNAR1 chain, which would explain how the AcCS enhance IFNα2a biological activity. To evaluate this possibility, AcCS-IFNα2a-IFNAR2 complexes were captured on SPR chips followed by the injection of soluble IFNAR1 chain over the complexes (Fig. 7). Using this assay, the affinity of IFNAR1 for the AcCS1-IFNα2a-IFNAR2 and AcCS4-IFNα2-IFNAR2 complexes was 3 μm and 3.1 μm, respectively, which is similar to previously reported affinities (KD = 3.5 μm) of the IFNα2a-IFNAR1 interaction (16, 23) These results suggest that AcCS1 and AcCS4 both enhance IFNα2a biological potency exclusively by stabilizing the IFNα2a-IFNAR2 binary complex.
FIGURE 7.

IFNAR1 binds with wild type affinity to AcCS-IFNα2a-IFNAR2 complexes. Double injection experiments used to determine IFNAR1 affinity to AcCS-IFNα2a-IFNAR2 complexes are shown on the top of each figure. First, mixtures of IFNα2a (50 nm) + AcCS (100 nm) are injected over IFNAR2-FChk surfaces. After AcCS-IFNα2a-IFNAR2-FChk complex formation, soluble IFNAR1 (0, 111.1 nm, 333.3 nm, 1000 nm, and 3000 nm) was injected over the respective surfaces. Bottom, figures show plots of equilibrium RU (RU-eq.) values versus IFNAR1 concentration, where RU-eq. corresponds to the difference in RU between the injection of IFNAR1 concentration and the zero IFNAR1 concentration (e.g. buffer blank).
AcCS Allow Decoupling of IFN Cell Potency and Gene Expression on HL116 Cells
IFNs induce complex biological responses in cells, which have been shown to depend on the stability of the IFN-IFNAR1-IFNAR2 ternary complex (16, 43). Given the ability of the AcCS to form very stable IFN-IFNAR2 complexes, we sought to determine the influence of the AcCS on IFNα2a-induced gene expression using two IFNα2a mutants (NLYY and R120E) that exhibit wild type binding affinity for IFNAR2 but reduced affinity (R120E more than NLYY) for IFNAR1 (47, 48). To measure gene expression, the activity of NLYY and R120E were characterized on HL116 cells that are stably transfected with an IFN-inducible reporter gene (27). Experiments performed with HL116 cells revealed IFNα2a mutants with weak IFNAR1 binding properties exhibit decreased potency (e.g. increased EC50 values) and reduced levels of gene expression relative to IFNα2a (Fig. 8, Table 3). The addition of AcCS to the assay enhanced IFNα2a or IFNα2a mutant EC50 values ∼2–120-fold. However, neither AcCS1 nor AcCS4 was able to increase IFN-induced gene expression levels beyond that observed in the absence of the AcCS (Fig. 8). Thus, by stabilizing the IFN/IFNAR2 interaction, AcCS can enhance IFN potency without changing gene expression levels in HL116 reporter cells.
FIGURE 8.
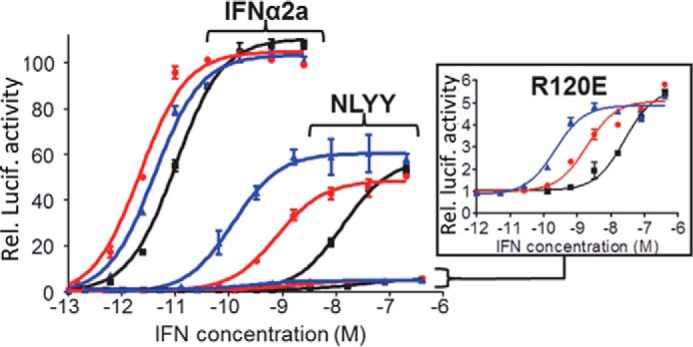
AcCS enhance IFN potency but not gene expression in HL116 reporter cells. Dose-response curves are shown for IFNs alone (black) and the IFNs in the presence of 200 nm AcCS1 (red) or 200 nm AcCS4 (blue). The specific IFN used is labeled on each figure. The y axis of the plot corresponds to relative luciferase activity (e.g. gene expression). EC50 values for each experiment are shown in Table 3.
TABLE 3.
IFN biological activity (EC50) on reporter cells ± AcCS
Shown is activity of IFNα2a and IFNα2a mutants on HL116 cells, which correspond to dose-response curves shown in Fig. 8. Experiments were performed at least three times in duplicate, and EC50 (pm) is reported as the mean and S.D. -Fold decrease in EC50, relative to IFNα2a is shown in parentheses; AcCS concentration for all experiments was 200 nm.
| IFN | IFN - EC50 | + AcCS1 | + AcCS4 |
|---|---|---|---|
| IFNα2a | 8.6 ± 0.5 | 2.1 ± 0.1 (4.1) | 3.6 ± 0.1 (2.4) |
| NLYY | 9,000 ± 1,000 | 450 ± 80 (20) | 90 ± 11 (100) |
| R120E | 30,000 ± 6,000 | 1,200 ± 300 (25) | 250 ± 30 (120) |
AcCS Potentiate the Antiviral Activity of IFN Mutants without Activating Antiproliferative Activity
Genes required for AV activity have been shown to have robust promoters that respond to weak IFN signaling, whereas promoters in genes associated with AP activity require stronger IFN induction (7). Studies on HL116 cells suggest the IFN-IFNAR2 interaction mediates IFN potency, whereas IFNAR1 regulates IFN potency and gene expression levels. If these findings are correct, AcCS should be able to enhance the AV potency of the IFNα2a mutants with disrupted IFNAR1 binding sites without activating AP activity. To test this hypothesis, the AV (Fig. 9A) and AP (Fig. 9B) activity of NLYY and R120E were determined on Huh-7 cells with and without AcCS. On Huh-7 cells, R120E was unable to induce significant antiviral activity at concentrations as high as 2 μm in the presence or absence of AcCS (Fig. 9A). In contrast, NLYY was able to almost fully protect Huh-7 cells from VSV infection at a concentration of ∼1 μm with an EC50 value of 28 nm. AcCS1 had little impact on NLYY antiviral activity. However, AcCS4 increased NLYY AV potency by 93-fold (EC50 = 300 pm), which allowed NLYY to fully protect Huh-7 cells from VSV infection at concentrations of 1.6 nm. NLYY alone or in the presence of AcCS1 or AcCS4 was unable to induce AP activity on Huh-7 cells at the highest concentrations tested (2 μm, Fig. 9B). Thus, in contrast to IFNα2a, combinations of NLYY and AcCS4 confer complete AV protection to VSV without activating Huh-7 AP activity.
FIGURE 9.
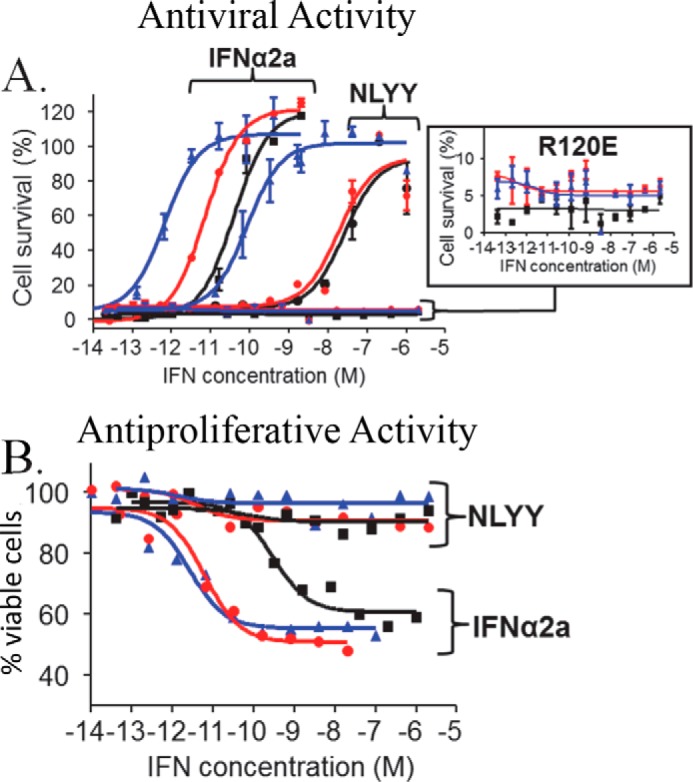
NLYY+AcCS4 treatment selectively activates AV activity on Huh-7 cells. Dose-response curves are shown for IFNs alone (black) and the IFNs in the presence of 200 nm AcCS1 (red) or 200 nm AcCS4 (blue). The specific IFN used is labeled on each figure. A, IFN AV dose-response curves performed on Huh-7 cells ± AcCS. B, IFN AP dose-response curves for IFNs or IFNs+AcCS performed on Huh-7 cells. EC50 values for each experiment are shown in Table 1.
ISG Expression Profiles with and without AcCS4
To determine how AcCS4 influences ISG expression, Huh-7 cells were treated with NLYY, IFNα2a, NLYY+AcCS4, IFNα2a+AcCS4, or AcCS4, and gene expression was measured at 4 time points (5, 10, 24, and 48 h) by qPCR (Fig. 10). At 1 nm concentrations, NLYY did not induce AV or AP activity, NLYY+AcCS4 induced full AV activity, and IFNα2a induced full AV and AP activity that was potentiated by AcCS4 (Fig. 9). Six ISGs (mxa, ifi6, isg20, irf1, cxcl11, and tnfrsf10a) were chosen for analysis because they previously were shown to respond to low concentrations of IFNs (mxa and ifi6), high concentrations of IFNs (irf1 and cxcl11), or exhibit AV (isg20) or AP (tnfrsf10a) activity (7, 49–51).
FIGURE 10.

Influence of AcCS4 on ISG expression in Huh-7 cells. A–F, Huh-7 cells were untreated (cyan) or treated with NLYY (gray), NLYY+AcCS4 (blue), IFNα2a (orange), IFNα2a+NLYY (yellow), or AcCS4 alone (green). At the time intervals of 5, 10, 24, and 48 h, ISG expression was measured by qPCR. The data are the mean ± S.E. of mRNA levels from two biological replicates that were each measured twice by qPCR. The amounts of mRNA were normalized to the untreated control cells and plotted as relative mRNA versus time. The concentration of NLYY and IFNα2a was 1 nm, and the concentration of AcCS4 was 200 nm in all experiments. G, HuS-E/2 cells, which constitutively produce IFN, were left untreated or treated with 200 nm AcCS4. Mxa gene expression was measured and reported as described for Huh-7 cells at the time intervals of 5, 10, and 24 h.
The gene expression profiles of the six ISGs (Fig. 10) mimicked the potency of the IFN treatments in the AV and AP assays (Fig. 9, Table 1). Thus, IFNα2a+AcCS4 induced the highest levels of gene expression followed by IFNα2a, NLYY+AcCS4, and NLYY. Importantly, the gene expression profiles (e.g. the level of ISG induction at each time point) of NLYY+AcCS4 are closer to IFNα2a and IFNα2a+AcCS4 treatments than NLYY alone. This suggests NLYY+AcCS4 may reach a gene expression threshold necessary for AV activity that is not reached by NLYY alone. Consistent with this hypothesis, NLYY-mediated induction of the antiviral gene isg20 is 10-fold lower than its induction by IFNα2a, whereas NLYY+AcCS4-stimulated isg20 levels are only 1.7-fold lower than in IFNα2a-treated cells (Fig. 10D).
Distinct features of the gene expression profiles may also explain why NLYY+AcCS4 treatment does not induce AP activity, whereas IFNα2a or IFNα2a+AcCS4 treatment induces AP activity (Fig. 9B). Of the 6 ISG profiles measured, the greatest difference (10-fold) in gene expression between NLYY+AcCS4 and IFNα2a treatments occurs for cxcl11 (Fig. 10E). This is important because cxcl11 gene expression levels have been shown to correlate with IFN-mediated AP activity (52). Furthermore, IFNα2a+AcCS4 treatment, which induces the greatest AP activity (Fig. 9B), increases cxcl11 levels 30-fold over NLYY+AcCS4 (Fig. 10E).
Gene expression levels of tnfrsf10a are also expected to correlate with Huh-7 AP activity (49, 51). However, IFNα2a+AcCS4, IFNα2a, and NLYY+AcCS4 induce similar levels of tnfrsf10a (Fig. 10F). Although tnfrsf10a gene induction levels are very similar in all three conditions, in NLYY+AcCS4-treated samples, tnfrsf10a mRNA levels return to baseline after 24 h (Fig. 10F). In contrast, tnfrsf10a mRNA levels remain high in IFNα2a-treated cells and are even higher with IFNα2a+AcCS4 treatment. Thus, fast decay of tnfrsf10a mRNA levels at 24/48 h post NLYY+AcCS4 treatment are correlated with the loss of AP activity, whereas slow decay of tnfrsf10a observed in IFNα2a- and IFNα2a+AcCS4-treated cells (Fig. 10F) correlates with the strength of AP activity (Fig. 9B).
AcCS4 Alters the Kinetics of IFN-induced STAT1 Phosphorylation
STAT1 phosphorylation in Huh-7 cells was evaluated by Western blotting (Fig. 11). Overall, pSTAT1 levels correlated with the potency of the IFN or IFN+AcCS4 treatment observed in the AV and AP assays (Fig. 9, Table 1). Specifically, NLYY exhibited the weakest induction of pSTAT1 (Fig. 11A), which was increased by the addition of AcCS4 (Fig. 11B). The highest levels of pSTAT1 were induced by IFNα2a and IFNα2a+AcCS4, although the differences between these two conditions were minor (Fig. 11, C and D).
FIGURE 11.
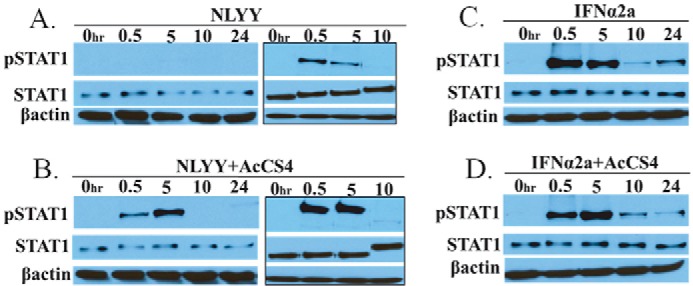
AcCS4 alters IFN-mediated STAT1 phosphorylation. Huh-7 cells were left untreated (0 h) or treated with NLLY (A), NLYY+AcCS4 (B), IFNα2a (C), or IFNα2a+AcCS4 (D). STAT1 phosphorylation was monitored at 0.5, 5, 10, and 24 h by Western blotting. All four blots were treated identically and developed for an equivalent time. To increase the sensitivity of the experiment, NLYY and NLYY+AcCS4 samples (0, 0.5, 5, and 10 h) were run again (gels with black border) and processed as in the first experiment, except the development time was increased to detect lower levels of pSTAT1. Concentrations of NLYY, IFNα2a, and AcCS4 used in the experiment were as described in Fig. 10, A–F.
IFN+AcCS4 induced pSTAT1 with different kinetics from IFNs alone. For example, IFNα2a and NLYY induced maximal pSTAT1 levels after 30 min that were slightly reduced at 5 h and then extremely weak (IFNα2a) or completely absent (NLYY) at the 10- and 24-h time points. In contrast to the IFNs alone, IFN+AcCS4 mixtures exhibited maximal pSTAT1 levels at 5 h rather than 30 min. However, despite this change, the decay of pSTAT1 appeared to occur with the same kinetics as the IFNs alone. Thus, even though AcCS4 substantially increased the level of pSTAT1 induced by NLYY at 5 h, pSTAT1 was not detected at the 10 or 24 h time points (Fig. 11, A and B). Thus, AcCS4 potentiates NLYY-induced pSTAT1 to levels similar to IFNα2a or IFNα2a+AcCS4 treatment. However, NLYY+AcCS4-induced pSTAT1 is absent 10 h post treatment, whereas pSTAT1 levels persist at 24 h with IFNα2a and IFNα2a+AcCS4 treatment.
AcCS4 Does Not Significantly Activate Cells That Produce Constitutive Levels of IFN
Many cells produce low levels of IFNs (constitutive IFN) to establish a cellular threshold for subsequent robust IFN signaling (53, 54). To determine if AcCS could activate endogenously produced IFN, AcCS4 was added to an immortalized human hepatocyte cell line (HuS-E/2 cells) that constitutively produces IFNα (28). The AcCS4-treated HuS-E/2 cells were evaluated for mxa gene expression at 5, 10, and 24 h after the addition of AcCS4 (Fig. 10G). AcCS4 induced mxa expression in HuS-E/2 cells by 28% relative to untreated cells, which did not reach statistical significance. Although this level of ISG activation might impact tonic IFN signaling (e.g. enhance activation upon the subsequent addition of IFN), AcCS4 cannot induce a robust IFN response from constitutive levels of IFN.
Discussion
Using IFNs as a model system, a method to identify AcCS that stabilize protein-protein interfaces of cytokine receptor complexes is described. Using a hybrid structural approach, we determined that AcCS1 and AcCS4 recognize an IFNα2a-induced conformational change in the IFNAR2 chain and stabilize the IFNα2a/IFNAR2 interaction. Thus, the AcCS are allosteric effectors of IFNAR2 that enhance IFNα2a biological potency to levels greater than or equal to IFNβ. The properties of the AcCS were used to optimize IFN AV potency without activating off-target AP activity. These results might be important for the further clinical development of IFNs, as reducing the pleiotropic actions of IFNs may reduce the associated toxicity. Because the method of generating AcCS is quite straight forward, it should be easily adapted to other cytokines of interest.
The key to the selection of AcCS was the ability to screen antibody scaffolds against a stable IFNα2a·IFNAR1-IFNAR2-FChk ternary complex, which reasonably mimics the cell surface signaling complex (23). Furthermore, the half-life of the IFNα2a-IFNAR2 and IFNα2a-IFNAR1 binary complexes are too fast (∼17 s or shorter) to use in the screening procedure. In contrast, IFNα2a binds to the IFNAR1-IFNAR2-FChk complex with ∼30 pm affinity and exhibits a half-life of >1 h, providing a highly stable antigen for the selections (23). Although the selections were performed against the entire IFNα2a-IFNAR1-IFNAR2 complex, the two antibody scaffolds with the highest ELISA signals both recognize essentially the same epitope within the IFNα2a-IFNAR2 complex. This is interesting because additional conformational changes have been reported in IFNAR1 upon IFNα2a binding (38, 55). Future changes in the library and/or the selection process may identify other epitopes unique to IFN-IFNAR1-IFNAR2 complex formation, which have been observed by structural and biophysical approaches.
Despite overlapping binding epitopes, AcCS1 and AcCS4 have distinct binding and IFN-activating properties. The current model of receptor-mediated IFN activation separates IFN ternary complex formation into an IFN-IFNAR2 binding step (KB) followed by a translational interaction (KT) of IFNAR1, which results in ternary complex formation and signaling (17). Our studies show AcCS1 and AcCS4 impact IFN-IFNAR2 binding differently. AcCS1 binding is entirely dependent on IFN-IFNAR2 complex formation, whereas AcCS4 binds to IFNAR2 in the absence of IFN and subsequently stabilizes the IFN-IFNAR2 complex. The data suggest AcCS1 and AcCS4 both decrease the off-rate of KB to similar levels. However, AcCS1 is at a great disadvantage relative to AcCS4, as its binding is dependent on finding IFN-IFNAR2 complexes. The unique ability of AcCS4 to bind IFNAR2 in the absence of IFNα2a allows AcCS to efficiently “capture” IFN on the cell surface for subsequent IFNAR1 binding and IFN-IFNAR1-IFNAR2 signaling complex formation.
Elucidation of the AcCS4 mechanism of action provided an opportunity to revisit the impact of IFN-IFNAR1 and IFN-IFNAR2 affinity on IFN biological activity. These studies demonstrated stabilizing the IFNα2a-IFNAR2 interaction with AcCS4 could shift the AV and AP dose responses by 29- and 83-fold, respectively. In addition, AV activity was selectively induced (e.g. no AP activity was observed) in Huh-7 cells by using an IFNα2a mutant (NLYY), with a weakened IFNAR1 binding site, but stabilizing the NLYY/IFNAR2 interaction with AcCS4. The gene expression studies suggest IFN potency (e.g. reduction in EC50 values) is dependent on increased ISG levels, which is dependent on increased numbers of ternary signaling complexes for a given concentration of IFN. However, the selective activation of AV activity (e.g. no induction of AP activity), observed with NLYY+AcCS4 treatment, appears to depend not only on reduced ISG expression but also on the rapid down-regulation of genes that induces AP activity. Our data suggest NLYY+AcCS4 treatment induces a pulse of STAT1 phosphorylation and ISG expression that returns to pretreatment levels faster than with IFNα2a and IFNα2a+AcCS4 treatments, which both induce potent AP activity. At this time it remains unclear if NLYY+AcCS4 enhances negative signaling mechanisms that restore the cell to homeostasis or lower ISG levels induced by NLYY+AcCS4 allow the cell to return to pre-stimulation levels faster. Mechanistically, the data suggest IFN-IFNAR2 stabilization increases ternary complex formation, gene expression, and biological activity, which are also promoted, to a lesser extent, by IFN-IFNAR1 interactions. However, the IFN-IFNAR1 interaction appears to play a special role in regulating time-dependent IFN signal termination. These findings may help to explain the unique biological profiles of some IFNα subtypes (16). Furthermore, these studies suggest tuning IFN-IFNAR2 stability with AcCS, and modulating IFNAR1 affinity could lead to the design of AV treatments with limited off-target effects.
The binding mechanism of the AcCS highlights the fact that they are not cytokine mimics, as they do not activate cytokine receptors in the absence of cytokine. Rather, they potentiate the biological activity of IFNs by stabilizing IFN/IFNAR interactions. The question arises: can't these properties be engineered into the IFNs themselves, eliminating the need for AcCS? Yes, some properties of the AcCS should be amenable to IFN design. For example, it should be possible to engineer an IFN that exhibits ultra-high binding affinity for the IFNAR2 chain. However, although some binding properties might be engineered into an IFN scaffold, further tuning of IFN signaling might require two distinct proteins (.e.g. IFN and AcCS) to achieve appropriate results for a particular application. For example, AcCS might be used to increase the activity of natural IFNs produced locally at the site of a viral infection. In addition, several recent studies have demonstrated targeting IFNs to specific cells can be accomplished using IFN fusion proteins, which target IFNs to various cell surface markers by a variety of binding proteins (9, 20, 45). Improved targeting efficiency of IFN fusion proteins was recently demonstrated by reducing IFN-IFNAR2 binding affinity (9). Combining IFN fusion proteins with AcCS may allow the targeted IFNs to be further inactivated to further improve targeting specificity but allow them to be re-activated using AcCS. Thus, AcCS provide an opportunity to independently control IFN targeting and activation steps. Although IFNs are the focus of this report, AcCS can be developed for a wide variety of cytokines where novel therapeutics or reagents are needed (1).
Author Contributions
M. R. W. and S. S. S. conceived the project. S. K., S. M., A. D., J. A. S., B. D. H., J. M. S., and M. R. W. performed the experiments. Data analysis was performed by S. K., S. M., A. D., J. A. S., J. M. S., R. M. B., S. S. S., and M. R. W. S. K., S. M., A. D., S. S. S., and M. R. W. wrote and edited the manuscript.
Acknowledgments
Access to the Biacore T-200 was made possible by the University of Alabama at Birmingham Multidisciplinary Molecular Interaction Core. EM work was performed at the National Resource for Automated Molecular Microscopy, which is supported by NIGMS, National Institutes of Health Grant GM103310. We thank Bridget Carragher and Carragher/Potter laboratory members for many helpful discussions regarding EM processing, Makoto Hijikata for HuS-E/2 cells and protocols for their growth, and Tamas Jilling for assistance with qPCR studies.
This work was supported, in whole or in part, by National Institutes of Health Grants R01AI097629 and R01AI049342 as well as funds from the Lupus Research Institute (to M. R. W.). The authors declare that they have no conflicts of interest with the contents of this article. The content is solely the responsibility of the authors and does not necessarily represent the official views of the National Institutes of Health.
- AcCS
- activators of cytokine signaling
- ISG
- interferon-stimulated gene
- AV
- antiviral
- AP
- antiproliferative
- SPR
- surface plasmon resonance
- qPCR
- quantitative real-time PCR
- FSC
- Fourier shell correlation
- VSV
- vesicular stomatitis virus.
References
- 1.Akdis M., Burgler S., Crameri R., Eiwegger T., Fujita H., Gomez E., Klunker S., Meyer N., O'Mahony L., Palomares O., Rhyner C., Ouaked N., Quaked N., Schaffartzik A., Van De Veen W., Zeller S., Zimmermann M., and Akdis C. A. (2011) Interleukins, from 1 to 37, and interferon-γ: receptors, functions, and roles in diseases. J. Allergy Clin. Immunol. 127, 701–721 [DOI] [PubMed] [Google Scholar]
- 2.Striz I., Brabcova E., Kolesar L., and Sekerkova A. (2014) Cytokine networking of innate immunity cells: a potential target of therapy. Clin. Sci. 126, 593–612 [DOI] [PubMed] [Google Scholar]
- 3.Leonard J. P., Sherman M. L., Fisher G. L., Buchanan L. J., Larsen G., Atkins M. B., Sosman J. A., Dutcher J. P., Vogelzang N. J., and Ryan J. L. (1997) Effects of single-dose interleukin-12 exposure on interleukin-12-associated toxicity and interferon-γ production. Blood 90, 2541–2548 [PubMed] [Google Scholar]
- 4.Pockaj B. A., Yang J. C., Lotze M. T., Lange J. R., Spencer W. F., Steinberg S. M., Topalian S. L., Schwartzentruber D. J., White D. E., and Rosenberg S. A. (1994) A prospective randomized trial evaluating colloid versus crystalloid resuscitation in the treatment of the vascular leak syndrome associated with interleukin-2 therapy. J. Immunother. Emphasis Tumor Immunol. 15, 22–28 [DOI] [PubMed] [Google Scholar]
- 5.Baldo B. A. (2014) Side effects of cytokines approved for therapy. Drug Saf. 37, 921–943 [DOI] [PMC free article] [PubMed] [Google Scholar]
- 6.Junttila I. S., Creusot R. J., Moraga I., Bates D. L., Wong M. T., Alonso M. N., Suhoski M. M., Lupardus P., Meier-Schellersheim M., Engleman E. G., Utz P. J., Fathman C. G., Paul W. E., and Garcia K. C. (2012) Redirecting cell type-specific cytokine responses with engineered interleukin-4 superkines. Nat. Chem. Biol. 8, 990–998 [DOI] [PMC free article] [PubMed] [Google Scholar]
- 7.Levin D., Schneider W. M., Hoffmann H. H., Yarden G., Busetto A. G., Manor O., Sharma N., Rice C. M., and Schreiber G. (2014) Multifaceted activities of type I interferon are revealed by a receptor antagonist. Sci. Signal. 7, ra50. [DOI] [PMC free article] [PubMed] [Google Scholar]
- 8.Levin A. M., Bates D. L., Ring A. M., Krieg C., Lin J. T., Su L., Moraga I., Raeber M. E., Bowman G. R., Novick P., Pande V. S., Fathman C. G., Boyman O., and Garcia K. C. (2012) Exploiting a natural conformational switch to engineer an interleukin-2 “superkine.” Nature 484, 529–533 [DOI] [PMC free article] [PubMed] [Google Scholar]
- 9.Garcin G., Paul F., Staufenbiel M., Bordat Y., Van der Heyden J., Wilmes S., Cartron G., Apparailly F., De Koker S., Piehler J., Tavernier J., and Uzé G. (2014) High efficiency cell-specific targeting of cytokine activity. Nat. Commun. 5, 3016. [DOI] [PubMed] [Google Scholar]
- 10.Spangler J. B., Moraga I., Mendoza J. L., and Garcia K. C. (2015) Insights into cytokine-receptor interactions from cytokine engineering. Annu. Rev. Immunol. 33, 139–167 [DOI] [PMC free article] [PubMed] [Google Scholar]
- 11.Moraga I., Wernig G., Wilmes S., Gryshkova V., Richter C. P., Hong W. J., Sinha R., Guo F., Fabionar H., Wehrman T. S., Krutzik P., Demharter S., Plo I., Weissman I. L., Minary P., Majeti R., Constantinescu S. N., Piehler J., and Garcia K. C. (2015) Tuning cytokine receptor signaling by re-orienting dimer geometry with surrogate ligands. Cell 160, 1196–1208 [DOI] [PMC free article] [PubMed] [Google Scholar]
- 12.Liu Z., Stoll V. S., Devries P. J., Jakob C. G., Xie N., Simmer R. L., Lacy S. E., Egan D. A., Harlan J. E., Lesniewski R. R., and Reilly E. B. (2007) A potent erythropoietin-mimicking human antibody interacts through a novel binding site. Blood 110, 2408–2413 [DOI] [PubMed] [Google Scholar]
- 13.Pestka S., Krause C. D., and Walter M. R. (2004) Interferons, interferon-like cytokines, and their receptors. Immunol. Rev. 202, 8–32 [DOI] [PubMed] [Google Scholar]
- 14.Borden E. C., Sen G. C., Uze G., Silverman R. H., Ransohoff R. M., Foster G. R., and Stark G. R. (2007) Interferons at age 50: past, current, and future impact on biomedicine. Nat. Rev. Drug Discov. 6, 975–990 [DOI] [PMC free article] [PubMed] [Google Scholar]
- 15.Radhakrishnan R., Walter L. J., Hruza A., Reichert P., Trotta P. P., Nagabhushan T. L., and Walter M. R. (1996) Zinc mediated dimer of human interferon-α 2b revealed by x-ray crystallography. Structure 4, 1453–1463 [DOI] [PubMed] [Google Scholar]
- 16.Lavoie T. B., Kalie E., Crisafulli-Cabatu S., Abramovich R., DiGioia G., Moolchan K., Pestka S., and Schreiber G. (2011) Binding and activity of all human α interferon subtypes. Cytokine 56, 282–289 [DOI] [PubMed] [Google Scholar]
- 17.Piehler J., Thomas C., Garcia K. C., and Schreiber G. (2012) Structural and dynamic determinants of type I interferon receptor assembly and their functional interpretation. Immunol. Rev. 250, 317–334 [DOI] [PMC free article] [PubMed] [Google Scholar]
- 18.Platanias L. C. (2005) Mechanisms of type I- and type II-interferon-mediated signalling. Nat. Rev. Immunol. 5, 375–386 [DOI] [PubMed] [Google Scholar]
- 19.George P. M., Badiger R., Alazawi W., Foster G. R., and Mitchell J. A. (2012) Pharmacology and therapeutic potential of interferons. Pharmacol. Ther. 135, 44–53 [DOI] [PubMed] [Google Scholar]
- 20.Yang X., Zhang X., Fu M. L., Weichselbaum R. R., Gajewski T. F., Guo Y., and Fu Y. X. (2014) Targeting the tumor microenvironment with interferon-β bridges innate and adaptive immune responses. Cancer Cell 25, 37–48 [DOI] [PMC free article] [PubMed] [Google Scholar]
- 21.Gajewski T. F., Schreiber H., and Fu Y. X. (2013) Innate and adaptive immune cells in the tumor microenvironment. Nat. Immunol. 14, 1014–1022 [DOI] [PMC free article] [PubMed] [Google Scholar]
- 22.Honke N., Shaabani N., Cadeddu G., Sorg U. R., Zhang D. E., Trilling M., Klingel K., Sauter M., Kandolf R., Gailus N., van Rooijen N., Burkart C., Baldus S. E., Grusdat M., Löhning M., Hengel H., Pfeffer K., Tanaka M., Häussinger D., Recher M., Lang P. A., and Lang K. S. (2012) Enforced viral replication activates adaptive immunity and is essential for the control of a cytopathic virus. Nat. Immunol. 13, 51–57 [DOI] [PubMed] [Google Scholar]
- 23.Deshpande A., Putcha B. D., Kuruganti S., and Walter M. R. (2013) Kinetic analysis of cytokine-mediated receptor assembly using engineered FC heterodimers. Protein Sci. 22, 1100–1108 [DOI] [PMC free article] [PubMed] [Google Scholar]
- 24.Kuruganti S., Accavitti-Loper M. A., and Walter M. R. (2014) Production and characterization of thirteen human type-I interferon-α subtypes. Protein Expr. Purif. 103, 75–83 [DOI] [PMC free article] [PubMed] [Google Scholar]
- 25.Fellouse F. A., Sidhu S. S. (2007) Making Antibodies in Bacteria. In Making and Using Antibodies: A Practical Handbook (Howard G. C., and Kaser M. R., eds.) pp. 157–180, CRC Press, Inc., Boca Raton, FL [Google Scholar]
- 26.Myszka D. G. (1999) Improving biosensor analysis. J. Mol. Recognit. 12, 279–284 [DOI] [PubMed] [Google Scholar]
- 27.Lewerenz M., Mogensen K. E., and Uzé G. (1998) Shared receptor components but distinct complexes for α and β interferons. J. Mol. Biol. 282, 585–599 [DOI] [PubMed] [Google Scholar]
- 28.Tsugawa Y., Kato H., Fujita T., Shimotohno K., and Hijikata M. (2014) Critical role of interferon-α constitutively produced in human hepatocytes in response to RNA virus infection. PLoS ONE 9, e89869. [DOI] [PMC free article] [PubMed] [Google Scholar]
- 29.Schmittgen T. D., and Livak K. J. (2008) Analyzing real-time PCR data by the comparative C(T) method. Nat. Protoc. 3, 1101–1108 [DOI] [PubMed] [Google Scholar]
- 30.Suloway C., Pulokas J., Fellmann D., Cheng A., Guerra F., Quispe J., Stagg S., Potter C. S., and Carragher B. (2005) Automated molecular microscopy: the new Leginon system. J. Struct. Biol. 151, 41–60 [DOI] [PubMed] [Google Scholar]
- 31.Lander G. C., Stagg S. M., Voss N. R., Cheng A., Fellmann D., Pulokas J., Yoshioka C., Irving C., Mulder A., Lau P. W., Lyumkis D., Potter C. S., and Carragher B. (2009) Appion: an integrated, database-driven pipeline to facilitate EM image processing. J. Struct. Biol. 166, 95–102 [DOI] [PMC free article] [PubMed] [Google Scholar]
- 32.Mindell J. A., and Grigorieff N. (2003) Accurate determination of local defocus and specimen tilt in electron microscopy. J. Struct. Biol. 142, 334–347 [DOI] [PubMed] [Google Scholar]
- 33.Ludtke S. J. (2010) 3-D structures of macromolecules using single-particle analysis in EMAN. Methods Mol. Biol. 673, 157–173 [DOI] [PubMed] [Google Scholar]
- 34.Voss N. R., Yoshioka C. K., Radermacher M., Potter C. S., and Carragher B. (2009) DoG Picker and TiltPicker: software tools to facilitate particle selection in single particle electron microscopy. J. Struct. Biol. 166, 205–213 [DOI] [PMC free article] [PubMed] [Google Scholar]
- 35.Sorzano C. O., Bilbao-Castro J. R., Shkolnisky Y., Alcorlo M., Melero R., Caffarena-Fernández G., Li M., Xu G., Marabini R., and Carazo J. M. (2010) A clustering approach to multireference alignment of single-particle projections in electron microscopy. J. Struct. Biol. 171, 197–206 [DOI] [PMC free article] [PubMed] [Google Scholar]
- 36.de la Rosa-Trevín J. M., Otón J., Marabini R., Zaldívar A., Vargas J., Carazo J. M., and Sorzano C. O. (2013) Xmipp 3.0: an improved software suite for image processing in electron microscopy. J. Struct. Biol. 184, 321–328 [DOI] [PubMed] [Google Scholar]
- 37.Scheres S. H., and Chen S. (2012) Prevention of overfitting in cryo-EM structure determination. Nat. Methods 9, 853–854 [DOI] [PMC free article] [PubMed] [Google Scholar]
- 38.Thomas C., Moraga I., Levin D., Krutzik P. O., Podoplelova Y., Trejo A., Lee C., Yarden G., Vleck S. E., Glenn J. S., Nolan G. P., Piehler J., Schreiber G., and Garcia K. C. (2011) Structural linkage between ligand discrimination and receptor activation by type I interferons. Cell 146, 621–632 [DOI] [PMC free article] [PubMed] [Google Scholar]
- 39.Cho H. S., Mason K., Ramyar K. X., Stanley A. M., Gabelli S. B., Denney D. W. Jr., and Leahy D. J. (2003) Structure of the extracellular region of HER2 alone and in complex with the Herceptin Fab. Nature 421, 756–760 [DOI] [PubMed] [Google Scholar]
- 40.Pettersen E. F., Goddard T. D., Huang C. C., Couch G. S., Greenblatt D. M., Meng E. C., and Ferrin T. E. (2004) UCSF Chimera: a visualization system for exploratory research and analysis. J. Comput. Chem. 25, 1605–1612 [DOI] [PubMed] [Google Scholar]
- 41.Weitzner B. D., Kuroda D., Marze N., Xu J., and Gray J. J. (2014) Blind prediction performance of RosettaAntibody 3.0: grafting, relaxation, kinematic loop modeling, and full CDR optimization. Proteins 82, 1611–1623 [DOI] [PMC free article] [PubMed] [Google Scholar]
- 42.DeLano W. L. (2002) The PyMOL Molecular Graphics System, DeLano Scientific, San Carlos, CA [Google Scholar]
- 43.Kalie E., Jaitin D. A., Podoplelova Y., Piehler J., and Schreiber G. (2008) The stability of the ternary interferon-receptor complex rather than the affinity to the individual subunits dictates differential biological activities. J. Biol. Chem. 283, 32925–32936 [DOI] [PubMed] [Google Scholar]
- 44.Persson H., Ye W., Wernimont A., Adams J. J., Koide A., Koide S., Lam R., and Sidhu S. S. (2013) CDR-H3 diversity is not required for antigen recognition by synthetic antibodies. J. Mol. Biol. 425, 803–811 [DOI] [PMC free article] [PubMed] [Google Scholar]
- 45.Pasche N., and Neri D. (2012) Immunocytokines: a novel class of potent armed antibodies. Drug Discov. Today 17, 583–590 [DOI] [PubMed] [Google Scholar]
- 46.Chill J. H., Nivasch R., Levy R., Albeck S., Schreiber G., and Anglister J. (2002) The human interferon receptor: NMR-based modeling, mapping of the IFN-α 2 binding site, and observed ligand-induced tightening. Biochemistry 41, 3575–3585 [DOI] [PubMed] [Google Scholar]
- 47.Roisman L. C., Jaitin D. A., Baker D. P., and Schreiber G. (2005) Mutational analysis of the IFNAR1 binding site on IFNα2 reveals the architecture of a weak ligand-receptor binding site. J. Mol. Biol. 353, 271–281 [DOI] [PubMed] [Google Scholar]
- 48.Pan M., Kalie E., Scaglione B. J., Raveche E. S., Schreiber G., and Langer J. A. (2008) Mutation of the IFNAR-1 receptor binding site of human IFN-α2 generates type I IFN competitive antagonists. Biochemistry 47, 12018–12027 [DOI] [PubMed] [Google Scholar]
- 49.Herzer K., Hofmann T. G., Teufel A., Schimanski C. C., Moehler M., Kanzler S., Schulze-Bergkamen H., and Galle P. R. (2009) IFN-α-induced apoptosis in hepatocellular carcinoma involves promyelocytic leukemia protein and TRAIL independently of p53. Cancer Res. 69, 855–862 [DOI] [PubMed] [Google Scholar]
- 50.Espert L., Degols G., Gongora C., Blondel D., Williams B. R., Silverman R. H., and Mechti N. (2003) ISG20, a new interferon-induced RNase specific for single-stranded RNA, defines an alternative antiviral pathway against RNA genomic viruses. J. Biol. Chem. 278, 16151–16158 [DOI] [PubMed] [Google Scholar]
- 51.Chawla-Sarkar M., Lindner D. J., Liu Y. F., Williams B. R., Sen G. C., Silverman R. H., and Borden E. C. (2003) Apoptosis and interferons: role of interferon-stimulated genes as mediators of apoptosis. Apoptosis 8, 237–249 [DOI] [PubMed] [Google Scholar]
- 52.Levin D., Harari D., and Schreiber G. (2011) Stochastic receptor expression determines cell fate upon interferon treatment. Mol. Cell. Biol. 31, 3252–3266 [DOI] [PMC free article] [PubMed] [Google Scholar]
- 53.Taniguchi T., and Takaoka A. (2001) A weak signal for strong responses: interferon-α/β revisited. Nat. Rev. Mol. Cell Biol. 2, 378–386 [DOI] [PubMed] [Google Scholar]
- 54.Gough D. J., Messina N. L., Clarke C. J., Johnstone R. W., and Levy D. E. (2012) Constitutive type I interferon modulates homeostatic balance through tonic signaling. Immunity 36, 166–174 [DOI] [PMC free article] [PubMed] [Google Scholar]
- 55.Strunk J. J., Gregor I., Becker Y., Li Z., Gavutis M., Jaks E., Lamken P., Walz T., Enderlein J., and Piehler J. (2008) Ligand binding induces a conformational change in ifnar1 that is propagated to its membrane-proximal domain. J. Mol. Biol. 377, 725–739 [DOI] [PubMed] [Google Scholar]