Abstract
Background
Liquid core nanodroplets containing condensed gaseous fluorocarbons can be vaporized at clinically relevant acoustic energies, and have been hypothesized as an alternative ultrasound contrast agent instead of gas-core agents. The potential for targeted activation and imaging of these agents was tested with droplets formulated from liquid octafluorpropane (C3) and 1:1 mixtures of C3 with liquid decafluorobutane (C3C4).
Methods and Results
In eight pigs with recent myocardial infarction and variable degrees of reperfusion, transthoracic acoustic activation was attempted using 1.3–1.7 MHz low (0.2 mechanical index or MI) or high MI (1.2 MI) imaging in real time (32–64 Hertz) or triggered 1:1 at end systole during a 20% C3 or C3C4 droplet infusion. Any perfusion defects observed were measured and correlated with delayed enhancement magnetic resonance imaging and post mortem staining. No myocardial contrast was produced with any imaging setting when using C3C4 droplets, or C3 droplets during low MI real time imaging. However, myocardial contrast was observed in all eight pigs with C3 droplets when using triggered high MI imaging, and in five of six pigs who had 1.7 MHz real time high MI imaging. Although quantitative myocardial contrast was lower with real time high MI imaging than 1:1 triggering, the correlation between real time resting defect size and infarct size was good (r=0.97, p<0.001), as was the correlation with number of transmural infarcted segments by delayed enhancement imaging.
Conclusions
Targeted transthoracic acoustic activation of infused intravenous C3 nanodroplets is effective, resulting in echogenic and persistent microbubbles which provide real time high MI visualization of perfusion defects.
Keywords: acoustic activation, fluorocarbons, perfusion, echocardiography, angiography
Perfluorocarbon gases have improved the ability of microbubbles to serve as left ventricular diagnostic contrast agents. Their high molecular weight and reduced solubility have resulted in improved microbubble persistence following venous injection, permitting consistent left ventricular opacification and myocardial contrast (1,2). However, by the time microbubbles reach the systemic circulation from a venous injection, they are very susceptible to ultrasound induced destruction. Although this has been exploited successfully to better quantify myocardial perfusion (3,4), it has prevented the real time visualization of myocardial contrast at power outputs that could improve image quality and reduce attenuation. One reason for the fragility of intravenously infused microbubbles is their reduced size upon reaching the systemic circulation, while larger intra-arterially injected microbubbles are more resistant to ultrasound destruction (5).
Both octafluoropropane and decafluorobutane gases can be condensed under pressure to their liquid phases within lipid shells to sub-micron size droplets (6,7). These same droplets can be vaporized by ultrasound to reform acoustically active microbubbles at transducer-targeted locations (8,9). The nanodroplets formulated from these low-boiling point perfluorocarbons require less acoustic pressure than higher boiling point perfluorocarbons, and purely octafluoropropane droplets have vaporized at peak negative pressures that are achievable with current commercially available transthoracic ultrasound systems (8,9). The microbubbles produced are approximately five times the size of the original droplet (7). Despite extensive in-vitro studies, the acoustic properties of these created microbubbles within the myocardial microcirculation are unknown. The purpose of this paper was to test whether acoustic activation of condensed low boiling point droplets was possible with commercially available transthoracic frequencies and clinically relevant peak negative pressures.
METHODS
Acoustic Droplet Preparation and Characterization
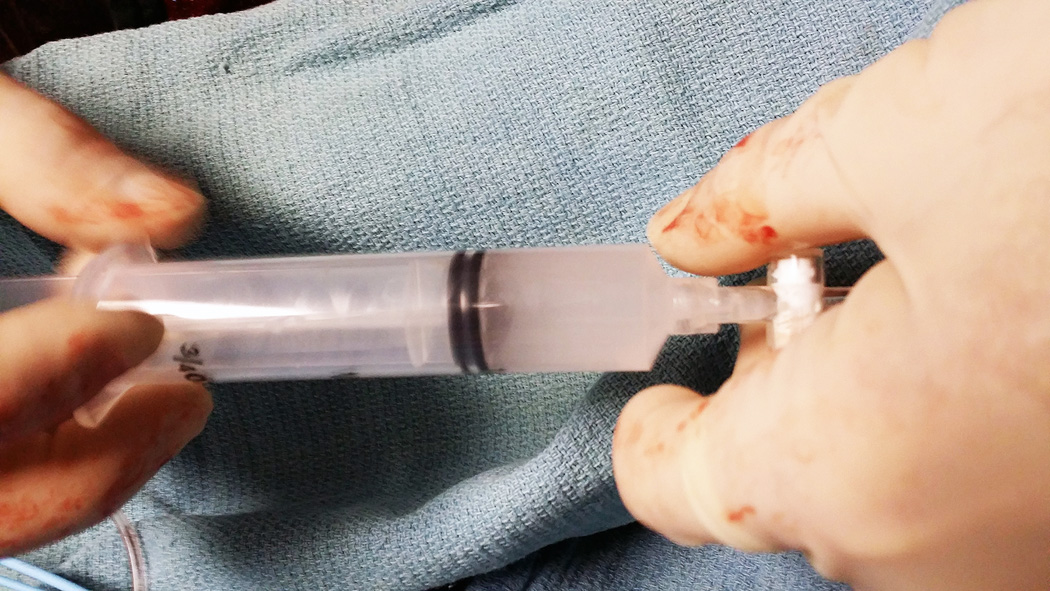
Octafluoropropane (C3) and 1:1 mixtures of octafluoropropane/decafluorobutane (C3C4) were formed by condensing seed microbubbles using previously established techniques (3,6). Briefly, in order to generate microbubbles, the headspace within stock vials of lipid solution was gas-exchanged with either C3 or C3C4 and subject to standard agitation (Vialmix, Bristol-Myers-Squibb, New York, NY). Individual microbubble vials were then immersed in an isopropanol bath maintained at −10°C and exposed to a gradual increase in external pressure using an adjustable air source until condensation was observed. The droplets were stable and appeared as a clear solution during infusion (Figure 1).
Figure 1.
The typical appearance of the C3 nanodroplets diluted to 15% in normal saline prior to infusion. Note the near complete absence of any microbubbles.
The sizes of the condensed droplets were polydisperse. As such, two separate sizing systems were required to characterize the entire range of droplet sizes. The NanoSight NS500 (Malvern Instruments Inc., Westborough, MA) was used to capture droplet content ranging from 50 to 1000 nm in diameter, and the AccuSizer 780A (Particle Sizing Systems, Port Richey, FL) was used to capture droplet content ranging from 500 to 50,000 nm in diameter. According to the NanoSight system, the average distribution (3 separate vials) of C3 droplets had a mode size of 109.1 +/− 6.8 nm and a total concentration of 2.8 × 10¹¹ +/− 1.3 × 10¹¹ particles/ml, whereas C3C4 droplets had a mode size of 125.9 +/− 3.6 nm and a total concentration of 1.6 × 10¹¹ +/− 8.8 × 10¹⁰. The differences in size and concentration between C3 and C3C4 droplets are expected based on ideal gas laws and the concentration of seed microbubbles (8). According to the AccuSizer, the average distribution (3 separate vials) of C3 droplets had a mode size of 623.3 +/− 37.9 nm and a total concentration of 2.6 × 10⁸ +/− 3.3 × 10⁷ particles/ml, whereas C3C4 droplets had a mode size of 610.0 +/− 10.0 nm and a total concentration of 3.2 × 10⁸ +/− 3.5 × 10⁷. It is important to note that although the concentration of larger droplet content reported by the AccuSizer is three orders of magnitude larger than that reported by the NanoSight, it is likely this larger droplet content is primarily responsible for contrast enhancement.
Animal Studies
All studies performed were approved by the Institutional Animal Care and Use Committee at the University of Nebraska Medical Center. Eight pigs (mean weight 64 ± 6 kg) who were 48 hours post an acute ST segment elevation myocardial infarction were studied. One additional pig without infarction was utilized to demonstrate the effect of mechanical index on activation threshold in real time and the wash out of activated droplets from the myocardium and left ventricular cavity. The infarction was created using an established protocol (10,11) that involves balloon injury of the mid left anterior descending artery followed by a 50 day 15% lard diet. At 50 days, the left anterior descending was balloon-injured again in the same location, following which the balloon was reinflated slightly proximal to the injury site to create stasis, and small 0.2–0.3 milliliter aliquots of thrombosing venous blood were re-injected through the balloon catheter until a sustained (20 minute) angiographic occlusion was achieved. Pigs were then treated with intermittent high mechanical index impulses (1.0 mechanical index) from a modified low frequency diagnostic and therapeutic transducer (900 kHz GE Vivid E9; GE Global Research) during a 30 minute intravenous microbubble infusion (3% Definity). All pigs received 300 mg of aspirin and 600 milligrams of clopidogrel via a nasogastric tube combined with a heparin infusion for sixty minutes. Using this protocol epicardial recanalization occurred in five of the eight pigs by 90 minutes into therapy. Following the myocardial infarction and ultrasound treatment, all pigs were allowed to recover and placed back on a regular diet for two days.
At 48 hours post infarction, the pigs underwent cardiac magnetic resonance exams (described below) to define infarct size. Following this, pigs underwent 20% intravenous infusions (diluted in normal saline) of C3 or 20% infusion of the 1:1 ratio of C3C4 droplets. Imaging was initiated at one minute after the infusion was started. Each infusion was separated from the other by five-seven minutes to allow clearance of the previous droplets from the system, which was verified by ultrasound imaging. Before and during all infusions, arterial blood pressure, heart rate, and oxygen saturation monitoring were recorded.
Ultrasound Activation Protocols
Using a Philips S5-1 transducer (Philips Healthcare), a triggered harmonic high mechanical index (MI) at 1.3 MHz (1.1 MI) was tested using mid and distal short axis imaging of the left ventricle. At the 1.3 MHz harmonic setting, the images were triggered to end systole at either one frame every one cardiac cycle or every four cardiac cycles. We also tested two real time settings: A 20 Hz frame rate low MI (0.2–0.25) setting (Power Modulation) traditionally used for microbubble imaging at 1.7 MHz, and a high MI (1.2 MI) real time setting of 1.7 MHz harmonic imaging. The purpose of the high MI real time setting was to determine if droplets within the microcirculation could be activated and still visualized without destruction. To further evaluate this in three of the pigs, myocardial contrast enhancement with the 1.7 MHz real time setting was compared with the 1:1 triggered setting at the same MI during the continuous infusion to determine if there was evidence of differences in myocardial signal enhancement due to destruction. The wash out of the myocardial and left ventricular cavity contrast following infusion termination was also analyzed using Q lab measurements of digital intensity versus time.
All three settings (triggered 1.3/2.6 MHz harmonic, low MI 1.7 MHz power modulation imaging, and real time 1.7 MHz high MI imaging) were tested for both intravenous C3 and C3C4 droplet infusions. Prior to sacrifice, the pigs had a balloon catheter advanced under fluoroscopy into the same location as the original LAD occlusion and inflated to re-occlude the infarct vessel (if it was recanalized). No balloon was inserted if the vessel remained occluded at the original injury site. Following this, a total of 65 ml of 3% Evans Blue (40 ml in the left main, 25 ml in the right coronary) was then injected through coronary catheters placed in the right and left main coronary arteries to define risk area. The pigs were subsequent sacrificed and post mortem triphenyl tetrazolium chloride (TTC) staining of infarct size and Evans Blue (EB) measurements of risk area were determined using planimetry.
Magnetic resonance imaging (MRI), Risk Area, and Post Mortem TTC Staining
MRI scans were also performed at 48 hours following infarction just prior to droplet infusion studies using a 1.5 Tesla Magnet (Philips Achieva XL: Best, The Netherlands). Cine images using steady state free precession were obtained in serial short axis views (slice thickness 8 cm, slice gap 2 cm, 45 msec temporal resolution, flip angle 60 degrees; TR 3 msec; TE 1.5 msec) to quantify left ventricular ejection fraction using the Philips View Forum workstation. Following this, 0.15 mmol/kilogram of 0.2 mmol/kg dimeglumine gadopentatate (Magnevist: Bayer) was injected. At 10 minutes post injection, all short axis views were examined using an inversion recovery turbo fast field echo/gradient recall ECG-triggered, segmented image collection for detection of extent of necrosis. Using a 16 segment model, segments exhibiting transmural (>50% thickness at end diastole) hyperenhancement, and segments exhibiting any microvascular obstruction (persistent unenhanced portions within the hyperenhanced segments) were recorded using established criteria (12). All image interpretation and quantification was performed by an experienced level III trained cardiologist (SS) who was blinded to echocardiographic and post mortem staining results.
Statistical Comparisons
Since the presence or absence of myocardial contrast at high and low mechanical indices were obvious and consistent, comparisons of the presence or absence of myocardial contrast using the different imaging techniques utilized to activate the intravenously infused C3 versus C3C4 droplets were descriptive and not determined with contingency tables. When comparing myocardial contrast intensity between real time and triggered frame rates in the different animals (n=18 comparisons in three animals), a covariance structure which treats random variation due to the three pigs was performed, which then treats the paired data with a 2×2 unstructured co-variance matrix. The average size of any visualized perfusion defect (at rest and during repeat LAD occlusion) with any of the imaging techniques was planimetered off line, and compared with post mortem EB and TTC staining using a Spearman correlation with an exact p value to summarize the association. The planimetered size of any defect was also compared with the number of segments (using a 16 segment model) exhibiting transmural (>50% transmural thickness) delayed enhancement on post gadolinium magnetic resonance imaging using a Spearman correlation coefficient. Statistical analyses were generated with SAS/STAT software, Version 9.4 (© 2002 – 2012 SAS Institute Inc.)
RESULTS
Activation Thresholds for Transthoracic Real Time Imaging of Myocardial Contrast Enhancement
Figure 2 and Video 1 demonstrate the effect of mechanical index on the presence of myocardial contrast enhancement achieved with a continuous intravenous C3 infusion. Note that at a specific mechanical index (0.8) we begin to see myocardial and left ventricular cavity contrast which eventually encompasses the entire short axis at the 1.2 mechanical index.
Figure 2.
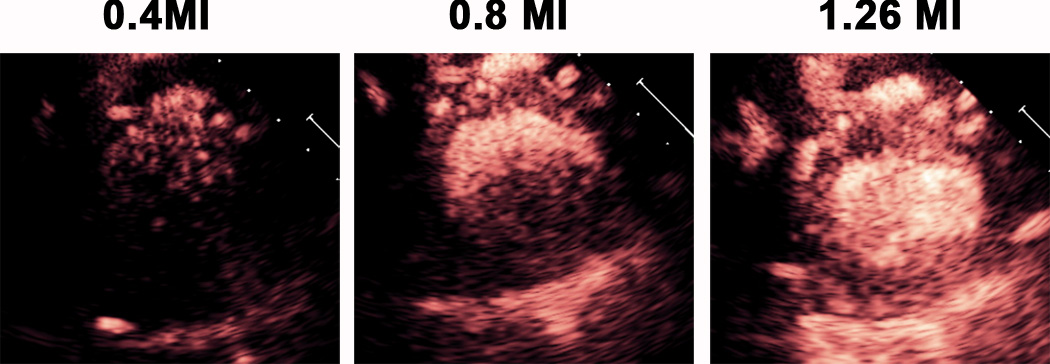
An example of C3 droplet activation during a continuous infusion of the droplets as mechanical index is increased at the 1.3 MHz frequency. Image frame rate was 30 Hertz
Acoustic Activation of C3 versus C3C4 Droplet Infusions
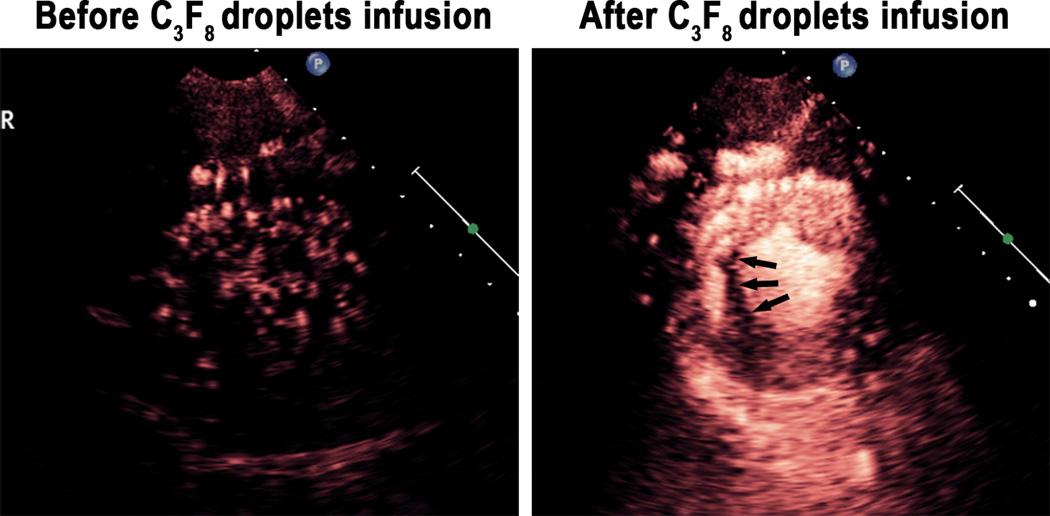
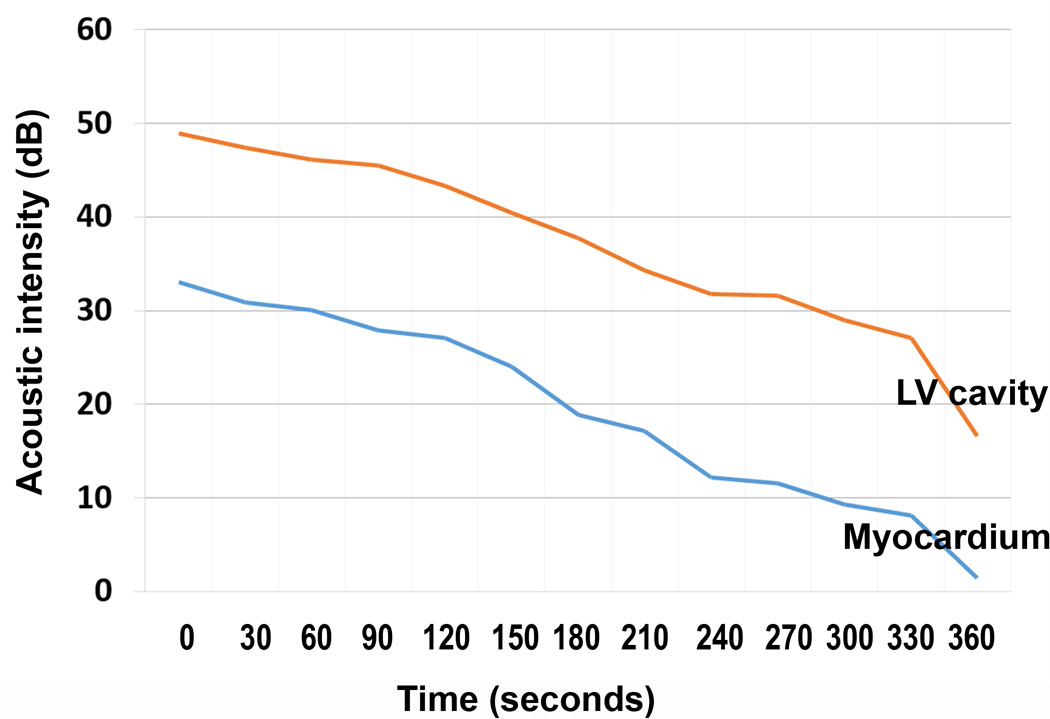
A total of eight pigs were examined with both the C3 and C3C4 droplet infusions. During the C3 infusion, consistent myocardial opacification and left ventricular cavity contrast were seen in all eight pigs with the 1.3 MHz triggered (once every one and four cardiac cycles at end systole) harmonic imaging modality (Figure 3 example). No myocardial contrast and minimal left ventricular cavity contrast was seen with 1.7 MHz low MI power modulation imaging. However, in the six pigs in which real time high MI harmonic imaging at 1.7 MHz was tested, myocardial contrast enhancement was observed in the un-infarcted myocardial microcirculation with excellent delineation of perfusion defects in five of six animals (Figure 4; Videos 2). This contrast persisted during and for up to three minutes following cessation of the 20% C3 infusion, and a time lapse quantitative measurements of contrast disappearance from the cavity and myocardium indicated that there was a linear disappearance of contrast from both regions (Figure 5), indicating the created microbubbles were, for the most part, behaving as intravascular tracers and were not trapped within the microcirculation.
Figure 3.
Triggered 1.3 MHz high MI imaging during a C3 nanodroplet infusion in a pig with a small previous small inferoseptal myocardial infarction (arrows).
Figure 4.

Real time high mechanical index imaging of microcirculatory microbubbles activated during real time 1.7 MHz transthoracic imaging during acute LAD ischemia. Frame rate is 64 Hz; MI is 1.3.
Figure 5.
Demonstration of the washout of the myocardial and left ventricular cavity contrast after the C3 has been injected using a 1:1 triggering imaging technique. Using Q Lab software, this intensity was plotted on the accompanying graph to demonstrate the corresponding disappearance of contrast as a function of time, verifying that the contrast in the myocardium is not coming from trapped microbubbles within the microcirculation.
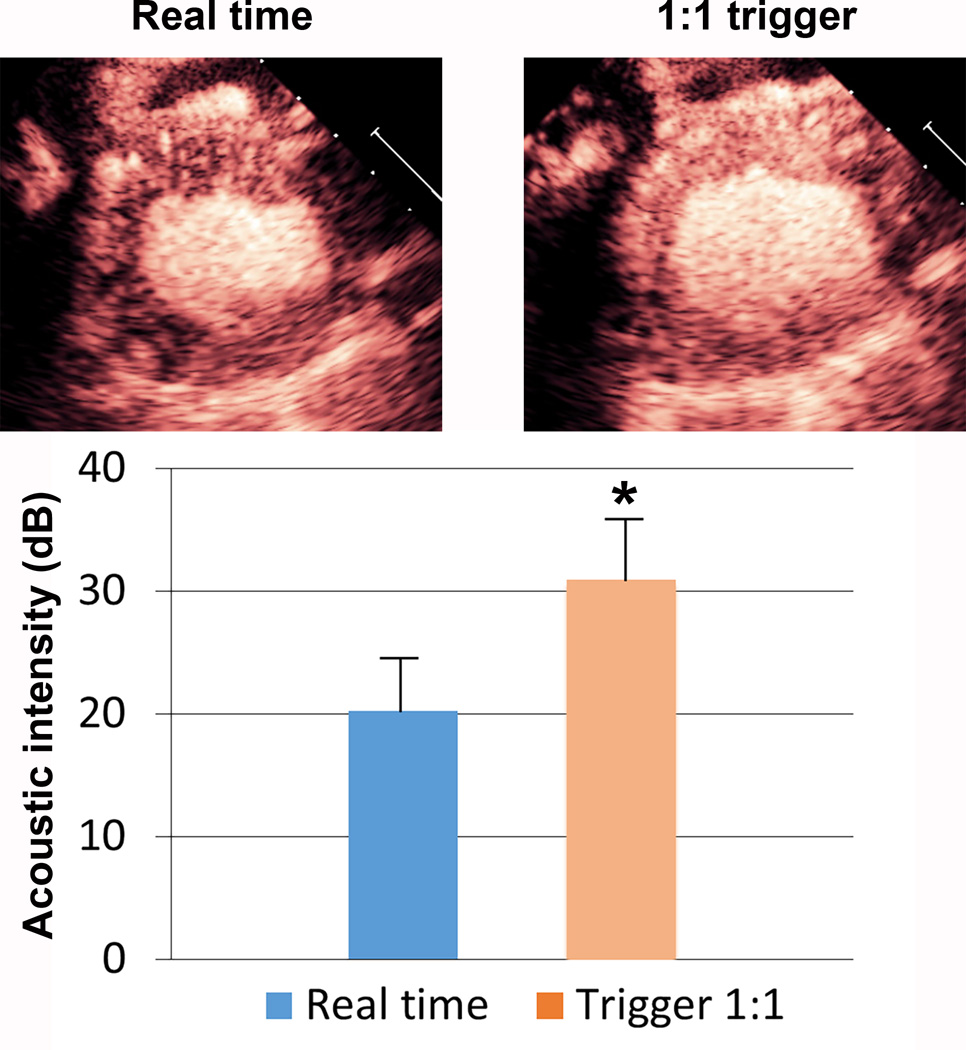
In the three pigs in which a triggered 1.7 MHz high MI end systolic image (1:1 triggering) was compared to a real time 1.7 MHz image at the same MI, there was a slight, but highly significant increase in myocardial contrast intensity was observed (p<0.00001; n = 18 comparisons in the three pigs). This would indicate that simultaneous generation and destruction of microbubbles is occurring in the microcirculation while in the real time high MI mode (Figure 6).
Figure 6.
A representative image and graphical display of the myocardial contrast enhancement achieved at 1:1 triggering at end systole versus real time imaging at the same high mechanical index (1.2). The comparisons (n=19) were done in three separate pigs. There was a slight, but highly significant (p<0.0001), increase in signal intensity while in the triggering mode. This would indicate that some simultaneous generation and destruction of microbubbles is occurring in the microcirculation while in the real time high MI. *p<0.0001 compared to real time imaging.
In none of the eight pigs was myocardial contrast achieved with the 20% C3C4 infusion.
Correlation with Infarct Size and Risk Area Assessments
At cardiac MRI, the average ejection fraction of the pigs was 45 ± 15% (range 29–74%). Median number of segments exhibiting transmural hyperenhancement was 4, with a range of 1 to 6.
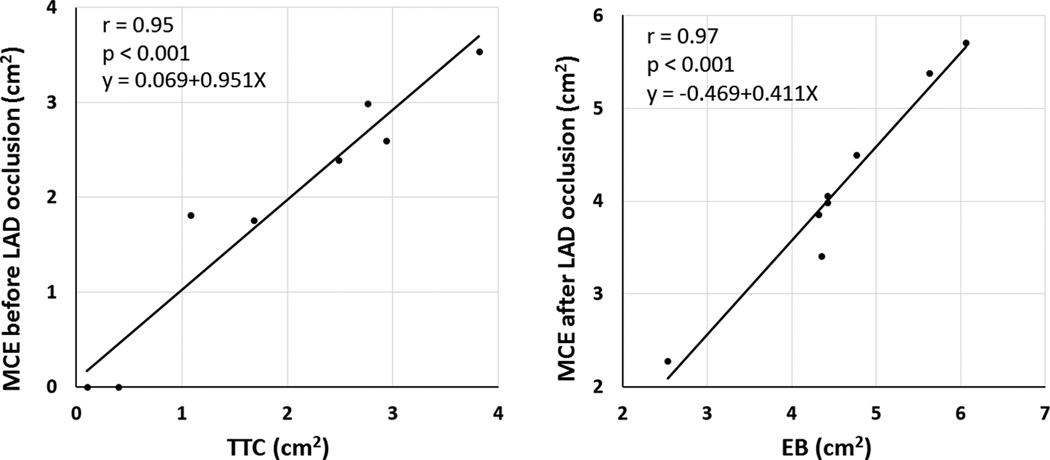
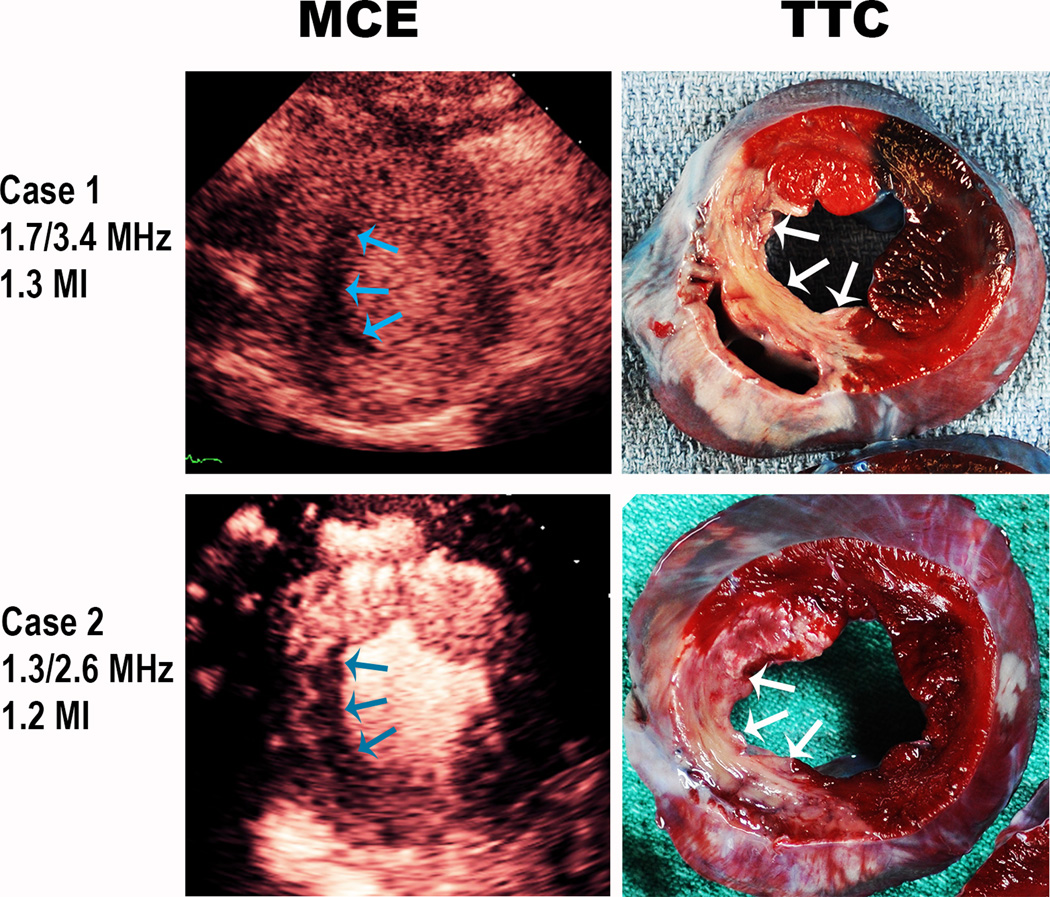
During the C3 infusion with triggered end systolic 1:1 imaging at 1.3 MHz, delineation of perfusion defects was possible. This was also possible with the real time high mechanical index 1.7 MHz harmonic imaging in five of six pigs tested. Under resting conditions before re-occlusion of the LAD, perfusion defect size (presumed infarct size) observed with 1:1 triggering at high MI 1.3 harmonic imaging and 1.7 MHz real time high MI imaging averaged 1.86±1.29 cm2 while TTC measurements of infarct size were 1.90±1.31cm2. There was a close correlation between perfusion defect size and TTC measurements (r=0.95, p<0.001; Figure 7a) and with the number of transmurally infarcted segments measured at MRI (r=0.74, p=0.048). Figure 8 depicts two examples of infarctions detected with real time high MI imaging and corresponding TTC staining.
Figure 7.
Correlations between TTC derived infarct area (left panel) and averaged defect size from 1.3 MHz/2.6 MHz transthoracic triggered imaging and 1.7/3.4 MHz real time harmonic imaging (r=0.95; p<0.001). During repeat left anterior descending occlusion, the Evans Blue (EB) unstained area correlated closely with perfusion defect size using either the triggered 1:1 high MI setting or real time high MI setting. Data points are the same as pig number, and the correlations represent the average of measurements from the 1.3 MHz triggered data and 1.7 MHz real time data for each pig.
Figure 8.
Representative examples of infarction (arrows) detected using the 1.7 MHz real time (Case 1) and 1.3 MHz real time (Case 2) frequencies at a high mechanical index in real time. The accompanying TTC images are also displayed.
Assessment of perfusion defect size with the C3 infusion was possible during repeat LAD occlusion ischemia in seven pigs. In this setting, the average perfusion defect size with both 1.3 MHz triggered and 1.7 MHz real time high MI imaging correlated closely with unstained areas on post mortem Evans Blue staining (r=0.97;p<0.001; Figure 7b).
Safety
During infusions of both agents, no changes in heart rate, systolic arterial pressure, or oxygen saturation were observed (Table). None of the animals exhibited premature ventricular contractions or other arrhythmias during the infusion of either C3 or C3C4. Post mortem TTC staining indicated no evidence of hemorrhage within the normal myocardium, or within the infarct zones.
Table.
Hemodynamic changes following a C3 or C4 infusion. No significant changes were observed in any parameter.
| Agent | MAP before |
MAP after |
O2 sat Before |
O2 sat After |
HR Before |
HR After |
|---|---|---|---|---|---|---|
| C3 infusion | 68.0 | 68.1 | 98.5 | 94.1 | 85.8 | 89.6 |
| C3/C4 infusion | 69.3 | 71.8 | 97.8 | 96.4 | 82.4 | 85.5 |
DISCUSSION
This is the first paper to demonstrate that intravenous nanodroplets can be acoustically activated with conventional transthoracic phased array transducers to detect both infarct size and risk area. Although these droplets were acoustically undetectable with conventional low mechanical index techniques traditionally used to detect perfusion with microbubbles, they were consistently activated with triggered high mechanical index harmonic techniques, and more importantly visualized within the microcirculation with real time high mechanical index harmonic imaging techniques.
Following acoustic activation, the C3 nanodroplets behaved similar to what has been described with larger sized more concentrated intra-arterially injected microbubbles (5), in that they were resistant to high mechanical index ultrasound destruction. It is unlikely that these were microbubbles were trapped within the microcirculation, since their disappearance following infusion termination correlated with disappearance of left ventricular cavity contrast. The 600–650 nanometer sized droplets would be expected to result in microbubbles that were at least 3–4 microns in size (7), and perhaps slightly larger due to inward diffusing dissolved nitrogen gas within the blood stream. Even at these sizes though, they would still be expected to pass freely through the myocardial capillaries (13) while also being more resistant to destruction than smaller sized perfluorocarbon microbubbles (14). Intravenously infused commercially available microbubbles within the capillaries would not be visualized at this high mechanical index and frame rate, since capillary blood replenishment with intravenously infused C3 microbubbles would not be expected at this frame speed (10). It is possible, therefore, that these created microbubbles were in a unique size range that was resistant to ultrasound induced destruction but still capable of acting as free intravascular tracers. Other explanations for their resistance to destruction may be their resistance to shell buckling in response to diagnostic ultrasound pressures. High speed optical imaging has shown that in some cases, microbubbles recently formed from vaporized liquid perfluorocarbons behave differently in response to diagnostic ultrasound when compared to commercially available microbubbles, and do not exhibit shell buckling (15). Whether this renders them more resistant to destruction is not clear. One important caveat from this is that these created microbubbles cannot be used for the perfusion imaging techniques that take advantage of microbubble destruction to quantify myocardial blood flow (3).
Also, we did not observe any evidence of leaking of the microbubbles into infarcted segments. This may have been due to our ability to only activate only the “larger” 600 nanometer C3 droplets that were confined to the intravascular spaces. According to the characterization results, the nanodroplets were polydisperse. It has been shown that the droplet activation threshold increases with decreasing droplet diameter (6). Therefore, it is possible that that observed contrast enhancement was due to the activation of larger droplet content, and droplets small enough to cross damaged endothelial membranes may not have been activated at the pressures tested herein. This may explain the close correlation between contrast defect size with triggered high MI imaging and TTC measurements of infarct area as well as Evans Blue measurements of risk area.
C4 droplets, and droplets with 50% C4 content as used in the current study, appear to be more difficult to activate with the MI limits currently available with conventional diagnostic transthoracic transducers at the depths required for cardiac imaging in the pig and humans (approximately 4–10 centimeters from the anterior to posterior borders for transthoracic parasternal imaging as demonstrated in Figures 3–5). This is in agreement with in vitro studies that indicated that the droplet activation threshold increases with increasing molecular weight of the perfluorocarbon core (7).
Limitations of Nanodroplet Formulations
A problem with the technique used to create droplets in the current study was the polydisperse nature of the formed droplets, ranging from 100 to 700 nm in diameter. It is possible that more monodisperse droplet distributions, designed for different clinical applications, could be created through techniques such as microfluidic particle generation (16) or by optimizing the size distribution of the precursor bubble population.
The microbubbles created in this study were resistant to high MI destruction, and thus cannot be used to perform targeted myocardial blood flow calculations similar to what is currently done with destruction replenishment curves using commercially available microbubbles (3). However, since the generated microbubbles still appear to function as free intravascular tracers, the targeted activation of left ventricular cavity droplets with a three dimensional high mechanical index impulse following a bolus intravenous injection could be utilized as an input function to generate myocardial contrast time intensity curves to quantitatively assess transit rates that correlate with myocardial blood flow (17). Further work is needed to assess the feasibility of such methods.
Clinical Implications/Future Directions
All infusions of the nanodroplets resulted in no changes in myocardial function across a wide range of ejection fractions, and no changes in hemodynamics, oxygen saturation, or damage outside the infarct zones. Therefore, this study suggests there is clinical potential for this technique for real time high mechanical index transthoracic perfusion imaging. Although C3 droplets have not been tested with transthoracic imaging in humans, these pigs were large animals (mean weight 64 ± 6 kg) and their parasternal locations for left ventricular cavity were similar to that which is seen in humans. The mechanical indices that were required to activate the microbubbles and permit myocardial contrast enhancement in both the near and far field were well within Food and Drug Administration limits.
This targeted activation technique at a high mechanical index may improve the dynamic range within which myocardial blood volume can be analyzed and quantified with contrast echocardiography. Additional studies are needed to determine whether more precise sizes of nanodroplets can be created that would allow a consistent size of microbubble to be produced. Activation of the smaller 100–200 nanometer droplets that cross defective endothelial borders into infarct zones may allow highlighting of the infarct zone in a manner currently seen with delayed enhancement imaging, but this still has not been demonstrated. Droplets of larger size like those activated in the current study may be used to better delineate myocardial contrast defects seen with infarction, as well as identify normal myocardial contrast enhancement within dysfunctional segments (i.e. hibernating myocardium). Overall, the ability intravenous droplets to bypass the lung filtering effect and permit targeted acoustic activation only to zones where myocardial contrast is needed may further improve the safety of ultrasound contrast imaging and allow higher quality imaging of myocardial blood volume in acute coronary syndromes.
Supplementary Material
Clinical Perspective.
This study demonstrates the potential for transthoracic ultrasound to target both the activation and imaging of systemically administered acoustic droplets that are less than one micron in size. Consistent real time visualization of myocardial contrast enhancement was possible at 1.3 and 1.7 MHz frequencies. This targeted acoustic activation of intravenous perfluorocarbon droplets has not been previously demonstrated. Since these droplets range in size from 50 to 600 nanometers, and do not become microbubbles until acoustically activated, they could be used for prolonged periods of time following intravenous injection, and could be used to accurately identify the transmural extent and size of infarction in real time at a high mechanical index.
ACKNOWLEDGEMENTS
The authors appreciate the assistance of Terry Matsunaga (University of Arizona) in the early development of perfluorocarbon agents. The authors thank Nazar Filonov and the Nanomedicines Characterization Core Facility at University of North Carolina for the use of nanoparticle sizing equipment. The authors thank Carol Gould for her administrative assistance in manuscript preparation, as well as Elizabeth Stoltze and Gretchen Fry for their assistance in performing the additional animal experiments.
SOURCES OF FUNDING
The study was supported in part by the Theodore Hubbard Foundation and National Institute of Health Biomedical Research Partnership Grant # R01 HL095868, as well as the National Institute of General Medical Sciences, Division of Training, Workforce Development, and Diversity under the Institutional Research and Academic Career Development Award, grant #K12-GM000678.
DISCLOSURES
Thomas R. Porter has equipment support from General Electric Global and Philips Healthcare. Dr. Porter has grant support from Lantheus Medical, Astellas Pharma, GE Healthcare. Dr. Porter is on the Speaker’s Bureau for Bracco. Paul A. Dayton has patents pending on the phase change contrast agent formulations utilized here.
REFERENCES
- 1.Porter TR, Xie F. Visually discernible myocardial echocardiographic contrast after intravenous injection of sonicated dextrose albumin microbubbles containing high molecular weight, less soluble gases. J Am Coll Cardiol. 1995;25:509–515. doi: 10.1016/0735-1097(94)00376-2. [DOI] [PubMed] [Google Scholar]
- 2.Porter TR, Xie F. Transient myocardial contrast after initial exposure to diagnostic ultrasound pressures with minute doses of intravenously injected microbubbles: Demonstration and potential mechanisms. Circulation. 1995;92:2391–2395. doi: 10.1161/01.cir.92.9.2391. [DOI] [PubMed] [Google Scholar]
- 3.Wei K, Jayaweera AR, Firoozan S, Linka A, Skyba DM, Kaul S. Quantification of myocardial blood flow with ultrasound-induced destruction of microbubbles administered as a constant venous infusion. Circulation. 1998;97:473–483. doi: 10.1161/01.cir.97.5.473. [DOI] [PubMed] [Google Scholar]
- 4.Wei K, Jayaweera AR, Firoozan S, Linka A, Skyba DM, Kaul S. Basis for detection of stenosis using venous administration of microbubbles during myocardial contrast echocardiography: Bolus or continuous infusion? J Am Coll Cardiol. 1998;32:252–260. doi: 10.1016/s0735-1097(98)00212-5. [DOI] [PubMed] [Google Scholar]
- 5.Wei K, Skyba DM, Firschek C, Jayaweera AR, Lindner JR, Kaul S. Interactions between microbubbles and ultrasound: In vitro and in vivo observations. J Am Coll Cardiol. 1997;29:1081–1088. doi: 10.1016/s0735-1097(97)00029-6. [DOI] [PubMed] [Google Scholar]
- 6.Sheeran PS, Luois S, Mullin L, Matsunaga TO, Dayton PA. Design of ultrasonically-activatable nanoparticles using low boiling point perfluorocarbons. Biomaterials. 2012;33:3362–3369. doi: 10.1016/j.biomaterials.2012.01.021. [DOI] [PMC free article] [PubMed] [Google Scholar]
- 7.Matsunaga TO, Sheeran PS, Luois S, Streeter JE, Mullin LB, Banerjee B, Dayton PA. Phase-Change Nanoparticles Using Highly Volatile Perfluorocarbons: Toward a Platform for Extravascular Ultrasound Imaging. Theranostics. 2012;2:1185–1198. doi: 10.7150/thno.4846. [DOI] [PMC free article] [PubMed] [Google Scholar]
- 8.Sheeran PS, Rojas JD, Puett C, Hjelmquist J, Arena CB, Dayton PA. Contrast enhanced ultrasound imaging and in vivo circulatory kinetics with low-boiling-point nanoscale phase-change perfluorocarbon agents. Ultrasound Med Biol. 2015;41:814–831. doi: 10.1016/j.ultrasmedbio.2014.10.020. [DOI] [PMC free article] [PubMed] [Google Scholar]
- 9.Sheeran PS, Luois S, Dayton PA, Matsunaga TO. Formulation and acoustic studies of a new phase-shift agent for diagnostic and therapeutic ultrasound. Langmuir. 2011;27:10412–10420. doi: 10.1021/la2013705. [DOI] [PMC free article] [PubMed] [Google Scholar]
- 10.Xie F, Gao S, Wu J, Lof J, Radio SJ, Vignon F, Shi W, Powers J, Unger E, Everbach EC, Liu J, Porter TR. Diagnostic Ultrasound Induced Inertial Cavitation to Non-invasively Restore Coronary and Microvascular Flow in Acute Myocardial Infarction. Plos One. 2013;8:e69780. doi: 10.1371/journal.pone.0069780. [DOI] [PMC free article] [PubMed] [Google Scholar]
- 11.Wu J, Xie F, Lof J, Sayyed S, Porter TR. Utilization of Modified Diagnostic Ultrasound and Microbubbles to Reduce Myocardial Infarct Size. Heart. 2015;101:1468–1474. doi: 10.1136/heartjnl-2015-307625. [DOI] [PubMed] [Google Scholar]
- 12.Cerqueria M, Weissman NJ, Dilsizian V, Jacobs AK, Kaul S, Laskey WK, Pennell DJ, Rumberger JA, Ryan T, Verani MS. Standardized myocardial segmentation and nomenclature for tomographic imaging of the heart. A statement for healthcare professionals from the Cardiac Imaging Committee of the Council on Clinical Cardiology of the American Heart Association. Circulation. 2002;105:539–542. doi: 10.1161/hc0402.102975. [DOI] [PubMed] [Google Scholar]
- 13.Kaul S, Jayaweera AR. Myocardial capillaries and coronary flow reserve. J Am Coll Cardiol. 2008;52:1399–1401. doi: 10.1016/j.jacc.2008.07.039. [DOI] [PubMed] [Google Scholar]
- 14.Liao AH, Hsieh YL, Ho HC, Chen HK, Lin YC, Shih CP, Chen HC, Kuo CY, Lu Y-, Wang CH. Effects of Microbubble Size on Ultrasound-Mediated Gene Transfection in Auditory Cells. Biomed Research Int. 2014;2014:1–11. doi: 10.1155/2014/840852. [DOI] [PMC free article] [PubMed] [Google Scholar]
- 15.Reznik N, Lajoinie G, Shpak O, Gelderblom EC, Williams R, de Jong N, Versluis M, Burns PN. On the acoustic properties of vaporized submicron perfluorocarbon droplets. Ultrasound Med Biol. 2014;40:1379–1384. doi: 10.1016/j.ultrasmedbio.2013.11.025. [DOI] [PubMed] [Google Scholar]
- 16.Couture O, Faivre M, Pannacci N, Babataheri A, Servois V, Tabeling P, Tanter M. Ultrasound internal tattooing. Med Phys. 2011;38:1116–1123. doi: 10.1118/1.3548068. [DOI] [PubMed] [Google Scholar]
- 17.Kaul S, Kelly P, Oliner JD, Glasheen WP, Keller MW, Watson DD. Assessment of regional myocardial blood flow with myocardial contrast two-dimensional echocardiography. J Am Coll Cardiol. 1989;13:468–482. doi: 10.1016/0735-1097(89)90528-7. [DOI] [PubMed] [Google Scholar]
Associated Data
This section collects any data citations, data availability statements, or supplementary materials included in this article.


