Significance
Close appositions between the endoplasmic reticulum (ER) and the plasma membrane in mammalian cells have essential roles in cellular lipid metabolism and in cytoplasmic calcium signaling. Although recent investigations have yielded considerable insight into the structural basis for lipid transfer at ER–plasma membrane junctions, little is known about the proteins that organize junctions for calcium signaling. Our data show that the ER membrane protein transmembrane protein 110 (TMEM110) supports the maintenance of ER–plasma membrane junctions competent for calcium signaling and acts in concert with other proteins in the dynamic remodeling of the junctions during signaling.
Keywords: STIM1, STIM2, ORAI, CRAC channel, store-operated calcium entry
Abstract
The stromal interaction molecule (STIM)–ORAI calcium release-activated calcium modulator (ORAI) pathway controls store-dependent calcium entry, a major mechanism of physiological calcium signaling in mammalian cells. The core elements of the pathway are the regulatory protein STIM1, located in the endoplasmic reticulum (ER) membrane, the calcium channel ORAI1 in the plasma membrane, and sites of close contact between the ER and the plasma membrane that permit the two proteins to interact. Research on calcium signaling has centered on STIM1, ORAI1, and a few proteins that directly modulate STIM–ORAI function. However, little is known about proteins that organize ER–plasma membrane junctions for STIM–ORAI-dependent calcium signaling. Here, we report that an ER-resident membrane protein identified in a previous genome-wide RNAi screen, transmembrane protein 110 (TMEM110), regulates the long-term maintenance of ER–plasma membrane junctions and the short-term physiological remodeling of the junctions during store-dependent calcium signaling.
Close contacts between the endoplasmic reticulum (ER) and the plasma membrane are the physical platform for stromal interaction molecule (STIM)–ORAI calcium release-activated calcium modulator (ORAI) signaling, a prominent pathway for physiological calcium entry in mammalian cells (1–4). Release of calcium from ER stores, triggered by physiological stimuli, causes the ER membrane protein STIM1 to accumulate at ER–plasma membrane junctions and to gate plasma membrane ORAI1 channels. The junctions establish a 15- to 20-nm spacing between membranes that STIM1 can bridge to interact with ORAI1 (5). At the same time, the individual junctions define a specialized local geometry that contributes to shaping cellular calcium signaling (6, 7).
Research into the cell biology of mammalian ER–plasma membrane junctions has benefited from parallels with the corresponding junctions in yeast. For example, the formation and maintenance of ER–plasma membrane junctions depends on tricalbins and other proteins in yeast cells (8–10) and in mammalian cells on the extended synaptotagmins (E-Syts), a family of three tricalbin homologs, and other unidentified proteins (11, 12). The insights from yeast extend to the mechanisms of cellular lipid metabolism and lipid transfer between the apposed bilayers that have been conserved from yeast cells to human cells (13–19). On the other hand, parallels with yeast are less informative about processes specific to mammalian cells, including the store-dependent calcium entry controlled by STIM–ORAI signaling.
We previously completed a genome-wide RNAi screen to identify modulators of cellular calcium signaling (20). The finding that septin scaffold proteins in the vicinity of ER–plasma membrane junctions rearrange as an immediate response to ER calcium store depletion (20) underscored the importance of local membrane organization in calcium signaling and led us to focus on predicted transmembrane proteins that were identified in the screen. Here we show that transmembrane protein 110 (TMEM110) is an ER-resident membrane protein that supports the maintenance of ER–plasma membrane junctions competent for STIM–ORAI signaling and that has a key role in the local remodeling of the junctions during physiological signaling.
Results
TMEM110 Modulates Cellular Calcium Signaling.
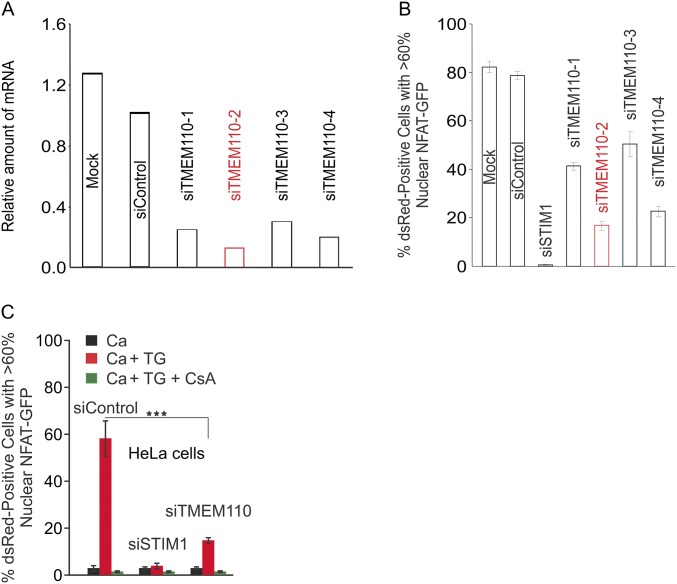
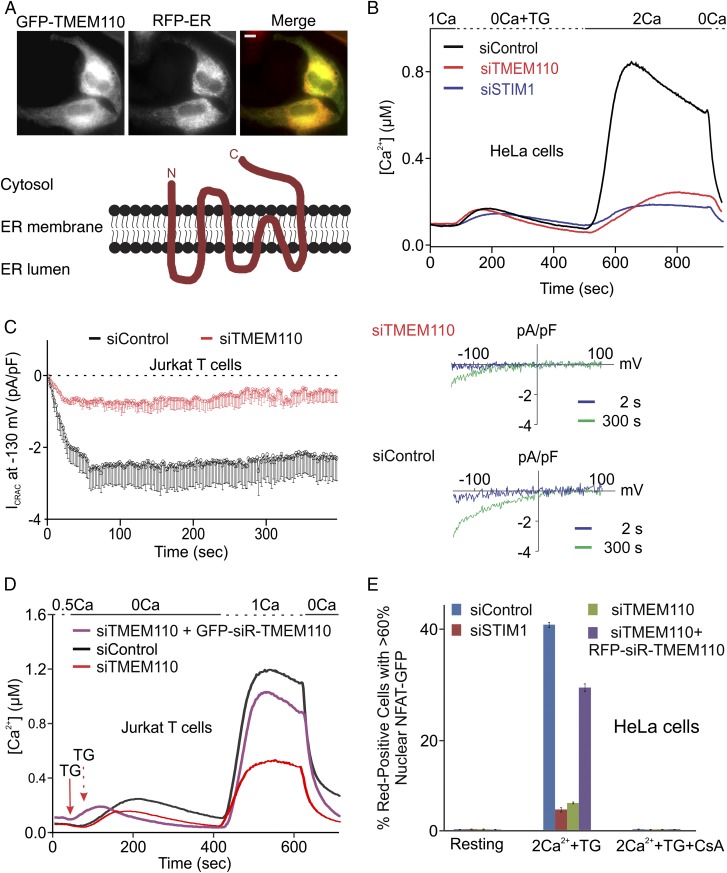
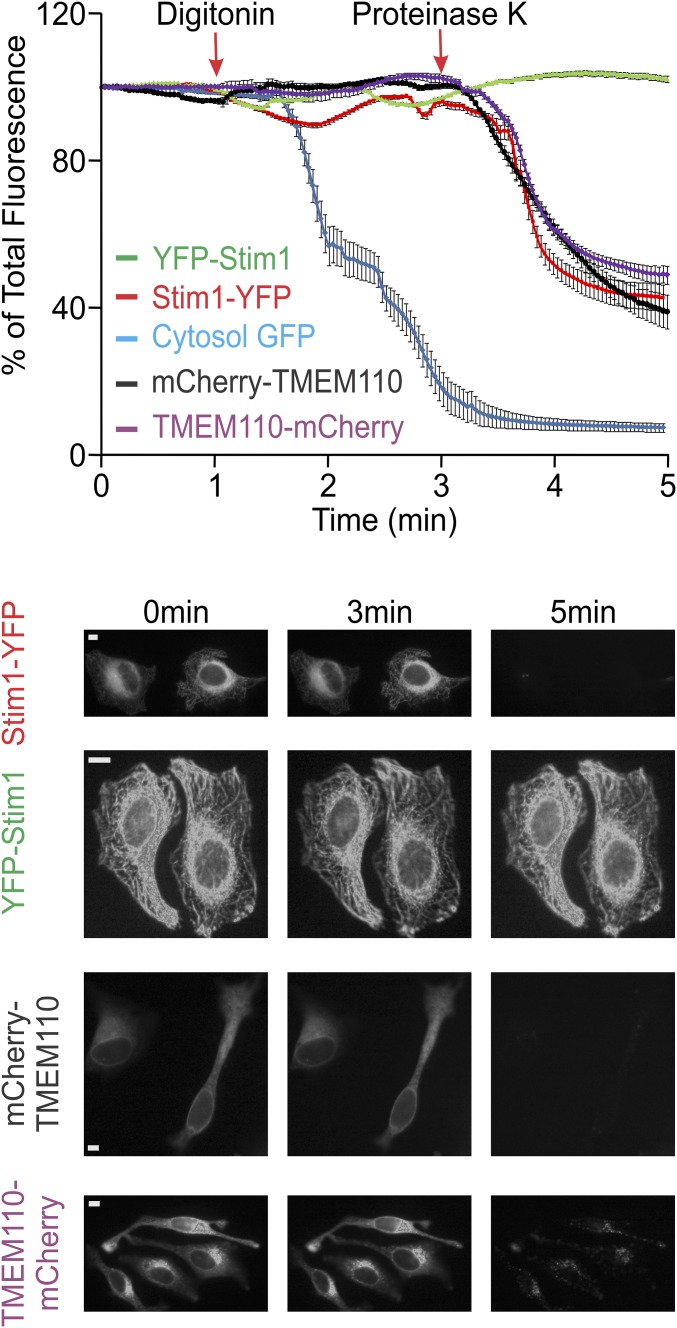
In the RNAi screen, treatment with a pool of four siRNAs directed to TMEM110 depressed activation of the calcium-sensitive transcription factor NFAT (nuclear factor of activated T cells) in response to ER calcium store depletion (20). Deconvolution showed that all four siRNAs in the pool were effective in reducing TMEM110 mRNA and in reducing NFAT nuclear import in response to stimulation (Fig. S1 A and B). More complete tests that included unstimulated cells and cyclosporin A (CsA)-treated cells as controls verified that the most effective siRNA, siTMEM110(#2), specifically reduced nuclear NFAT accumulation in stimulated HeLa cells (Fig. S1C). This individual siRNA was used for the experiments reported in this paper. Initial characterization showed that TMEM110 is an ER-localized membrane protein with cytoplasmic N and C termini (Fig. 1A and Fig. S2).
Fig. S1.
Deconvolution of TMEM110-specific siRNAs and nuclear translocation of NFAT1-GFP in siRNA-treated HeLa cells. (A) HeLa cells were untreated (Mock) or treated with nontargeting siRNA (siControl) or with siRNAs specific to TMEM110 (siTMEM110-1, -2, -3, -4) and were analyzed 3 d later by qRT-PCR for TMEM110 mRNA expression levels. (B) HeLa cells stably expressing NFAT1-GFP were cotransfected with DsRed-ER and siRNAs (siControl, siSTIM1, siTMEM110-1, -2, -3, -4) or were mock transfected. Cells were stimulated with TG in extracellular solution containing 2 mM Ca2+. (C) As in B, cells were cotransfected with DsRed-ER and the indicated siRNA. Cells were left unstimulated or were stimulated with TG with or without CsA. (siControl vs. siTMEM110, ***P < 0.001). Error bars report SEM.
Fig. 1.
TMEM110 regulates ORAI1 channel activation. (A, Upper) Representative epifluorescence pictures of HeLa cells cotransfected with GFP-TMEM110 and RFP-ER expression plasmids. (Lower) Cartoon illustrating the experimentally determined localization of TMEM110 to the ER, with its N-terminal and C-terminal regions projecting into the cytosol. The cartoon places transmembrane segments predicted by TMHMM2.0 (45) in the bilayer, but the actual disposition of transmembrane regions is unknown. (B) Averaged single-cell intracellular calcium concentrations ([Ca2+]i) in fura-2–loaded HeLa cells stimulated with TG as indicated. Cells were treated for 72 h with control siRNA (siControl, n = 220, black trace), TMEM110 siRNA (siTMEM110, n = 140, red trace), or STIM1 siRNA (siSTIM1, n = 150, blue trace). (C, Left) CRAC channel current density (Icrac) at −130 mV in Jurkat T cells treated with siRNAs (siControl, n = 12; siTMEM110, n = 18; P < 0.001 at 300 s). (Right) Representative leak-subtracted current–voltage relationships obtained at 2 s and 300 s after break-in. (D) As in B, for Jurkat T cells treated with siControl (n = 155, black trace) or siTMEM110 (n = 95, red trace) alone or cotransfected with a plasmid encoding full-length siRNA-resistant GFP-TMEM110 (GFP-siR-TMEM110, n = 85, purple trace). (E) HeLa cells stably expressing NFAT1-GFP were transfected with the siRNAs indicated, alone or together with a plasmid encoding RFP-siR-TMEM110. Cells were stimulated with TG, with or without CsA. Error bars report SEM. (Scale bar, 1 µm.)
Fig. S2.
FPP analysis of TMEM110 topology in the ER. (Upper) Averaged normalized total fluorescence of HeLa cells expressing cytosolic GFP (blue trace, n = 50), C-terminally labeled STIM1-YFP (red trace, n = 80), N-terminally labeled YFP-STIM1 (green trace, n = 100), N-terminally labeled mCherry-TMEM110 (black trace, n = 70), or C-terminally labeled TMEM110-mCherry (purple trace, n = 85) and treated with digitonin and proteinase K at the times indicated. Error bars report SEM values. (Lower) Representative epifluorescence images of HeLa cells from the above FPP experiment. (Scale bars, 1 µm.)
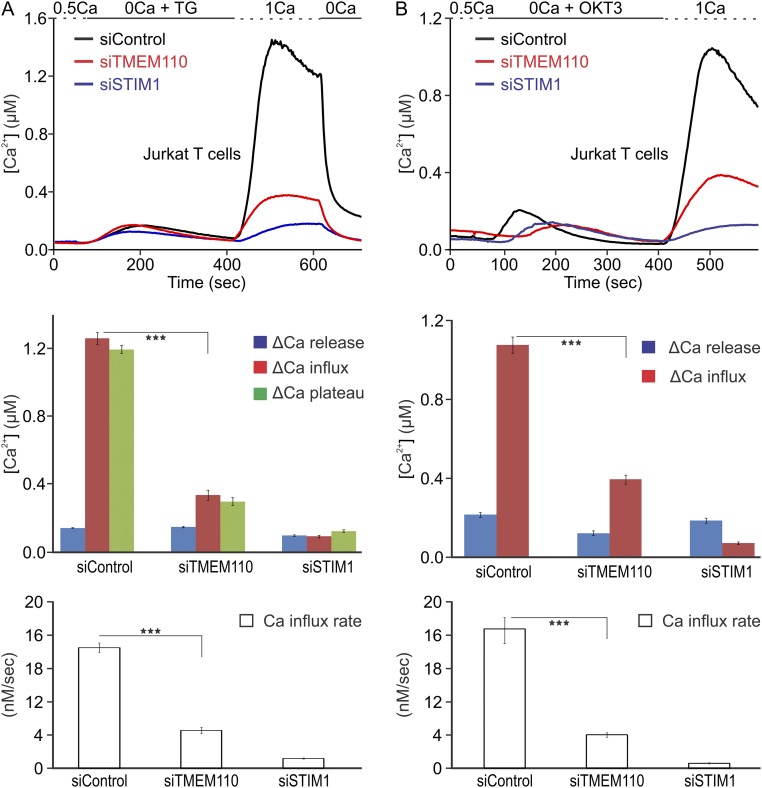
Compromised NFAT nuclear localization can, in principle, reflect either interference with signaling upstream of calcium entry or interference with NFAT activation despite normal calcium entry. To define the cellular role of TMEM110 more precisely, we examined cytoplasmic calcium responses in control and siTMEM110-treated cells. Depleting TMEM110 sharply reduced store-dependent calcium entry in HeLa cells (Fig. 1B). TMEM110 depletion had a similar effect in Jurkat T cells, whether store-dependent calcium entry was triggered by treatment with the SERCA (sarco/endoplasmic reticulum Ca++-ATPase) inhibitor thapsigargin (TG) (Fig. S3A) or by stimulation through the T-cell receptor (Fig. S3B). The direct target is STIM–ORAI signaling, rather than other proteins involved in cellular calcium handling or in setting cell membrane potential, because depletion of TMEM110 reduced the classical calcium release-activated calcium (CRAC) current in Jurkat T cells (Fig. 1C). Crucially, expression of RNAi-resistant TMEM110 restored store-dependent calcium entry in Jurkat T cells (Fig. 1D) and restored store-dependent NFAT nuclear import in HeLa cells (Fig. 1E). Although these findings do not rule out a separate effect downstream of calcium entry, the findings collectively establish that a major role of TMEM110 is to modulate the STIM–ORAI pathway of calcium entry.
Fig. S3.
Store-operated calcium entry in TMEM110-depleted Jurkat T cells. (A, Top) Averaged single-cell [Ca2+]i in siRNA-treated, fura-2–loaded Jurkat T cells stimulated with TG. Cells were treated for 72 h with control siRNA (siControl, n = 189, black trace), TMEM110 siRNA (siTMEM110, n = 150, red trace) or STIM1 siRNA (siSTIM1, n = 180, blue trace). (Middle) Quantification of the [Ca2+]i increase caused by Ca2+ release from the ER following TG stimulation in the absence of extracellular Ca2+ (∆Ca release) and Ca2+ entry at 100 s (∆Ca influx, siTMEM110 vs. siControl, ***P < 0.001) and at 200 s (∆Ca plateau) after readdition of solution containing 1 mM Ca2+, in Jurkat T cells treated with the indicated siRNAs. (Bottom) Initial rates of [Ca2+]i increase after the readdition of solution containing 1 mM Ca2+ (siTMEM110 vs. siControl, ***P < 0.001). (B) As in A, except that Jurkat T cells were stimulated with OKT3 antibody, which activates the cells by engaging the T-cell receptor–CD3 complex. (Top) Averaged single-cell calcium concentrations (siControl, n = 110; siTMEM110, n = 210; siSTIM1, n = 95). (Middle) Quantification of [Ca2+]i increase caused by Ca2+ release from the ER following OKT3 stimulation (∆Ca release) and by Ca2+ entry through ORAI1 channels (∆Ca influx, siTMEM110 vs. siControl, ***P < 0.001) in Jurkat T cells treated with the indicated siRNAs. (Bottom) Initial rates of [Ca2+]i increase after the readdition of solution containing 1 mM Ca2+ (siTMEM110 vs. siControl, ***P < 0.001). Error bars report SEM.
TMEM110 Is Required for Efficient STIM1 Relocalization to ER–Plasma Membrane Junctions.
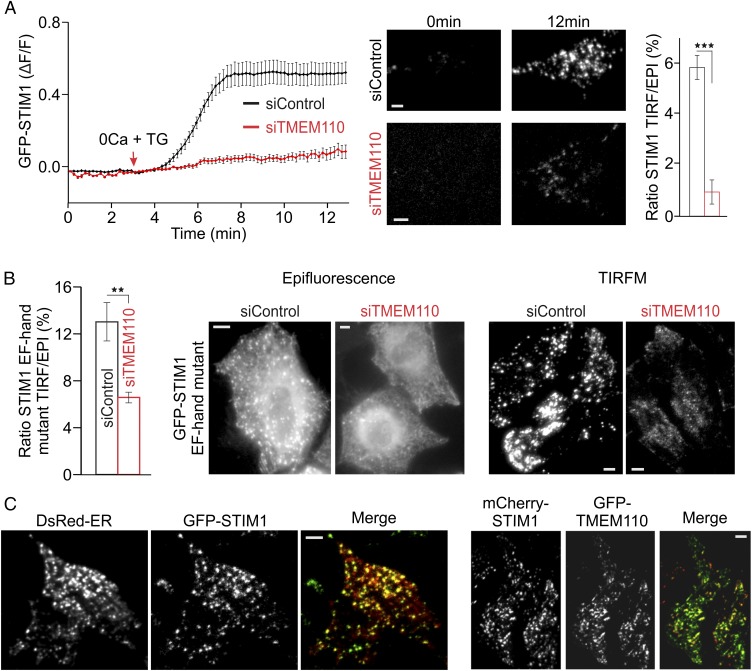
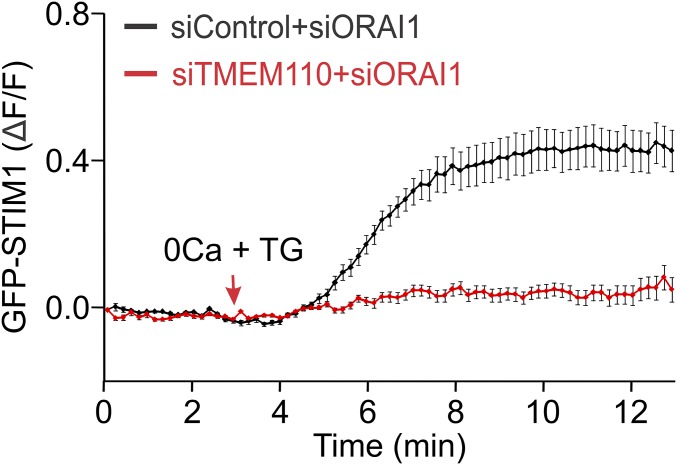
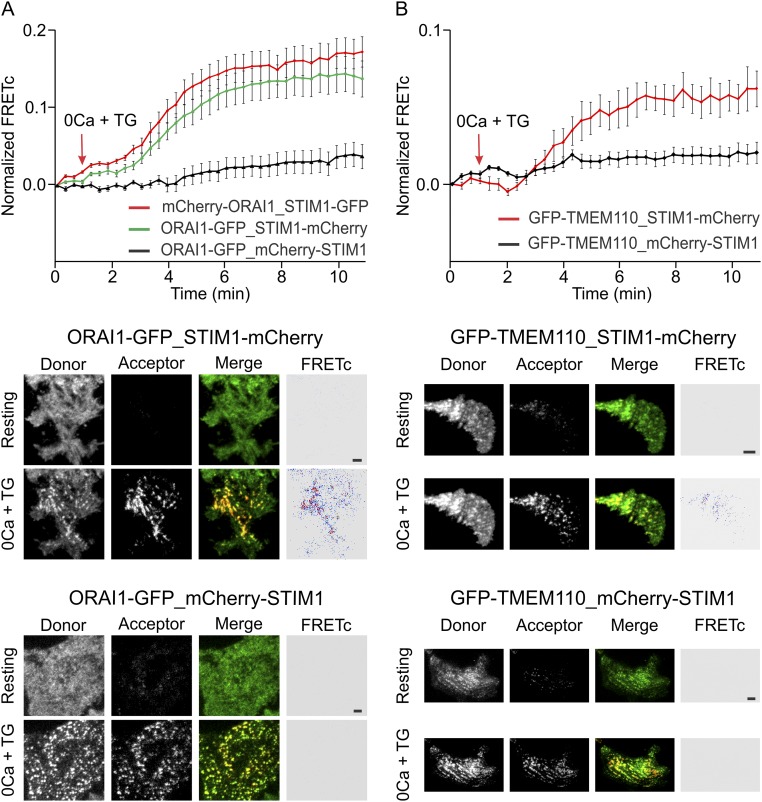
Further experiments implicated TMEM110 in an early step in STIM1 activation. Movement of STIM1 to the total internal reflection fluorescence (TIRF) layer—a commonly used measure reflecting STIM1 activation and relocalization to junctions—was impaired by depletion of TMEM110 (Fig. 2A). Likewise, constitutive localization of the calcium binding-deficient, and therefore activated, mutant STIM1(D76A) to the TIRF layer was impaired by the depletion of TMEM110 (Fig. 2B). STIM–ORAI interaction can aid in STIM1 relocalization under certain circumstances (21), but ORAI1 was not overexpressed with STIM1 or STIM1(D76A) proteins in these experiments, implying that TMEM110 has a hand in controlling the relocalization of STIM1 itself. This conclusion is strengthened further by the strong effect of siTMEM110 on STIM1 relocalization in cells depleted of ORAI1 (Fig. S4). TMEM110 and STIM1 are present at the same ER–plasma membrane junctions in stimulated cells (Fig. 2C and Fig. S5), raising the possibilities that TMEM110 could be acting on STIM1 to stabilize its presence at junctions, could be stabilizing the junctions themselves, or both.
Fig. 2.
TMEM110 controls the translocation of STIM1. (A, Left) Averaged kinetics of GFP-STIM1 fluorescence increase (ΔF/F) at the TIRF layer in siRNA-treated HeLa cells stimulated with TG beginning at the time indicated. (Center) Representative TIRFM images of siControl- or siTMEM110-treated cells before (0 min) and after (12 min) TG stimulation. (Right) Averaged ratio of GFP-STIM1 fluorescence at the TIRF layer to total cellular GFP-STIM1 fluorescence at the 12-min time point (Materials and Methods) (siControl, n = 80; siTMEM110, n = 55; ***P < 0.001). (B, Left) Averaged ratio of GFP-STIM1 EF-hand mutant fluorescence at the TIRF layer to total cellular fluorescence in unstimulated siRNA-treated HeLa cells (siControl, n = 22; siTMEM110, n = 44; **P < 0.01). (Right) Representative epifluorescence and TIRFM images of the cells. (C) Representative TIRFM images of HeLa cells coexpressing DsRed-ER and GFP-STIM1 (Left) or mCherry-STIM1 and GFP-TMEM110 (Right) after 10-min TG stimulation. Pearson’s correlation coefficients were 0.82 (ER vs. STIM1) and 0.76 (TMEM110 vs. STIM1). Error bars report SEM. (Scale bars, 1 µm.)
Fig. S4.
TMEM110 controls the translocation of STIM1 toward the plasma membrane in ORAI1-depleted cells. Averaged kinetics of GFP-STIM1 fluorescence increase (ΔF/F) at the TIRF layer in HeLa cells that had been treated with siORAI1 and siControl (n = 24) or with siORAI1 and siTMEM110 (n = 18). Cells were stimulated with TG beginning at the time indicated.
Fig. S5.
TMEM110-STIM1 FRET confirms that the proteins are present at the same junctions in stimulated cells. (A, Upper) Averaged kinetics of corrected FRET (FRETc) increase at the TIRF layer in HeLa cells cotransfected with C-terminally labeled ORAI1-GFP and C-terminally labeled STIM1-mCherry (green trace, n = 25), N-terminally labeled mCherry-ORAI1 and C-terminally labeled STIM1-GFP (red trace, n = 32), or C-terminally labeled ORAI1-GFP and N-terminally labeled mCherry-STIM1 (black trace, n = 22). Cells were stimulated with TG at the time indicated. Error bars report SEM. (Lower) Representative TIRFM images of donor (GFP), acceptor (mCherry), merged, and FRETc channels after 10 min TG stimulation of HeLa cells cotransfected with the indicated plasmids. The expected STIM–ORAI and ORAI-STIM FRET validate the conditions used for the FRET experiments. (Scale bars, 1 μM.) (B, Upper) Averaged kinetics of FRETc increase at the TIRF layer in HeLa cells cotransfected either with N-terminally labeled GFP-TMEM110 and C-terminally labeled STIM1-mCherry (red trace, n = 15) or with N-terminally labeled GFP-TMEM110 and N-terminally labeled mCherry-STIM1 (black trace, n = 20) and stimulated with TG as indicated. Error bars report SEM. (Lower) Representative TIRFM images of donor (GFP), acceptor (mCherry), merged, and FRETc channels after 10-min TG stimulation of HeLa cells cotransfected with the indicated plasmids. Without further controls, it cannot be concluded that there is a direct protein–protein interaction, because FRET also could result from the increased local concentration of STIM1 in junctional ER. However, the result does provide additional confirmation that TMEM110 and STIM1 are present at the same ER–plasma membrane junctions in stimulated cells. (Scale bars, 1 μM.)
TMEM110 Depletion Results in a Measurable Loss of ER–Plasma Membrane Junctions.
Several approaches have been developed to investigate ER–plasma membrane junctions in living cells independently of monitoring STIM1 accumulation (20, 22, 23). A useful approach, in our hands, has been to follow DsRed-ER or RFP-ER markers by TIRF microscopy (Fig. 2C and see below) (20). The TIRF-layer ER signal does have the limitation of including contributions both from true cortical ER in close contact with the plasma membrane (5, 11, 12, 24, 25) and from adjacent ER that is within the TIRF layer. However, its unmatched advantage, which came into sharp focus as the experiments progressed, is the ability to monitor near-plasma membrane ER over the entire footprint of a cell, with high spatial resolution and over the time course of a physiological response.
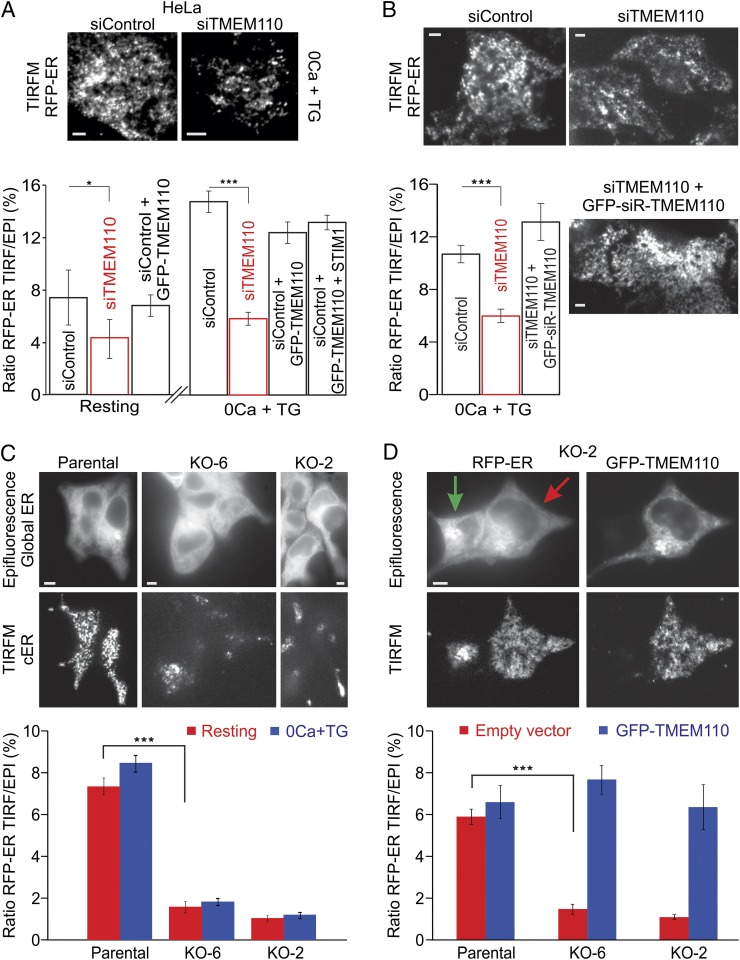
HeLa cells depleted of endogenous TMEM110 had less TIRF-layer ER fluorescence as a percentage of total ER fluorescence than did control cells (Fig. 3A), both at rest and after store depletion. Expressing RNAi-resistant TMEM110 restored the level of TIRF-layer ER fluorescence (Fig. 3B). TMEM110−/− HEK293 cells produced by CRISPR-Cas9 targeting (23) also had considerably less TIRF-layer ER fluorescence than the parental HEK293 cells (Fig. 3C), and expression of TMEM110 again rescued TIRF-layer ER fluorescence (Fig. 3D). The reduction in TIRF-layer ER signal in our assay is more pronounced than the decrease in cortical ER previously reported for the same TMEM110−/− cells (23), apparently reflecting technical differences between the assays. We conclude from our data that reducing the level of TMEM110 below normal cellular levels leads to an appreciable loss of near-plasma membrane ER. Tellingly, however, we did not see an increased TIRF-layer ER signal in control HeLa cells when GFP-TMEM110 was overexpressed at modest levels (Fig. 3A), indicating that cellular proteins other than TMEM110 could be limiting for the formation or maintenance of junctions.
Fig. 3.
TMEM110 contributes to the maintenance of cortical ER. (A, Upper) Representative TIRFM images of RFP-ER in siRNA-treated HeLa cells. Cells were treated with TG for 10 min. (Lower) Averaged ratio of RFP-ER fluorescence at the TIRF layer to total RFP-ER fluorescence in siRNA-treated HeLa cells before stimulation (siControl, n = 32; siTMEM110, n = 45; *P = 0.05) and after 10-min TG stimulation (siControl, n = 20; siTMEM110, n = 22; ***P < 0.001). Data also are shown for siRNA-treated HeLa cells transfected with GFP-TMEM110 or with GFP-TMEM110 and unlabeled STIM1 expression plasmids (siControl + GFP-TMEM110, resting, n = 18; siControl + GFP-TMEM110, 0 Ca +TG, n = 15; siControl + GFP-TMEM110 + STIM1, 0 Ca +TG, n = 17). (B) Representative TIRFM images of RFP-ER marker in siRNA-treated HeLa cells transfected with RFP-ER expression plasmid and, where indicated, with an siRNA-resistant GFP-TMEM110 expression plasmid (GFP-siR-TMEM110). Images are from the 10-min time point during stimulation with TG. (Lower Left) Averaged ratio of RFP-ER fluorescence at the TIRF layer to total RFP-ER fluorescence in these HeLa cells after 12-min TG stimulation (siControl, n = 30; siTMEM110, n = 21; siTMEM110 + GFP-siR-TMEM110, n = 24; siControl vs. siTMEM110, ***P < 0.001). (C, Upper) Representative epifluorescence and TIRFM images of RFP-ER in parental control cells and two independent TMEM110−/− HEK293 cell lines (KO-2 and KO-6). (Lower) Averaged ratio of RFP-ER fluorescence at the TIRF layer to total RFP-ER fluorescence before stimulation (control, n = 42; KO-6, n = 38, KO-2, n = 30; control vs. KO-6, ***P < 0.001) and after TG stimulation. (D, Upper) Representative epifluorescence and TIRFM images of the TMEM110−/− cell line KO-2 cotransfected with RFP-ER and GFP-TMEM110 expression plasmids. The green arrow indicates a cell expressing RFP-ER only, in which TIRF-layer fluorescence is not restored; the red arrow indicates a cell expressing both proteins. (Lower) Averaged ratio of RFP-ER fluorescence at the TIRF layer to total RFP-ER fluorescence in cells cotransfected with empty vector (control, n = 25; KO-6, n = 30, KO-2, n = 11; control vs. KO-6, ***P < 0.001) or with GFP-TMEM110 expression plasmid (control, n = 9; KO-6, n = 11; KO-2, n = 14; control vs. KO-6, P = 0.327). Error bars report SEM. (Scale bars, 1 µm.)
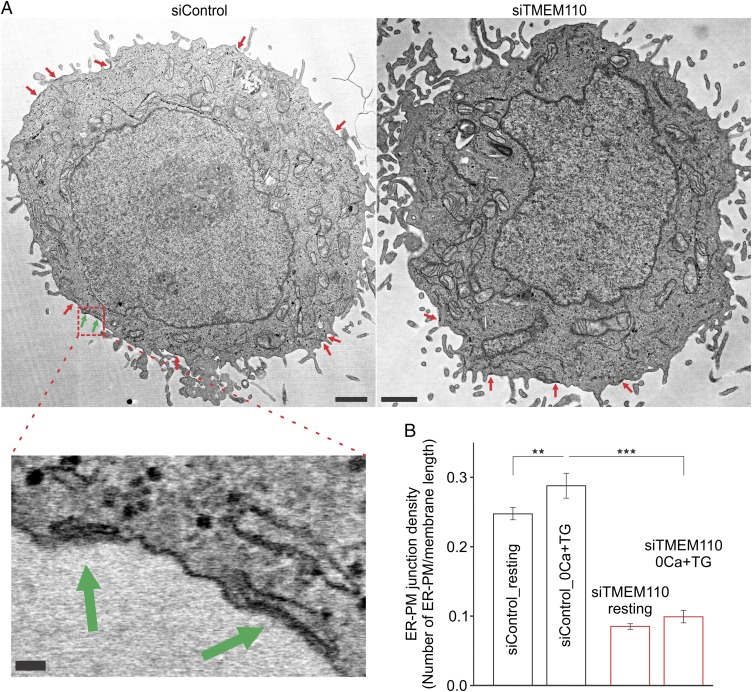
We complemented the TIRF microscopy (TIRFM) experiments with electron microscopy to examine ER–plasma membrane junctions specifically. In these experiments, we scored ER–plasma membrane contacts with a spacing less than 20 nm as junctions (Fig. 4). siTMEM110-treated HeLa cells had fewer ER–plasma membrane junctions per μm plasma membrane than control HeLa cells in both unstimulated and store-depleted conditions (Fig. 4). Electron microscopy secondarily confirmed a previous report that ER–plasma membrane junctions increase in HeLa cells after store depletion (24). The main conclusion, however, is that HeLa cells require TMEM110 to maintain a normal complement of ER–plasma membrane junctions.
Fig. 4.
TMEM110 contributes to the maintenance of ER–plasma membrane junctions defined ultrastructurally. (A) Representative electron microscope images of HeLa cells treated with control (Left) or TMEM110 (Right) siRNAs. (Scale bars, 1 µm.) (Lower Left) Magnified view: two ER–plasma membrane junctions identified within the region outlined by a red dashed line in the siControl cell. (Scale bar, 50 nm.) (B) Averaged ER–plasma membrane junction density per μm in siRNA-treated HeLa cells before and after TG stimulation (siControl, resting, n = 22; siTMEM110, resting, n = 33; siControl, TG, n = 23; siTMEM110, TG, n = 28; for siControl, 0 Ca2++TG vs. resting, **P < 0.01; for TG-stimulated cells, siTMEM110 vs. siControl, ***P < 0.001). Error bars report SEM.
Restoring Junctions Partially Reverses the Effects of TMEM110 Depletion.
To test whether loss of junctions in itself contributes to the impairment of calcium signaling, we sought to restore junctions in a way that is neutral with respect to STIM–ORAI signaling. Ist2 is an ER membrane protein in Saccharomyces cerevisiae that acts as an ER–plasma membrane tether (9, 10). Yeast lack STIM–ORAI proteins and ER store-dependent calcium signaling, and the Ist2 homologs in mammals—the TMEM16 family—are plasma membrane Cl− channels or phospholipid scramblases (26) that have lost the long unstructured cytoplasmic region and polybasic C-terminal tail essential to the tethering function in the yeast protein (27, 28). Thus, there is no reason to expect that Ist2 would interact with STIM, ORAI, or mammalian proteins dedicated to STIM–ORAI signaling.
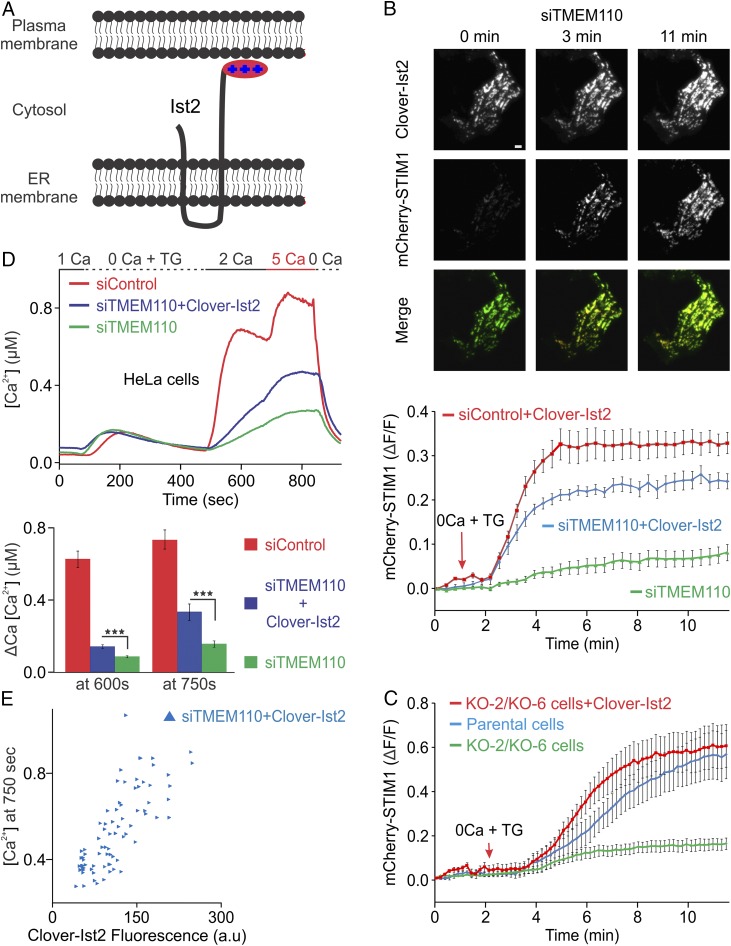
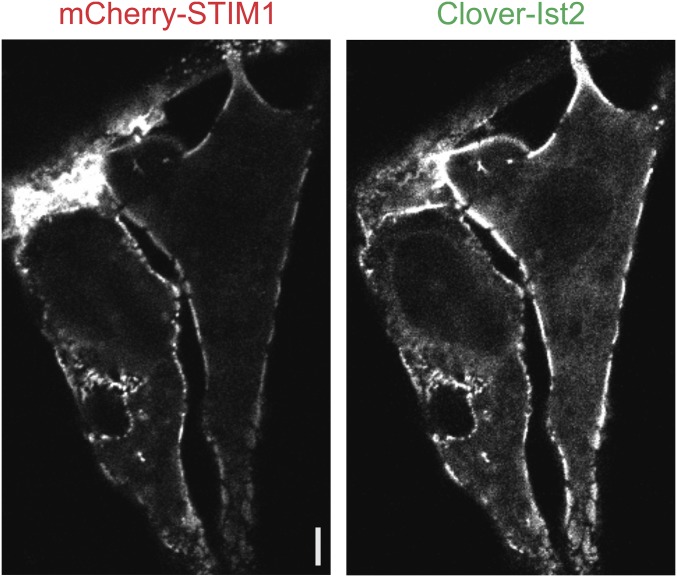
We expressed a Clover-labeled fragment of yeast Ist2, consisting of its last two transmembrane segments and its C-terminal cytoplasmic region (Fig. 5A), in HeLa cells depleted of TMEM110 or in HEK293 cells entirely lacking the protein. This fragment has been shown previously to increase ER–plasma membrane junctional area in mammalian cells (29). Initial experiments confirmed the expected cortical localization of Ist2 expressed in HeLa cells (Fig. S6), and expression of the engineered Ist2 supported the formation of extensive cortical ER in siTMEM110-treated HeLa cells as intended (Fig. 5B). In the critical experiments, Ist2 expression partially rescued STIM1 relocalization in response to store depletion in siTMEM110-treated HeLa cells (Fig. 5B) and completely rescued STIM1 movement in TMEM110−/− HEK293 cells (Fig. 5C), potentially because of a higher level of expression of Ist2 in HEK293 cells.
Fig. 5.
The yeast ER–plasma membrane tether Ist2 partially restores Ca2+ signaling. (A) Cartoon of the truncated Ist2(490–946) protein at an ER–plasma membrane junction. The N-terminal Clover label is not depicted. (B, Upper) Representative TIRFM images of an siTMEM110-treated HeLa cell expressing Clover-Ist2 and mCherry-STIM1 before stimulation (0 min) and after stimulation with TG for 3 and 11 min. (Lower) Averaged increase in mCherry-STIM1 fluorescence (ΔF/F) at the TIRF layer after stimulation with TG beginning at the time indicated (siTMEM110, n = 19; siTMEM110 + Clover-Ist2, n = 28; siControl + Clover-Ist2, n = 23). (C) Averaged increase in mCherry-STIM1 fluorescence at the TIRF layer, as in B, in parental control HEK293 cells, in the TMEM110−/− cell lines KO-2 and KO-6, and in TMEM110−/− cells expressing Clover-Ist2 (control, n = 13; KO cells, n = 18; KO cells + Clover-Ist2, n = 11). (D, Upper) Averaged single-cell [Ca2+]i in fura-2–loaded HeLa cells stimulated with TG as indicated. Cells were treated for 72 h with siControl (n = 137, red trace), siTMEM110 (n = 133, green trace), or siTMEM110 + Clover-Ist2 expression plasmid (n= 77, blue trace). (Lower) [Ca2+]i increase (∆Ca) after the readdition of solution containing 2 mM Ca2+ (at 600 s, siTMEM110 + Clover-Ist2 vs. siTMEM110, ***P < 0.001) or 5 mM Ca2+ (at 750 s, siTMEM110 + Clover-Ist2 vs. siTMEM110, ***P < 0.001). (E) [Ca2+]i at 750 s plotted against Clover-Ist2 fluorescence for single HeLa cells in D expressing Clover-Ist2. Error bars report SEM. (Scale bar, 1 µm.)
Fig. S6.
A C-terminal fragment of yeast Ist2, an ER–plasma membrane-tethering protein, preferentially localizes to the cortical regions of HeLa cells, as previously reported. Shown is a representative confocal section in the equatorial plane of HeLa cells expressing mCherry-STIM1 and Clover-Ist2(490–946) proteins after 10-min stimulation with TG. (Scale bar, 1 µm.)
The restored junctions were functional in STIM–ORAI signaling. Ist2 expression partially rescued store-dependent calcium entry in TMEM110-depleted HeLa cells (Fig. 5D), with the extent of rescue correlating with the level of Ist2 expression (Fig. 5E). The correlation suggests that increased junctional area is one factor in restoring STIM–ORAI signaling. However, even in cells with the brightest Clover-Ist2 signal, cytoplasmic calcium did not reach the highest levels observed in control cells. The latter finding might indicate that TMEM110 contributes to signaling by an additional mechanism besides maintaining junctional area, for example by favoring an active conformation of STIM1 (23) or by acting with other proteins at the junction to promote STIM–ORAI signaling.
TMEM110 Plays a Role in the Acute Rearrangement of TIRF-Layer ER.
Time-series analysis of the response to store depletion in living cells brought out another unexpected aspect of TMEM110 function. The TIRF-layer ER signal in control HeLa cells or in control parental HEK293 cells increased during the first several minutes after store depletion (Fig. 6 A and B) in line with the rearrangement of cortical ER that has been described in the literature (5, 12, 22, 24, 25). In contrast, in siTMEM110-treated HeLa cells and in TMEM110−/− HEK293 cells there was no net increase in TIRF-layer ER fluorescence after store depletion (Fig. 6 A and B). Expression of RNAi-resistant TMEM110 in TMEM110-depleted HeLa cells restored the increase (Fig. 6C). These findings reveal an acute rearrangement of cortical ER during store-dependent signaling that is specifically dependent on TMEM110.
Fig. 6.
TMEM110 regulates cortical ER rearrangement after store depletion. (A) Averaged increase in RFP-ER fluorescence (ΔF/F) at the TIRF layer in control (siControl, n = 23) and TMEM110-depleted (siTMEM110, n = 17) HeLa cells, following TG stimulation at the time indicated. (B) Averaged increase in RFP-ER fluorescence (ΔF/F) at the TIRF layer in parental control (n = 13, red trace) and TMEM110−/− HEK293 cells (KO-2, n = 15, green trace; KO-6, n = 26, blue trace) following TG stimulation beginning at the time indicated. The cells were bathed in nominally Ca2+-free medium during these observations. (C) As in A, but for HeLa cells treated with control or TMEM110 siRNAs and transfected with expression plasmid encoding either full-length siRNA-resistant GFP-TMEM110 (+TMEM110) or truncated siRNA-resistant GFP-TMEM110(∆211–294) lacking the cytosolic C terminus (+TMEM110∆C) (siControl, n = 15; siTMEM110 + GFP-siR-TMEM110, n = 18; siTMEM110 + GFP-siR-TMEM110∆C, n = 12). Error bars report SEM.
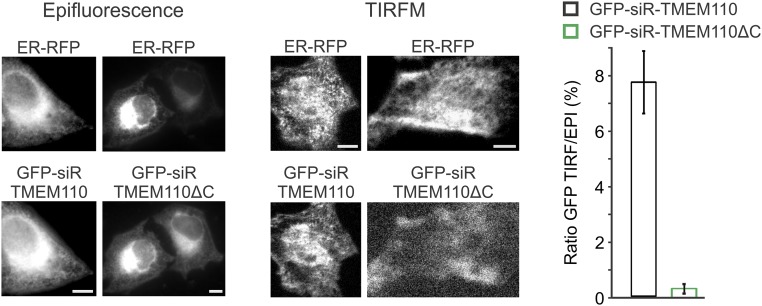
An instructive sidelight is that RNAi-resistant TMEM110ΔC lacking cytoplasmic region residues 210–294 did not substitute for full-length TMEM110 in restoring the store-dependent rearrangement of cortical ER (Fig. 6C). Failure of TMEM110ΔC in this assay correlates with the observations that fluorescent TMEM110ΔC in resting cells localized in the ER with very little signal in the TIRF layer and that store depletion did not increase TIRF-layer TMEM110ΔC fluorescence (Fig. S7). Thus, the C-terminal region of TMEM110 is apparently important for its functions at ER–plasma membrane junctions, providing a starting point for future detailed exploration of the mechanisms involved.
Fig. S7.
Localization of TMEM110 and TMEM110ΔC in HeLa cells. Representative epifluorescence (Left) or TIRFM (Center) images of HeLa cells expressing GFP-siR-TMEM110 or GFP-siR-TMEM110∆C and RFP-ER. (Right) Averaged percentage of total GFP-siR-TMEM110 (n = 15) and GFP-siR-TMEM110ΔC (n = 25) fluorescence at the TIRF layer. The cells were bathed in nominally Ca2+-free medium during these observations. Error bars report SEM. (Scale bars, 1 µm.)
STIM1 and STIM2 Contribute Differentially to Junctional Remodeling.
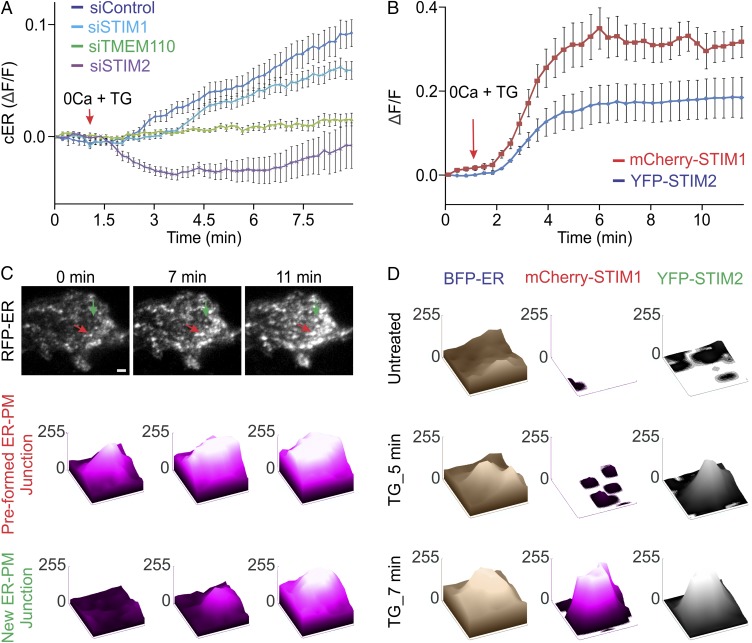
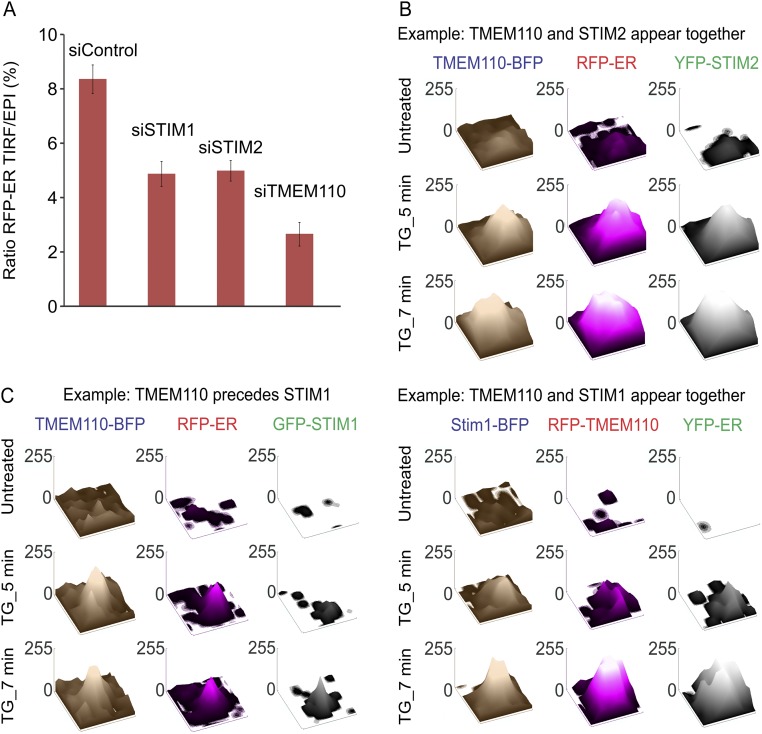
TMEM110 is unlikely to act alone in the maintenance and reorganization of cortical ER, especially given that modest overexpression of TMEM110 by itself did not increase TIRF-layer ER fluorescence (Fig. 3A). BecauseTMEM110 has been shown to interact with STIM1 and favor its active conformation (23), we compared the effects of siTMEM110, siSTIM1, and siSTIM2 treatments on TIRF-layer ER dynamics (Fig. 7A). In control cells treated with siTMEM110, TIRF-layer ER fluorescence was reduced, and no remodeling of the cortical and near-cortical ER was detected, as expected from the results above. siSTIM1 and siSTIM2 treatments both resulted in some decrease in TIRF-layer ER fluorescence (Fig. S8A), and siSTIM1 treatment caused a modest delay and attenuation of remodeling. The most striking observation, however, was that the siSTIM1 and siSTIM2 treatments had opposite effects on the dynamics: Exposure to TG still triggered a net increase in TIRF-layer ER fluorescence after STIM1 depletion but resulted in a net decrease after STIM2 depletion.
Fig. 7.
TMEM110 and STIM2 at emerging ER–plasma membrane junctions after store depletion. In all cases, the cells were bathed in nominally Ca2+-free medium. (A) Averaged increase in RFP-ER fluorescence (ΔF/F) at the TIRF layer following TG stimulation in HeLa cells that had been treated with siControl (n = 18), siSTIM1 (n = 17), siSTIM2 (n = 22), or siTMEM110 (n = 20). (B) Averaged increase in fluorescence (ΔF/F) of mCherry-STIM1 (n = 9) and YFP-STIM2 (n = 9) at the TIRF layer in cotransfected HeLa cells stimulated with TG beginning at the time indicated. (C, Upper) Representative TIRFM images of a HeLa cell expressing RFP-ER marker before (0 min) and after (7 and 11 min) TG stimulation. The red arrow indicates an ER–plasma membrane junction clearly visible before stimulation; the green arrow indicates an emerging ER–plasma membrane junction. (Scale bar, 1 µm.) (Lower) Surface plots of RFP-ER pixel intensities in small areas (0.3 × 0.32 µm) surrounding the two junctions labeled by arrows in the TIRFM images. (D) Surface plots of BFP-ER, mCherry-STIM1, and YFP-STIM2 pixel intensities in a small area (0.35 × 0.39 µm) surrounding an emerging junction (representative of n = 11 junctions from two cells) before and after TG stimulation. Error bars report SEM.
Fig. S8.
TMEM110, STIM1, and STIM2 at emerging ER–plasma membrane junctions. In all cases, the cells were bathed in nominally Ca2+-free medium. (A) Averaged percentage of RFP-ER fluorescence at the TIRF layer in resting HeLa cells that had been treated with control, STIM1, STIM2, or TMEM110 siRNAs. Error bars report SEM. (B) Surface plots of TMEM110-BFP, RFP-ER, and YFP-STIM2 pixel intensities from TIRFM images in a small area (0.35 × 0.55 µm) surrounding an emerging junction (representative of n = 15 junctions from five cells) before and after TG stimulation. (C) As in B, except that the cells expressed different combinations of fluorescently labeled proteins. (Left) Surface plots of TMEM110-BFP, RFP-ER, or GFP-STIM1 pixel intensities in a 0.5 × 0.9 µm area that includes an emerging junction (representative of n = 21 junctions from four cells). (Right) Surface plots of STIM1-BFP, RFP-TMEM110, and YFP-ER pixel intensities in a 0.3 × 0.42 µm area that includes an emerging junction (representative of n = 7 junctions from one cell).
We investigated whether we could detect a corresponding difference in the dynamic behavior of STIM1 and STIM2 at ER–plasma membrane junctions. In an initial analysis, the kinetics of STIM1 and STIM2 movements in the minutes after store depletion were similar when averaged over the entire cell footprint (Fig. 7B). We considered, however, that the similar global kinetics might reflect the stability of most ER–plasma membrane junctions over the short time frame of these experiments, and thus the kinetics of the overall fluorescence changes might depend mainly on processes other than junctional remodeling, e.g., on the rates of STIM1 and STIM2 diffusion. Therefore we concentrated on the small subset of “emerging” junctions,” defined empirically as sites with little or no ER marker fluorescence before stimulation and with a clear signal developing during the period of observation (Fig. 7C and Materials and Methods). Here, ER rearrangement rather than STIM1 and STIM2 diffusion might dominate the kinetics. Indeed, we found a striking difference in the onset of local fluorescence signals at emerging junctions, with STIM2 preceding STIM1 in most cases (Fig. 7D). Parallel examination of a limited sample of cells coexpressing the fluorescently labeled pairs TMEM110–STIM1 and TMEM110–STIM2 bore out this finding. STIM2 usually appeared at emerging junctions simultaneously with TMEM110, although the two proteins were not always precisely colocalized (Fig. S8B). In contrast, TMEM110 preceded STIM1 at emerging junctions or, less commonly in our sample, TMEM110 and STIM1 appeared simultaneously (Fig. S8C). These observations support the conclusion that STIM1 and STIM2 have distinguishable functions in the remodeling of ER–plasma membrane junctions and raise the possibility that TMEM110 may cooperate with STIM2 and other unidentified proteins in the early steps of junctional remodeling.
Discussion
Store-dependent calcium signaling has been grafted evolutionarily onto an existing cellular structure—the ER–plasma membrane junction—whose ancestral functions, shared from yeast to mammals, include lipid transfer between the apposed bilayers. Calcium signaling evidently has been integrated seamlessly with lipid transfer, rather than partitioned to a distinct subset of junctions, because STIM1 and TMEM110 are detected after store depletion at nearly all ER–plasma membrane contacts identifiable by TIRFM using an ER marker, a genetically encoded junctional marker, or fluorescently labeled E-Syt1 (Fig. 2C) (22, 30). This comingling of calcium signaling and lipid transfer reflects a close functional linkage: Lipid transfer supplies the phosphatidylinositol needed for PIP2 resynthesis during sustained calcium signaling, and plasma membrane lipid microdomains are integral to feedback regulation of the ORAI channel by calcium and SARAF (22, 31, 32); conversely, local calcium signals recruit E-Syt1 and thereby either expand ER–plasma membrane junctions or strengthen junctional contacts (11, 12, 22, 30).
Our findings reinforce the conclusion that junctions provide more than an unadorned stage for STIM and ORAI to interact. STIM1–ORAI1 interaction is the minimum requirement for CRAC channel gating (33, 34), but local membrane organization regulates the efficiency of interaction and gating (20, 32). A specific requirement for TMEM110 in STIM–ORAI signaling is evident in the observations that TMEM110 depletion and E-Syt depletion cause a comparable loss of junctional area (Figs. 3 and 4) (12), but only TMEM110 depletion has a profound effect on the initial amplitude of store-dependent calcium entry (Fig. 1 B and C and Fig. S3 A and B) (12, 22, 30, 32). In principle, TMEM110 could act either by contributing to a nanometer-scale compartmentalization of calcium signaling within individual junctions or simply by ensuring the presence of specific protein components in the junction.
ER–plasma membrane junctions are remodeled during physiological signaling by the formation of new junctions, the extension of existing contacts, and a reduction in ER–plasma membrane spacing (5, 22, 24, 25). Even subtle structural changes in existing junctions can shape calcium signaling both by altering the local landscape for calcium diffusion, and hence the local calcium concentration profile, and by setting constraints on the positioning of calcium-handling proteins such as SERCA and PMCA (6). Recent mechanistic studies have highlighted the dynamic changes attributable to E-Syt proteins and their partners (11, 12, 22, 30). Here we establish that TMEM110 and STIM2, proteins dedicated primarily to calcium signaling, also participate in rapid structural rearrangements of junctional contacts (Figs. 6 and 7). The processes controlled by E-Syt proteins and by TMEM110 will both be triggered by physiological signaling. However, they might tend to target spatially discrete sites within a junction as a result of their differing dependence on calcium influx (Figs. 6 and 7) (30).
Our observations point to a previously unrecognized aspect of STIM2 functioning in cells. STIM2 has a well-established role in the maintenance of resting cytoplasmic and ER calcium levels (35). STIM2 also contributes to evoked store-operated calcium entry in HeLa cells and mouse embryonic fibroblasts (36, 37) and supports sustained calcium signaling in other cells, particularly at low physiological stimulus intensities (37–39). These latter effects are somewhat counterintuitive, given that STIM2 is relatively ineffective in directly activating ORAI channels (40, 41). One part of the explanation is that STIM2 can enhance STIM1 recruitment to junctions by a physical interaction with STIM1 (42). Another part could be the newly discovered involvement of STIM2 in rapid local rearrangements at ER–plasma membrane junctions. These rearrangements might enhance calcium signaling by specifying a local environment that favors STIM1 recruitment or STIM1-ORAI1 interaction, by positioning other calcium signaling proteins, or by changing junctional geometry.
The specific message of this work is that the ER membrane protein TMEM110 supports the maintenance of ER–plasma membrane junctions competent for calcium signaling and acts in concert with other proteins in the dynamic remodeling of the junctions during signaling. A broader message is that STIM–ORAI calcium signaling is critically dependent on modulatory proteins that organize the junctions for calcium signaling. Our characterization of the cellular roles of TMEM110 has begun to define the mechanisms involved.
Materials and Methods
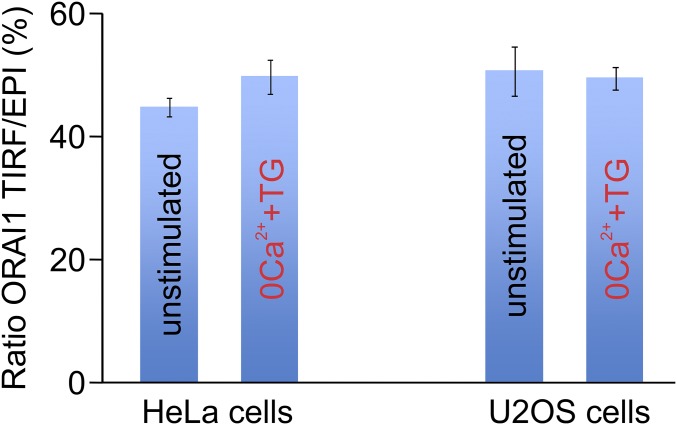
The experiments were carried out with HeLa cells and Jurkat T cells obtained from ATCC; HeLa NFAT1-GFP cells (43, 44); and TMEM110−/− HEK293 cell lines and their parental HEK293 cells (23). Expression plasmids encoded STIM1, STIM2, TMEM110, and TMEM110(Δ211-294), tagged as indicated; Clover-Ist2(490–946); and the ER markers RFP-ER, DsRed-ER, and blue fluorescent protein (BFP)-ER. The siControl, siSTIM1, and siSTIM2 reagents have been characterized (20, 37). Four individual siTMEM110 reagents reduced the level of TMEM110 mRNA (Fig. S1). Except in the experiment shown in Fig. S1, the most effective siRNA, siTMEM110(#2) with the sequence 5′-AGACGUCCGUGGAGGAUAU-3′, was used. RNAi-resistant TMEM110 expression constructs were engineered with silent mutations that rendered them insensitive to siTMEM110(#2). Assays for NFAT nuclear import, Ca2+ imaging, and electrophysiology were carried out as described (20, 33). Methods for TIRFM and fluorescence microscopy were as described (20). The relative fraction of STIM1 (Fig. 2A), STIM1(D76A) (Fig. 2B), or ER marker (Fig. 3) in the TIRF layer was estimated for a given cell by dividing the STIM1 (or RFP-ER) fluorescence recorded in TIRF mode by the fluorescence recorded in epifluorescence mode. Conditions of illumination and detection were identical for all cells in an experiment. Although the efficiency of fluorophore excitation could differ in the two configurations, it seems likely that in our conditions the ratio is a rough approximation of the actual fraction of fluorescent protein present in the TIRF layer, because the ratios obtained for the plasma membrane protein ORAI1 were 40–50%, in agreement with the proportion of total plasma membrane expected in the TIRF layer (Fig. S9). Emerging junctions were tentatively identified by subtracting, pixel-by-pixel, the first RFP-ER TIRFM image in a series (before stimulation) from the last image (10 min after the addition of TG), then overlaying the subtracted last image (colored green) onto the first image (red). Each case analyzed was confirmed further by visually following the development of the RFP-ER signal through the entire series of images.
Fig. S9.
Normalized amount of ORAI1 within the TIRF layer. Bars depict the averaged ratio of mCherry-ORAI1 fluorescence detected at the TIRF layer to total cellular mCherry-ORAI1 fluorescence in HeLa cells (n = 30) or U2OS cells (n = 43) before and after stimulation with TG. Error bars report SEM.
A detailed description of all procedures is found in SI Materials and Methods.
SI Materials and Methods
Reagents.
All chemicals not specifically mentioned were purchased from Sigma (highest grade). TG and fura-2/AM were from Molecular Probes, CsA and InsP3 were from Calbiochem, and anti-CD3 antibody (OKT3) was from eBioscience.
siRNA Sequences.
siRNA oligonucleotides were obtained from the Dharmacon Human siGenome collection (v2007 or 2010), with the exception of siControl, which was custom synthesized by Dharmacon. Sequences are as follows:
| Gene symbol | EntrezGene ID | siRNA_sense |
| siControl | n/a | GCUAUUGCAUGUCGAAAUA |
| siSTIM1 | 6786 | GGUGGUGUCUAUCGUUAUU |
| siTMEM110 | 375346 | AGACGUCCGUGGAGGAUAU |
DNA Constructs.
Full-length human TMEM110 cDNA (Open Biosystems) and mCherry cDNA were individually PCR-amplified, and the PCR products, containing a linker (ggcggaggaagc), were used in a new PCR to make a cDNA encoding the fusion protein. This insert was subcloned into the modified mammalian expression vector pMax, a kind gift of Barbara Niemeyer, Saarland University, Saarbrücken, Germany (46). For GFP-TMEM110, TMEM110 was PCR-amplified and cloned into the GFP-C1 pMax vector. For TMEM110-pTagGFP2, TMEM110-BFP, and pTagRFP-TMEM110, TMEM110 cDNA was PCR-amplified and cloned into pTagGFP2-C, BFP-N, and pTagRFP-C vectors (Evrogen), respectively. The same strategy was used to make truncated constructs of TMEM110. Clover-Ist2(490–946) was PCR-amplified from the full-length yeast Ist2 cDNA (Harvard PlasmID Collection) and cloned into Clover-C1 pcDNA3.1+ (Addgene) between the XbaI and ApaI sites. YFP-STIM1, STIM1-YFP, GFP-EF-hand mutant STIM1(D76A), YFP-STIM2, and BFP-ER vectors were obtained from Addgene. DsRed-ER, GFP-STIM1, and mCherry-STIM1 vectors were made as described elsewhere (20). TagRFP-T-ER vector was a kind gift from Christian Junker and Markus Hoth, Saarland University, Saarbrücken, Germany. STIM1-mCherry and STIM1-GFP vectors were a kind gift from Victoria Bolotina, Boston University School of Medicine, Boston.
Cell Culture and Transfection.
HeLa cells were obtained from the ATCC. HeLa cells stably expressing NFAT1-GFP have been described previously (37, 43). Cells were cultured at 37 °C under 10% CO2 in DMEM (11995-040; Gibco) supplemented with 10% (vol/vol) heat-inactivated bovine calf serum, 2 mM l-glutamine, and 10 mM Hepes. Parental control and TMEM110−/− HEK293 cells (23) were maintained in the same conditions as HeLa cells. For siRNA transfections, HeLa cells were transfected with 40–60 nM of siRNA using HiPerFect (QIAGEN) according to the manufacturer’s instructions. Cells were incubated with siRNA complexes for a total of 48 h [for quantitative RT-PCR (qRT-PCR)] or 72 h (for functional assays). For DNA transfection, subconfluent HeLa or HEK293 cells were transfected using Lipofectamine 2000 (Invitrogen) according to the manufacturer’s instructions and were used 48 h after transfection. Experiments involving the EF-hand mutant STIM1(D76A) were carried out by transfecting first with siTMEM110 and then, 24 h later, with STIM1(D76A) expression plasmid and imaging the cells after a further 48 h. Jurkat T cells were obtained from the ATCC and were maintained at 37 °C under 5% CO2 in RPMI-1640 medium (11875-093; Gibco) supplemented with 10% (vol/vol) heat-inactivated FCS, 2 mM l-glutamine, and 10 mM Hepes. For siRNA or DNA transfection, Jurkat cells were transfected using the Neon electroporation system (Invitrogen).
Quantification of NFAT Nuclear Translocation.
Confluent HeLa cell monolayers seeded in black-rimmed, clear-bottomed 96-well microplates (Corning/Costar) were stimulated in DMEM supplemented with 2 mM CaCl2, using 1 µM TG; CsA pretreatments were performed for 30 min at 1 µM CsA. After 20 min of TG treatment at 37 °C, cells were fixed in 4% paraformaldehyde solution in PBS (Affymetrix USB), permeabilized in PBS and 0.2% Triton-X100 (Sigma), and stained with the DNA-intercalating dye DAPI (Invitrogen). Fluorescent images were acquired at 10× magnification on an ImageXpress Micro Imaging System (Molecular Devices) and were analyzed using the Translocation module of MetaXpress software v. 6.1. Nuclear translocation was assessed by calculating the correlation of spatial fluorescence intensity between the NFAT1-GFP and DAPI: Cells were scored positive for nuclear translocation if >60% of the GFP signal coincided with the DAPI signal. Each data point represents the average of three separate wells on a plate (>1,200 cells per well), with error bars reporting SEM between wells; all experiments represent biological duplicates or triplicates. For rescue experiments, HeLa cells seeded in 12-well plates were transfected with siRNAs; 24 h later plasmids coding for siRNA-resistant RFP-TMEM110 were transfected, and cells were incubated for an additional 48 h.
Ca2+ Influx Assays.
Single-cell Ca2+ measurements were made with fura-2/AM–loaded cells as previously reported (20). HeLa cells were plated on 18-mm coverslips and loaded with 3 μM fura-2/AM for 30–45 min at 37 °C in DMEM containing 2.5 mM probenecid and 10 mM Hepes (Sigma), were washed twice with fresh medium, and were analyzed immediately. Jurkat T cells were loaded with 1 μM fura-2/AM for 30–45 min at room temperature with constant shaking, then were washed once with fresh medium, and were plated onto 18-mm coverslips pretreated with poly-l-ornithine [3% (wt/vol)] for 5 min before analysis. Coverslips were assembled into a chamber on the stage of an Olympus IX 71 microscope equipped with a 20× (UplanSApo, NA 0.75) objective. Cells were illuminated alternately at 340 and 380 nm with the Polychrome V (TILL Photonics) using ET Fura filter (Chroma Technology Corp., catalog no. 79001). The fluorescence emissions at λ > 400 nm (long-pass filter, 400 nm; emitter 510/80 nm) were captured with a CCD camera (SensiCam; TILL Imago) and were digitized and analyzed by TILL Vision software. Ratio images were recorded at intervals of 2 s. Ca2+ concentrations were estimated from the relation [Ca2+]i = K(R − Rmin)/(Rmax − R), where the values of K, Rmin, and Rmax were determined from an in situ calibration of fura-2 in HeLa cells as described (47). Ca2+ Ringer’s solution contained (in mM) 155 NaCl, 4.5 KCl, 1 CaCl2 (for Jurkat T cells) or 2 CaCl2 (for HeLa cells), 2 MgCl2 (for Jurkat T cells) or 1 MgCl2 (for HeLa cells), 10 d-glucose, and 5 Hepes (pH 7.4 with NaOH). EGTA (1 mM) was substituted for CaCl2 in the 0-Ca2+ Ringer’s solution. TG (1 μM) or 5 µg/mL OKT3 antibodies were used to stimulate the cells. Data were analyzed using TILL Vision (TILL Photonics) and Igor Pro (WaveMetrics). All values are given as mean ± SEM, and the number of cells is stated. Statistical comparisons were by Student’s t-test. Three to five experiments were performed for each experimental condition. Four parameters were used to quantify store-operated Ca2+ signals at the single-cell level: the initial Ca2+ influx rate, as fitted by linear regression; the maximal increase in [Ca2+]i relative to the basal [Ca2+]i after either Ca2+ release from ER or Ca2+ influx through CRAC/ORAI1 channels, fitted by polynomial regression; and the Ca2+ plateau (averaging five points), at 600 s for Jurkat T cells or 800 s for HeLa cells, based on data from more than 80 single cells in each experiment.
Electrophysiology.
Patch-clamp experiments were performed as described elsewhere (20). Briefly, the whole-cell configuration at 21–25 °C was achieved by tight seals with 2.5- to 3.2-MΩ resistance fire-polished micropipettes. To reduce electrode capacitance, pipettes were dipped into Sigmacote (Sigma-Aldrich) immediately before use. Membrane currents were acquired with an EPC-9 patch-clamp amplifier (HEKA). Voltage ramps of 200-ms duration spanning a range of −150 mV to +100 mV were delivered from a holding potential of 0 mV at a rate of 0.5 Hz over a period of 400 s. All voltages were corrected for a liquid junction potential of −10 mV between internal and bath solutions. Currents were filtered at 2.9 kHz and digitized at a sampling rate of 10 kHz. To display the current recordings, currents were digitally filtered offline at 1 kHz. Pipette and cell capacitance were electronically cancelled before each voltage ramp. Current amplitudes at −130 mV from individual voltage ramps were used to monitor the temporal development of currents. Statistical errors of averaged data are given as means ± SEM with n determinations (cells). The standard external solution (in mM) was as follows: 120 NaCl, 2 MgCl2, 10 CaCl, 10 TEA-Cl, 10 Hepes, 10 glucose, pH 7.2 with NaOH. The standard pipette solution for whole-cell patch-clamp recordings contained (in mM) 0.05 InsP3, 5 × 10⁻⁵ TG, 140 Cs-glutamate, 12 EGTA, 3 MgCl2, 10 Hepes, pH 7.2 with CsOH.
TIRFM and FRET Microscopy.
TIRFM was performed using a 60×, 1.45 NA CFI Apo objective (Nikon) mounted on a Ti-Eclipse inverted microscope with Perfect Focus System (PFS; Nikon). Imaging was performed on HeLa cells stably transfected with GFP-STIM1 or transiently transfected with the indicated constructs. Cells were stimulated with 1 µM TG in the absence of extracellular Ca2+ solution for 11–13 min. Dual-channel or triple-channel time-lapse image sequences from four to seven cells were acquired by sequential, nearly simultaneous acquisition of the individual channels using a CoolSNAP HQ2 Monochrome CCD camera (Photometrics). Exposure times were 300 ms, 100 ms, and 300 ms (for 405-nm, 488-nm, and 561-nm channels, respectively) at frame rates of 0.05/s–0.2/s. For FRET experiments, four images were taken as follows: donor–donor (FITC–FITC filters), acceptor–acceptor (TRITC–TRITC filters), FRET (donor–acceptor, FITC–TRITC filters), and anti-FRET (acceptor–donor, TRITC–FITC filters). For image analyses, ImageJ and NI-Elements software were used. The relative fraction of STIM1, STIM1(D76A), or ER marker in the TIRF layer was estimated for a given cell by dividing the STIM1 (or RFP-ER) fluorescence recorded in TIRF mode by the fluorescence recorded in epifluorescence mode. Conditions of illumination and detection were identical for all cells in an experiment. Emerging junctions were tentatively identified by subtracting, pixel-by-pixel, the first RFP-ER TIRFM image in a series (before stimulation) from the last image (10 min after the addition of TG) and then overlaying the subtracted last image (colored green) onto the first image (red). Each case analyzed was confirmed further by visually following the development of the RFP-ER signal through the entire series of images.
Electron Microscopy.
Cells were grown on discs cut from Aclar film (Electron Microscopy Sciences), treated as indicated, and fixed using 2.5% glutaraldehyde (diluted from 8% aqueous solution, EM grade, Electron Microscopy Sciences) and 2% paraformaldehyde (diluted from 16% aqueous solution, EM grade, Electron Microscopy Sciences) in 0.15 M cacodylate buffer, pH 7.4, containing 2 mM calcium chloride, at 37 °C for 5 min followed by 1 h at 4 °C. The coverslips then were washed three times in cacodylate buffer for 5 min each and were postfixed in 1% osmium tetroxide/0.3% potassium ferrocyanide in buffer for 1 h on ice. Subsequently, the coverslips were washed three times in water for 5 min each and en bloc stained with 2% (wt/vol) uranyl acetate for 1 h. Then the samples were washed again in water and were dehydrated in a graded acetone series [50%, 70%, 90%, 100%, and 100% (vol/vol)] for 5 min each. Samples then were rapidly infiltrated in Spurr’s resin using a PELCO BioWave microwave processing unit (Ted Pella), flat embedded, and cured at 60 °C overnight. Regions of interest were found via light microscopy, excised from the flat molds, and remounted on blank resin stubs. Ultrathin (70-nm) sections were cut on a Leica UC7 Ultramicrotome (Leica), and entire cells were examined with a STEM detector on a Sigma VP scanning electron microscope (Zeiss) at 27 KeV and 1.2 nm per pixel, with a 30-µm aperture and 1.5-µs dwell time, using the ATLAS scan engine (Fibics).
qRT-PCR.
Total RNA was isolated from cells 48 h after siRNA transfection using RNeasy extraction with on-column DNase I digestion (QIAGEN). cDNA was generated from 200–500 ng total RNA using SuperScript III (Invitrogen) and oligo-dT priming. qPCR was performed using FastStart Universal SYBR Green Master Mix reagents (Roche) and was analyzed on a StepOnePlus Real-Time PCR system (Applied Biosystems). TMEM110 expression in individual samples was normalized to GAPDH expression, and relative gene expression in experimental samples was extrapolated from a standard curve derived from siControl-treated RNA samples.
Fluorescence Protease Protection.
The fluorescence protease protection (FPP) experiment was performed as described elsewhere (48). Briefly, living cells transfected with plasmid encoding the desired fluorescently tagged protein were exposed to KHM buffer (110 mM potassium acetate, 20 mM Hepes pH 7.2, 2 mM magnesium chloride) containing digitonin (50 µM) to permeabilize the plasma membrane. Then cells were washed with KHM buffer containing proteinase K (50 µg/mL) for 2 min. Epifluorescence images were recorded every 2 s for 5 min.
Data Analysis.
Data were analyzed using Igor Pro (WaveMetrics), Pulse (HEKA), FitMaster (HEKA), and Microsoft Excel (Microsoft). All values are given as mean ± SEM, and the number of cells is reported. More than two independent experiments were performed for each experimental condition. Statistical comparisons used Student’s t-test.
Acknowledgments
We thank Matthew Joens and Sarah Dunn for technical assistance with electron microscopy and Mike Adams and James Fitzpatrick for technical support of the TIRF microscopy (TIRFM) experiments performed at the Waitt Advanced Biophotonics Center, Salk Institute. The Waitt Advanced Biophotonics Core Facility received funding from the Waitt Foundation, the W. M. Keck Foundation, NIH-NCI CCSG P30 014195, and NINDS Center Core Grant for Neuroscience Research P30 NS072031. This work was supported by NIH Grants AI084167, AI040127, and GM110397. A.Q. was supported by Deutsche Forschungsgemeinschaft Postdoctoral Fellowship QU298/1-1. S.F.-K. was supported by a Ruth L. Kirschstein-National Research Service Award Postdoctoral Fellowship. Work in the Y.Z. laboratory was supported by NIH Grant R01 GM112003 (to Y.Z.) and by a China Scholarship Council Fellowship (to J.J.).
Footnotes
Conflict of interest statement: A.R. and P.G.H. are founders of CalciMedica, Inc. and are members of its scientific advisory board.
This article contains supporting information online at www.pnas.org/lookup/suppl/doi:10.1073/pnas.1521924112/-/DCSupplemental.
References
- 1.Carrasco S, Meyer T. STIM proteins and the endoplasmic reticulum-plasma membrane junctions. Annu Rev Biochem. 2011;80:973–1000. doi: 10.1146/annurev-biochem-061609-165311. [DOI] [PMC free article] [PubMed] [Google Scholar]
- 2.Hogan PG, Lewis RS, Rao A. Molecular basis of calcium signaling in lymphocytes: STIM and ORAI. Annu Rev Immunol. 2010;28:491–533. doi: 10.1146/annurev.immunol.021908.132550. [DOI] [PMC free article] [PubMed] [Google Scholar]
- 3.Parekh AB, Putney JW., Jr Store-operated calcium channels. Physiol Rev. 2005;85(2):757–810. doi: 10.1152/physrev.00057.2003. [DOI] [PubMed] [Google Scholar]
- 4.Shim AH, Tirado-Lee L, Prakriya M. Structural and functional mechanisms of CRAC channel regulation. J Mol Biol. 2015;427(1):77–93. doi: 10.1016/j.jmb.2014.09.021. [DOI] [PMC free article] [PubMed] [Google Scholar]
- 5.Wu MM, Buchanan J, Luik RM, Lewis RS. Ca2+ store depletion causes STIM1 to accumulate in ER regions closely associated with the plasma membrane. J Cell Biol. 2006;174(6):803–813. doi: 10.1083/jcb.200604014. [DOI] [PMC free article] [PubMed] [Google Scholar]
- 6.Hogan PG. The STIM1-ORAI1 microdomain. Cell Calcium. 2015;58(4):357–367. doi: 10.1016/j.ceca.2015.07.001. [DOI] [PMC free article] [PubMed] [Google Scholar]
- 7.Samanta K, Kar P, Mirams GR, Parekh AB. Ca2+ channel re-localization to plasma-membrane microdomains strengthens activation of Ca2+-dependent nuclear gene expression. Cell Reports. 2015;12(2):203–216. doi: 10.1016/j.celrep.2015.06.018. [DOI] [PMC free article] [PubMed] [Google Scholar]
- 8.Loewen CJ, Young BP, Tavassoli S, Levine TP. Inheritance of cortical ER in yeast is required for normal septin organization. J Cell Biol. 2007;179(3):467–483. doi: 10.1083/jcb.200708205. [DOI] [PMC free article] [PubMed] [Google Scholar]
- 9.Manford AG, Stefan CJ, Yuan HL, Macgurn JA, Emr SD. ER-to-plasma membrane tethering proteins regulate cell signaling and ER morphology. Dev Cell. 2012;23(6):1129–1140. doi: 10.1016/j.devcel.2012.11.004. [DOI] [PubMed] [Google Scholar]
- 10.Wolf W, et al. Yeast Ist2 recruits the endoplasmic reticulum to the plasma membrane and creates a ribosome-free membrane microcompartment. PLoS One. 2012;7(7):e39703. doi: 10.1371/journal.pone.0039703. [DOI] [PMC free article] [PubMed] [Google Scholar]
- 11.Fernández-Busnadiego R, Saheki Y, De Camilli P. Three-dimensional architecture of extended synaptotagmin-mediated endoplasmic reticulum-plasma membrane contact sites. Proc Natl Acad Sci USA. 2015;112(16):E2004–E2013. doi: 10.1073/pnas.1503191112. [DOI] [PMC free article] [PubMed] [Google Scholar]
- 12.Giordano F, et al. PI(4,5)P2-dependent and Ca2+-regulated ER-PM interactions mediated by the extended synaptotagmins. Cell. 2013;153(7):1494–1509. doi: 10.1016/j.cell.2013.05.026. [DOI] [PMC free article] [PubMed] [Google Scholar]
- 13.Chung J, et al. PI4P/phosphatidylserine countertransport at ORP5- and ORP8-mediated ER-plasma membrane contacts. Science. 2015;349(6246):428–432. doi: 10.1126/science.aab1370. [DOI] [PMC free article] [PubMed] [Google Scholar]
- 14.Holthuis JC, Menon AK. Lipid landscapes and pipelines in membrane homeostasis. Nature. 2014;510(7503):48–57. doi: 10.1038/nature13474. [DOI] [PubMed] [Google Scholar]
- 15.Kim YJ, Hernandez ML, Balla T. Inositol lipid regulation of lipid transfer in specialized membrane domains. Trends Cell Biol. 2013;23(6):270–278. doi: 10.1016/j.tcb.2013.01.009. [DOI] [PMC free article] [PubMed] [Google Scholar]
- 16.Moser von Filseck J, et al. Phosphatidylserine transport by ORP/Osh proteins is driven by phosphatidylinositol 4-phosphate. Science. 2015;349(6246):432–436. doi: 10.1126/science.aab1346. [DOI] [PubMed] [Google Scholar]
- 17.Pichler H, et al. A subfraction of the yeast endoplasmic reticulum associates with the plasma membrane and has a high capacity to synthesize lipids. Eur J Biochem. 2001;268(8):2351–2361. doi: 10.1046/j.1432-1327.2001.02116.x. [DOI] [PubMed] [Google Scholar]
- 18.Stefan CJ, Manford AG, Emr SD. ER-PM connections: Sites of information transfer and inter-organelle communication. Curr Opin Cell Biol. 2013;25(4):434–442. doi: 10.1016/j.ceb.2013.02.020. [DOI] [PMC free article] [PubMed] [Google Scholar]
- 19.Toulmay A, Prinz WA. Lipid transfer and signaling at organelle contact sites: The tip of the iceberg. Curr Opin Cell Biol. 2011;23(4):458–463. doi: 10.1016/j.ceb.2011.04.006. [DOI] [PMC free article] [PubMed] [Google Scholar]
- 20.Sharma S, et al. An siRNA screen for NFAT activation identifies septins as coordinators of store-operated Ca2+ entry. Nature. 2013;499(7457):238–242. doi: 10.1038/nature12229. [DOI] [PMC free article] [PubMed] [Google Scholar]
- 21.Park CY, et al. STIM1 clusters and activates CRAC channels via direct binding of a cytosolic domain to Orai1. Cell. 2009;136(5):876–890. doi: 10.1016/j.cell.2009.02.014. [DOI] [PMC free article] [PubMed] [Google Scholar]
- 22.Chang CL, et al. Feedback regulation of receptor-induced Ca2+ signaling mediated by E-Syt1 and Nir2 at endoplasmic reticulum-plasma membrane junctions. Cell Reports. 2013;5(3):813–825. doi: 10.1016/j.celrep.2013.09.038. [DOI] [PubMed] [Google Scholar]
- 23.Jing J, et al. Proteomic mapping of ER-PM junctions identifies STIMATE as a regulator of Ca2+ influx. Nat Cell Biol. 2015;17(10):1339–1347. doi: 10.1038/ncb3234. [DOI] [PMC free article] [PubMed] [Google Scholar]
- 24.Orci L, et al. STIM1-induced precortical and cortical subdomains of the endoplasmic reticulum. Proc Natl Acad Sci USA. 2009;106(46):19358–19362. doi: 10.1073/pnas.0911280106. [DOI] [PMC free article] [PubMed] [Google Scholar]
- 25.Shen WW, Frieden M, Demaurex N. Remodelling of the endoplasmic reticulum during store-operated calcium entry. Biol Cell. 2011;103(8):365–380. doi: 10.1042/BC20100152. [DOI] [PubMed] [Google Scholar]
- 26.Picollo A, Malvezzi M, Accardi A. TMEM16 proteins: Unknown structure and confusing functions. J Mol Biol. 2015;427(1):94–105. doi: 10.1016/j.jmb.2014.09.028. [DOI] [PMC free article] [PubMed] [Google Scholar]
- 27.Kralt A, et al. Intrinsically disordered linker and plasma membrane-binding motif sort Ist2 and Ssy1 to junctions. Traffic. 2015;16(2):135–147. doi: 10.1111/tra.12243. [DOI] [PubMed] [Google Scholar]
- 28.Maass K, et al. A signal comprising a basic cluster and an amphipathic alpha-helix interacts with lipids and is required for the transport of Ist2 to the yeast cortical ER. J Cell Sci. 2009;122(Pt 5):625–635. doi: 10.1242/jcs.036012. [DOI] [PubMed] [Google Scholar]
- 29.Lavieu G, et al. Induction of cortical endoplasmic reticulum by dimerization of a coatomer-binding peptide anchored to endoplasmic reticulum membranes. Proc Natl Acad Sci USA. 2010;107(15):6876–6881. doi: 10.1073/pnas.1002536107. [DOI] [PMC free article] [PubMed] [Google Scholar]
- 30.Idevall-Hagren O, Lü A, Xie B, De Camilli P. Triggered Ca2+ influx is required for extended synaptotagmin 1-induced ER-plasma membrane tethering. EMBO J. 2015;34(17):2291–2305. doi: 10.15252/embj.201591565. [DOI] [PMC free article] [PubMed] [Google Scholar]
- 31.Chang CL, Liou J. Phosphatidylinositol 4,5-bisphosphate homeostasis regulated by Nir2 and Nir3 proteins at endoplasmic reticulum-plasma membrane junctions. J Biol Chem. 2015;290(23):14289–14301. doi: 10.1074/jbc.M114.621375. [DOI] [PMC free article] [PubMed] [Google Scholar]
- 32.Maléth J, Choi S, Muallem S, Ahuja M. Translocation between PI(4,5)P2-poor and PI(4,5)P2-rich microdomains during store depletion determines STIM1 conformation and Orai1 gating. Nat Commun. 2014;5:5843. doi: 10.1038/ncomms6843. [DOI] [PMC free article] [PubMed] [Google Scholar]
- 33.Gudlur A, et al. STIM1 triggers a gating rearrangement at the extracellular mouth of the ORAI1 channel. Nat Commun. 2014;5:5164. doi: 10.1038/ncomms6164. [DOI] [PMC free article] [PubMed] [Google Scholar]
- 34.Zhou Y, et al. STIM1 gates the store-operated calcium channel ORAI1 in vitro. Nat Struct Mol Biol. 2010;17(1):112–116. doi: 10.1038/nsmb.1724. [DOI] [PMC free article] [PubMed] [Google Scholar]
- 35.Brandman O, Liou J, Park WS, Meyer T. STIM2 is a feedback regulator that stabilizes basal cytosolic and endoplasmic reticulum Ca2+ levels. Cell. 2007;131(7):1327–1339. doi: 10.1016/j.cell.2007.11.039. [DOI] [PMC free article] [PubMed] [Google Scholar]
- 36.Liou J, et al. STIM is a Ca2+ sensor essential for Ca2+-store-depletion-triggered Ca2+ influx. Curr Biol. 2005;15(13):1235–1241. doi: 10.1016/j.cub.2005.05.055. [DOI] [PMC free article] [PubMed] [Google Scholar]
- 37.Oh-Hora M, et al. Dual functions for the endoplasmic reticulum calcium sensors STIM1 and STIM2 in T cell activation and tolerance. Nat Immunol. 2008;9(4):432–443. doi: 10.1038/ni1574. [DOI] [PMC free article] [PubMed] [Google Scholar]
- 38.Kar P, Bakowski D, Di Capite J, Nelson C, Parekh AB. Different agonists recruit different stromal interaction molecule proteins to support cytoplasmic Ca2+ oscillations and gene expression. Proc Natl Acad Sci USA. 2012;109(18):6969–6974. doi: 10.1073/pnas.1201204109. [DOI] [PMC free article] [PubMed] [Google Scholar]
- 39.Thiel M, Lis A, Penner R. STIM2 drives Ca2+ oscillations through store-operated Ca2+ entry caused by mild store depletion. J Physiol. 2013;591(Pt 6):1433–1445. doi: 10.1113/jphysiol.2012.245399. [DOI] [PMC free article] [PubMed] [Google Scholar]
- 40.Bird GS, et al. STIM1 is a calcium sensor specialized for digital signaling. Curr Biol. 2009;19(20):1724–1729. doi: 10.1016/j.cub.2009.08.022. [DOI] [PMC free article] [PubMed] [Google Scholar]
- 41.Wang X, et al. Distinct Orai-coupling domains in STIM1 and STIM2 define the Orai-activating site. Nat Commun. 2014;5:3183. doi: 10.1038/ncomms4183. [DOI] [PMC free article] [PubMed] [Google Scholar]
- 42.Ong HL, et al. STIM2 enhances receptor-stimulated Ca²⁺ signaling by promoting recruitment of STIM1 to the endoplasmic reticulum-plasma membrane junctions. Sci Signal. 2015;8(359):ra3. doi: 10.1126/scisignal.2005748. [DOI] [PMC free article] [PubMed] [Google Scholar]
- 43.Gwack Y, et al. A genome-wide Drosophila RNAi screen identifies DYRK-family kinases as regulators of NFAT. Nature. 2006;441(7093):646–650. doi: 10.1038/nature04631. [DOI] [PubMed] [Google Scholar]
- 44.Sharma S, et al. Dephosphorylation of the nuclear factor of activated T cells (NFAT) transcription factor is regulated by an RNA-protein scaffold complex. Proc Natl Acad Sci USA. 2011;108(28):11381–11386. doi: 10.1073/pnas.1019711108. [DOI] [PMC free article] [PubMed] [Google Scholar]
- 45.Krogh A, Larsson B, von Heijne G, Sonnhammer EL. Predicting transmembrane protein topology with a hidden Markov model: Application to complete genomes. J Mol Biol. 2001;305(3):567–580. doi: 10.1006/jmbi.2000.4315. [DOI] [PubMed] [Google Scholar]
- 46.Bogeski I, et al. Differential redox regulation of ORAI ion channels: A mechanism to tune cellular calcium signaling. Sci Signal. 2010;3(115):ra24. doi: 10.1126/scisignal.2000672. [DOI] [PubMed] [Google Scholar]
- 47.Grynkiewicz G, Poenie M, Tsien RY. A new generation of Ca2+ indicators with greatly improved fluorescence properties. J Biol Chem. 1985;260(6):3440–3450. [PubMed] [Google Scholar]
- 48.Lorenz H, Hailey DW, Lippincott-Schwartz J. Fluorescence protease protection of GFP chimeras to reveal protein topology and subcellular localization. Nat Methods. 2006;3(3):205–210. doi: 10.1038/nmeth857. [DOI] [PubMed] [Google Scholar]


