Significance
Liver fibrosis and cirrhosis are chronic liver diseases, resulting in life-threatening conditions with no FDA-approved therapy. Here, we identify bromodomain-containing protein 4 (BRD4) as a critical regulator for enhancer-mediated profibrotic gene expression in hepatic stellate cells (HSCs). In support of this notion, we find BRD4-loaded enhancers are associated with multiple profibrotic pathways in HSCs and that pharmacological inhibition of BRD4 blocks HSC activation into myofibroblasts. Furthermore, small molecule inhibitors of BRD4 are not only protective against, but can limit the fibrotic response in CCl4-induced fibrosis in a mouse model. Thus, our studies implicate BRD4 as a global genomic regulator of the fibrotic gene regulatory network and suggest bromodomains as potential therapeutic targets to treat fibrotic complications in patients.
Keywords: liver fibrosis, BET inhibitor, BRD4, hepatic stellate cell, antifibrotic therapy
Abstract
Liver fibrosis is characterized by the persistent deposition of extracellular matrix components by hepatic stellate cell (HSC)-derived myofibroblasts. It is the histological manifestation of progressive, but reversible wound-healing processes. An unabated fibrotic response results in chronic liver disease and cirrhosis, a pathological precursor of hepatocellular carcinoma. We report here that JQ1, a small molecule inhibitor of bromodomain-containing protein 4 (BRD4), a member of bromodomain and extraterminal (BET) proteins, abrogate cytokine-induced activation of HSCs. Cistromic analyses reveal that BRD4 is highly enriched at enhancers associated with genes involved in multiple profibrotic pathways, where BRD4 is colocalized with profibrotic transcription factors. Furthermore, we show that JQ1 is not only protective, but can reverse the fibrotic response in carbon tetrachloride-induced fibrosis in mouse models. Our results implicate that BRD4 can act as a global genomic regulator to direct the fibrotic response through its coordinated regulation of myofibroblast transcription. This suggests BRD4 as a potential therapeutic target for patients with fibrotic complications.
Fibrosis is characterized by the excessive deposition of extracellular matrix (ECM) in and around injured tissues and is the result of an unchecked wound-healing response. If unresolved, fibrosis can lead to permanent scarring, organ failure, and, eventually, death (1, 2). Notably, fibrosis contributes to the pathogenesis of multiple disorders including chronic liver and kidney disease, restrictive lung disease, heart failure, and corneal blindness. Fibrotic diseases contribute to ∼45% of mortalities in developed countries (3) and represent a significant burden on public health systems; however, few therapeutic options are currently available. Thus, a greater understanding of the molecular conduits controlling the fibrotic response is needed to facilitate the development of next-generation antifibrotic therapies.
At the cellular level, myofibroblasts are arguably the most important cellular mediators of organ fibrosis. In response to a wide variety of insults including, but not limited to, mechanical challenges, inflammation, infection, metabolic imbalance, and malignancies, myofibroblasts are activated and acquire the fibrogenic properties of proliferation, contractility, and ECM production. Progressive deposition of fibrillar collagens due to persistent activation of myofibroblasts eventually causes parenchyma compartmentalized by ECM bands, the histological signature of tissue fibrosis. Although the cellular precursors of myofibroblasts are diverse, the core pathways that mediate their activation are well established and conserved across multiple tissues. Ectopic activation of these core pathways has been experimentally demonstrated to drive a systemic fibrotic phenotype, and reciprocally, pharmacological attenuation of these activities appears effective in managing fibrotic symptoms in the clinical setting. Therefore, targeting of intra- and intercellular pathways that perpetuate myofibroblast activation may serve as an attractive therapeutic strategy to combat progressive fibrotic complications.
Liver, the central homeostatic organ in the human body, is well suited for exploring the molecular mechanisms of fibrosis as hepatic stellate cells (HSCs) have been identified as the predominant precursor cells of liver myofibroblasts. In the healthy liver, HSCs are retinoid and lipid-containing stromal cells located in the space of Disse, between the sinusoidal endothelium and hepatocytes. Liver injuries sensitize HSCs to paracrine stimuli, which ultimately activate HSCs to release their lipid and retinoid stores, undergo dramatic phenotypic changes, and transdifferentiate into myofibroblasts. Mechanistically, several key pathways drive HSC activation, most notably platelet-derived growth factor (PDGF) and transforming growth factor-beta (TGF-β) signaling. Whereas most antifibrotic strategies currently in development focus on cell-extrinsic molecules or autonomous receptors required for these signaling pathways, the role of epigenetic regulation in organ fibrogenesis and its therapeutic potential remain unclear.
Here, we investigate the role of genetic enhancers in the HSC-to-myofibroblast transition with the goal of understanding the genomic basis of tissue fibrosis. These studies reveal that bromodomain-containing protein 4 (BRD4), a bromodomain and extraterminal (BET) family member and an important epigenetic reader, is critical for enhancer-mediated profibrotic gene expression in HSCs (4–6). Cistromic analyses reveal BRD4 concentrates at hundreds of enhancers associated with genes involved in multiple profibrotic pathways. Suppression of BRD4-enhancer interactions using a small-molecule inhibitor, JQ1, dramatically blocks HSC activation and significantly compromises their proliferative capacity. Furthermore, in a carbon tetrachloride (CCl4)-induced mouse model of fibrosis, BRD4 inhibitors not only prevent HSC activation but reverse many of the clinical hallmarks of fibrosis. These findings identify BRD4-mediated enhancers as critical genomic regulators of liver fibrosis and provide mechanistic insights into the intrinsic epigenetic vulnerabilities of fibrotic disease that can be exploited for pharmacological intervention.
Results
BRD4 Mediates a Profibrotic Response in Activated HSCs.
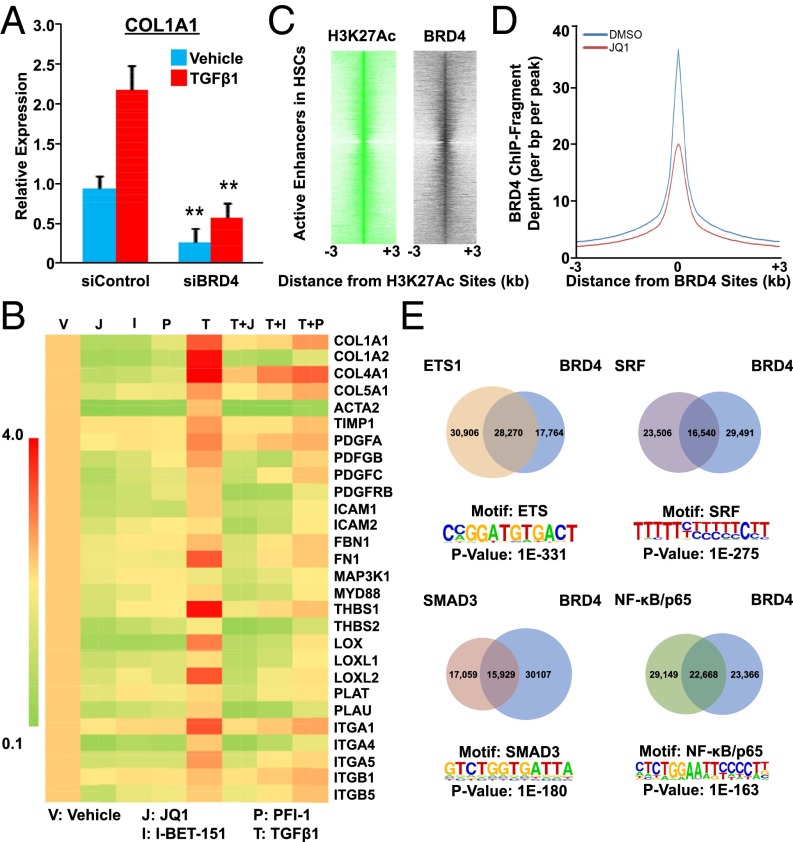
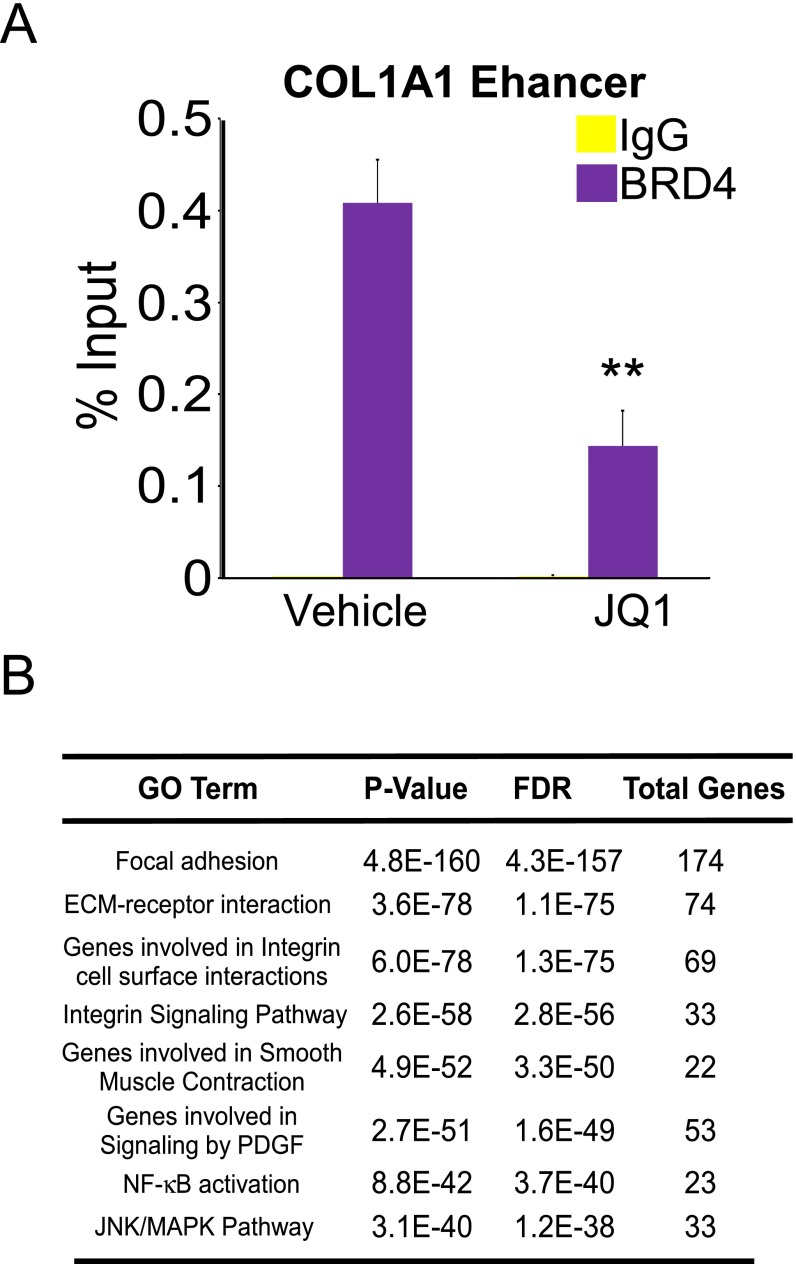
Our previous demonstration of genomic crosstalk between transcription factors determining the fibrotic response in myofibroblasts implicates regulatory enhancers as key genomic mediators in tissue fibrosis (7). The study suggests that selective manipulation of their activity could globally disarm the fibrotic gene network. We hypothesized that epigenetic pathways are important for the profibrotic response in myofibroblasts, particularly given their critical roles in determining cellular and tissue identity as well as modulating disease-relevant enhancer activity (8). In support of this notion, an RNAi-based genetics screen implicated the BET family member BRD4 (9) as a potential regulator for the fibrotic response in LX-2 cells, a human-activated HSC cell line (10). siRNA-mediated depletion of BRD4 resulted in a fourfold reduction of COL1A1 gene expression, a prominent ECM component of tissue fibrosis (Fig. 1A). Importantly, depletion of BRD4 similarly reduced COL1A1 levels in the presence of TGF-β1, a master profibrotic cytokine (2, 3) (Fig. 1A). To further explore the role of BRD4 in fibrosis, we compared the effects of three structurally distinct BRD4 bromodomain inhibitors, JQ1 (9), I-BET-151 (11, 12), and PFI-1 (13), in profibrotic gene expression. Remarkably, all three inhibitors comprehensively suppress profibrotic gene expression, both in the absence and presence of TGF-β1 (Fig. 1B). In addition, chromatin immunoprecipitation (ChIP) studies demonstrate that BRD4 binds to the COL1A1 enhancer locus and this occupancy is significantly reduced by JQ1 treatment (Fig. S1A), suggesting a direct role of BRD4 in modulating profibrotic gene expression.
Fig. 1.
BRD4 modulates profibrotic response from genome in activated HSCs. (A) COL1A1 expression in control (siCNTL) or BRD4-specific (siBRD4) siRNA-transfected LX-2 cells treated with or without TGF-β1 (5 ng/mL for 16 h) as measured by RT-qPCR. Data represent the mean ± SEM of at least three independent experiments performed in triplicate. Asterisks denote statistically significant differences (Student's t test, *P < 0.05, **P < 0.01, ***P < 0.001). (B) Fold change of profibrotic gene expression in LX-2 cells treated with BRD4 inhibitors (JQ1 500 nM; I-BET 500 nM; and PFI-1 500 nM) with or without TGF-β1 (5 ng/mL for 16 h). Gene expression levels in cells treated with vehicle (DMSO) were arbitrarily set as 1. Data represent the mean ± SEM of at least three independent experiments performed in triplicate. (C) Intensity plots showing hierarchical clustering of ChIP-fragment densities as a function of distance from the center of statistically significant H3K27ac peaks (FDR = 0.0001) outside promoter regions (±2 kb of transcription start site). Intensity around position 0 of BRD4 (black) indicates overlapping BET/H3K27ac sites with H3K27ac (green) acting as a positive control. (D) Plots of BRD4 ChIP-Seq signal intensity relative to the center of their binding sites in LX-2 cells (±500 nM JQ1 for 16 h). (E) De novo analysis of most enriched motifs located within 100 bp of BRD4 peaks in LX-2 cells (FDR = 0.0001) and Venn diagram depicting overlap of BRD4 and ETS1/SRF/NF-κB/SMAD3 genomic binding sites in LX-2 cells.
Fig. S1.
Targeting of profibrotic enhancers by BRD4 in activated HSCs. (A) ChIP-qPCR at COL1A1 enhancer region in LX-2 cells treated with DMSO (vehicle) or JQ1 (500 nM, 16 h). Data represent the mean ± SEM of at least three independent experiments performed in triplicate. (B) Gene ontology (GO) analysis (MSigDB) of putative BRD4 target genes in LX-2 cells.
Next, to delineate the molecular mechanism linking BRD4 to the fibrotic gene network, we examined the genome-wide distribution of BRD4 binding relative to histone H3 lysine 27 acetylation (H3K27ac), an epigenetic mark for active enhancers using ChIP coupled with deep sequencing (ChIP-Seq). Notably, BRD4 colocalizes with active enhancers marked by H3K27ac (Fig. 1C), implying that BRD4 is involved in transcriptional regulation of profibrotic genes through regulatory enhancer elements. We further determined the changes in BRD4 binding at these enhancer regions in the absence or presence of the inhibitor, JQ1. As expected, the resulting cistromes reveal that JQ1 treatment dramatically reduces BRD4 occupancy at these active enhancers (Fig. 1D). Closer examination of the BRD4 binding sites revealed a significant enrichment in motifs for prominent profibrotic transcription factors such as ETS1 (14), SRF (15), SMAD3, and NF-κB (16) (Fig. 1E). Because all these factors have been shown to be closely involved in cellular proliferation as well as hepatic stellate cell activation, it is interesting to observe the great overlap between these factors and BRD4, implying the close relationship in hepatic stellate cell proliferation and activation. Subsequent characterization of the genomic locations of these profibrotic transcription factors revealed >40% overlap with BRD4 sites, consistent with the de novo motif analyses (Fig. 1E). Gene ontology (GO) analyses of BRD4 putative target genes include the major profibrotic pathways such as focal adhesion, ECM-receptor interaction, integrin signaling, smooth muscle contraction, PDGF signaling, NF-κB signaling, and JNK/MAPK signaling (5, 17) (Fig. S1B). The results suggest that BRD4 plays critical roles in mediating profibrotic transcription factors to regulate the fibrotic gene network.
BRD4 Inhibition Blocks HSC Activation into Myofibroblasts.
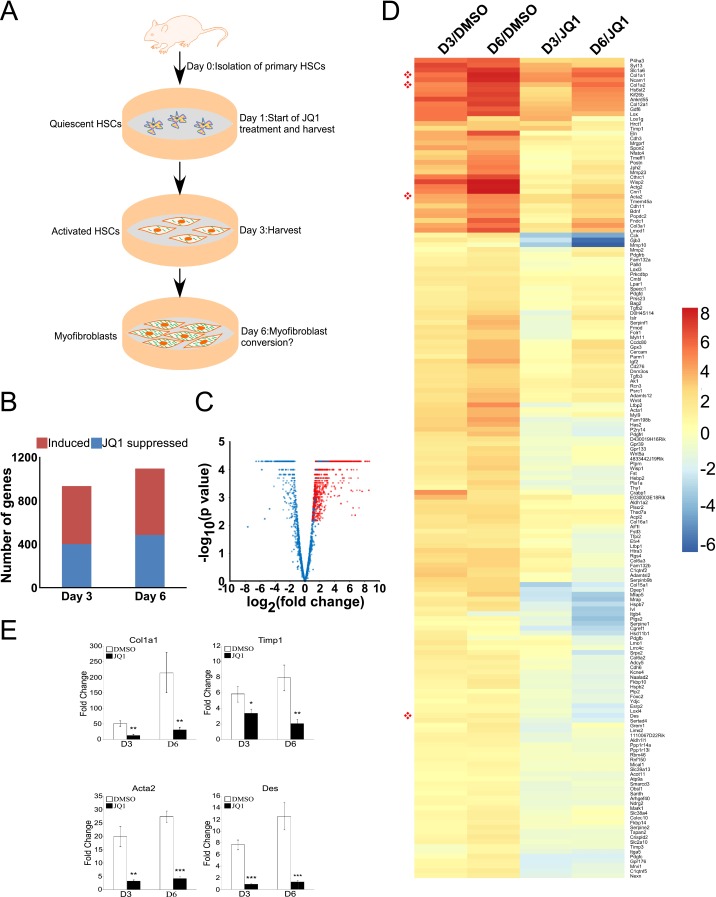
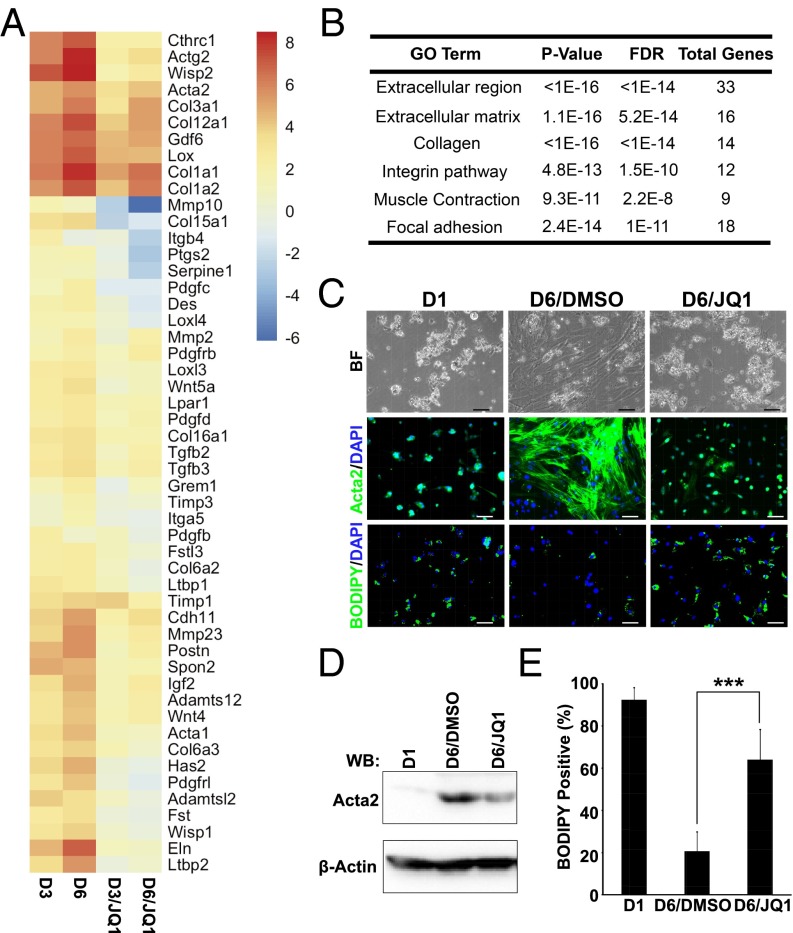
The intrinsic capability of BRD4 enhancers to control profibrotic gene expression prompted us to investigate their regulatory potential in myofibroblast activation using integrative chemical genetics and functional genomics in a conventional HSC-to-myofibroblast self-activation system (Fig. S2A). This in vitro spontaneous differentiation recapitulates the key cellular events such as wound healing, typical of stellate cell activation (18–20). To monitor gene expression changes during this transformation, mRNA-Seq was performed on quiescent primary HSCs (day 1, baseline) and during myofibroblast conversion (days 3 and 6) in the absence or presence of JQ1. This analysis identified >900 up-regulated genes during HSC activation, of which >400 are suppressed by JQ1 treatment (Fig. S2 B and C). The gene expression changes based on the highest magnitude of JQ1-mediated suppression showed that BRD4 regulates inducible gene expression during HSC activation (Fig. S2D). Further gene ontology analysis for the induced genes that are suppressed by JQ1 revealed that BRD4 facilitates the expression of a wide spectrum of biological processes and cellular components known to play critical roles in HSC transdifferentiation into myofibroblasts and liver fibrosis (Fig. 2 A and B). These include extracellular region, extracellular matrix, collagens, integrins, muscle contraction, and focal adhesion, consistent with the GO analysis of BRD4 target genes in LX-2 cells (Fig. S1B). Notably, JQ1 treatment during HSC activation to myofibroblasts represses the induction of key marker genes, including Col1a1, Acta2, Col1a2, and Des to near baseline levels (Fig. 2A and Fig. S2E), suggesting that BRD4 is essential for myofibroblast activation. Indeed, JQ1 treatment of HSCs is sufficient to arrest the phenotypic changes associated with transdifferentiation into myofibroblasts (Fig. 2C). In particular, JQ1-treated cells do not adopt the characteristic, fibroblast-like morphology induced by activation. In addition, JQ1 dramatically reduced the level of smooth muscle actin (ACTA2) and significantly increased lipid content close to the level in quiescent cells (day 1) (Fig. 2 D and E).
Fig. S2.
BRD4 inhibition suppresses profibrotic gene expression during HSC activation into myofibroblasts. (A) Diagram depicting in vitro HSC self-activation system. (B) Total numbers of genes induced during activation (red) and suppression of this induction by JQ1 (blue). (C) Volcano plot showing fold change (x axis) of JQ1 versus DMSO (shades of blue) on all genes up-regulated at both time points (days 3 and 6) versus day 1 (shades of red). Progression from light to dark shading represents increasing time (days 3 and 6). (D) Fold change of selected induced genes in primary activated HSCs treated with DMSO (0.1%) or JQ1 (500 nM) at different time points (days 3 and 6). Euclidean clustering of both rows and columns using log2-transformed mRNA-Seq expression data, n = 3 per treatment group. Bullets (red) indicate key fibrosis marker genes: Col1a1, Col1a2, Acta2, and Des. (E) Col1a1, Acta2, Timp1, and Des qRT-PCR analysis in primary murine HSCs treated with DMSO or JQ1 (500 nM) for indicated period. Data represent the mean ± SEM of at least three independent experiments performed in triplicate. Asterisks denote statistically significant differences (Student's t test, *P < 0.05, **P < 0.01, ***P < 0.001).
Fig. 2.
BRD4 inhibition blocks HSC activation. (A) Fold change of selected induced genes in primary activated HSCs treated with DMSO (0.1%) or JQ1 (500 nM) at different time points (days 3 and 6). Euclidean clustering of both rows and columns using log2-transformed mRNA-Seq expression data, n = 3 per treatment group. Bullets (red) indicate key fibrosis marker genes: Col1a1, Col1a2, Acta2, and Des. (B) Gene ontology (GO) analysis (MSigDB) of activation-induced genes that were suppressed by JQ1. (C) Representative images of quiescent (day 1: D1) and activated (day 6: D6) primary HSCs treated with DMSO (0.1%) or JQ1 (500 nM): bright field (Top), Acta2 immunofluorescence staining (Middle), and BODIPY staining (Bottom). (Scale bar, 50 μm.) (D) Expression of ACTA2 determined by Western blot analysis. (E) Quantitation of lipid-containing cells in C. Data represent the mean ± SEM of at least three independent experiments. Asterisks denote statistically significant differences (Student's unpaired t test, ***P < 0.001).
BRD4 Is a Critical Mitogenic Regulator of HSC Activation.
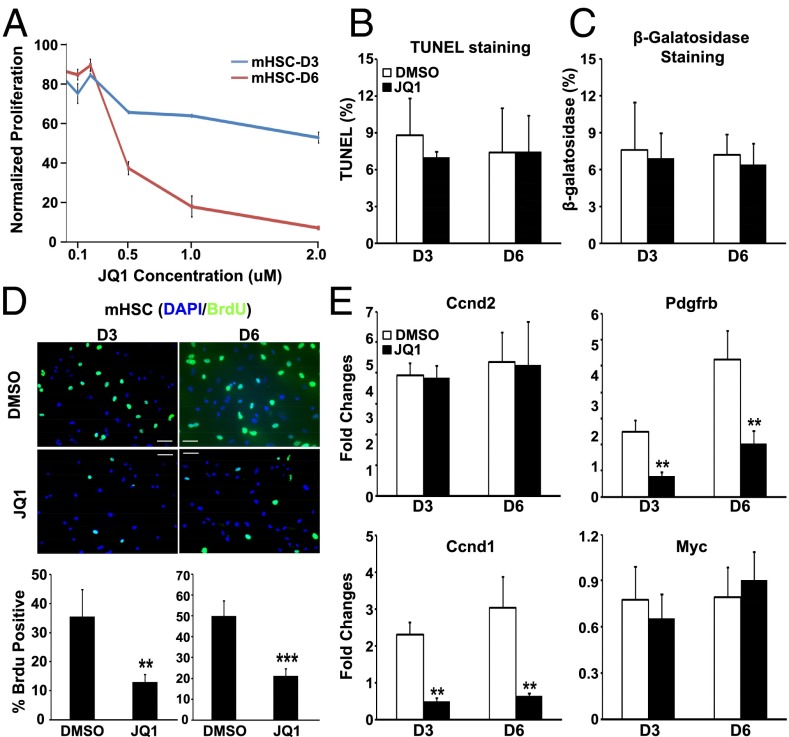
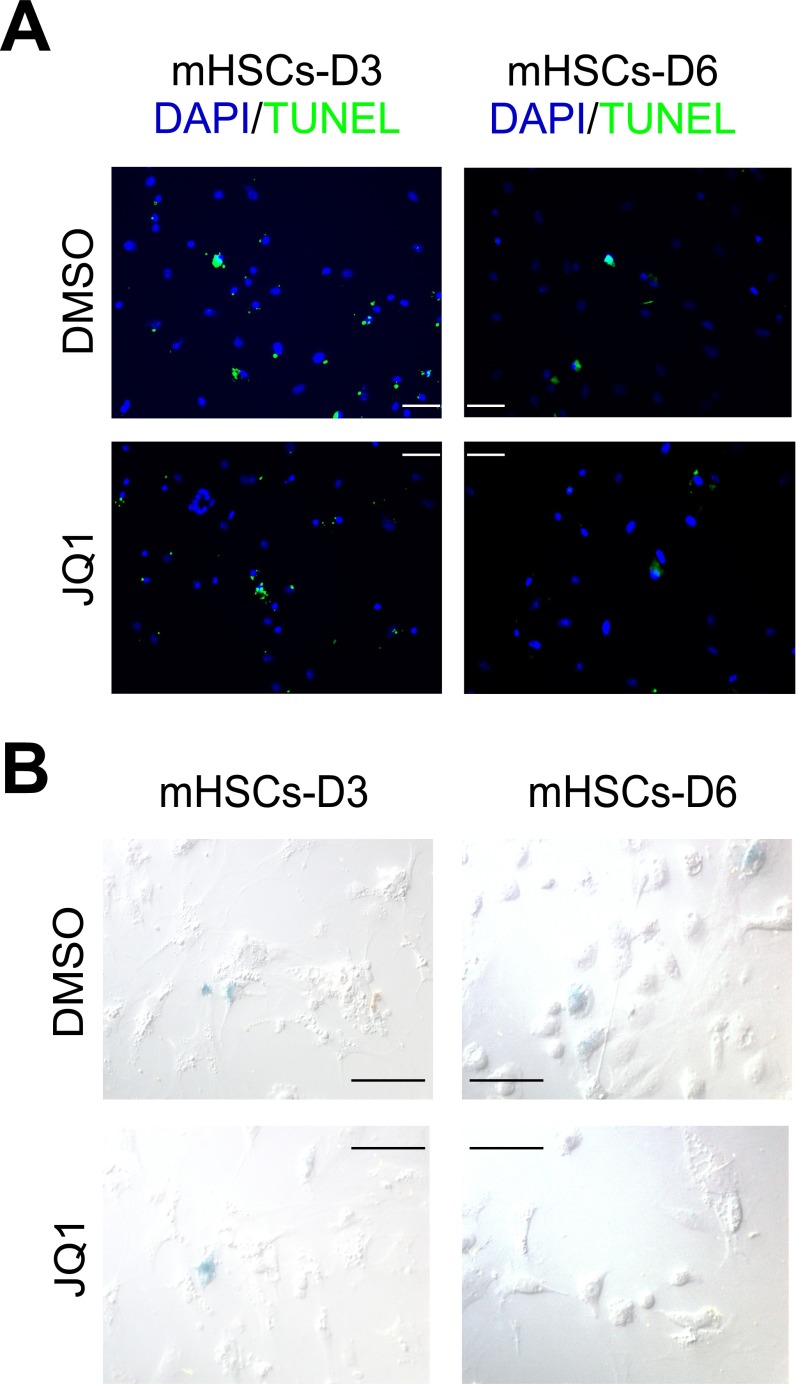
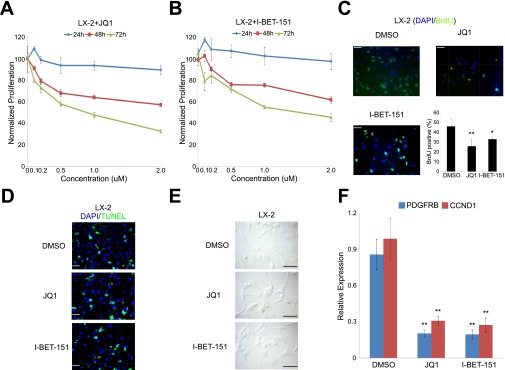
The pathological contributions of activated HSCs in liver fibrosis include not only the induction of profibrotic genes in individual cells, but the necessity of activated cells to proliferate to help repair tissue damage (4, 5, 17). Given the striking results on smooth muscle actin production in Fig. 2A, we examined whether BRD4 inhibition would also inhibit HSC proliferation. Interestingly, JQ1 exhibited significant antiproliferative activity against activated HSCs in a dose-dependent manner (Fig. 3A). To rule out the possibilities that the effects resulted from increased apoptosis or cellular senescence, we performed TUNEL assay (Fig. 3B and Fig. S3A) and measured beta-galactosidase activity (Fig. 3C and Fig. S3B). We confirmed that JQ1 inhibits cellular proliferation, supporting BRD4 as a mitogenic regulator in HSC proliferation. Furthermore, JQ1 treatment significantly reduced BrdU incorporation into activated HSCs (Fig. 3D). It is possible that the inhibitory effect of JQ1 on cellular proliferation forces cells to enter quiescence stage; however, this needs to be further assessed. Given the prominence of PDGF signaling in myofibroblast mitogenicity (21) and our finding that the PDGF pathway is directly targeted by BRD4 enhancers (Fig. S1B), we speculated that BRD4 functionally communicates with this pathway to regulate proliferation in activated HSCs. Consistent with this notion, JQ1 treatment selectively disrupted the induction of the key PDGF pathway component Pdgfrb as well as the downstream mitogenic target Ccnd1 (22) during HSC activation without perturbing Ccnd2 or Myc expression (Fig. 3E). Similar findings were obtained in LX-2 cells (Fig. S4). These findings support the proposal that BRD4 not only controls profibrotic gene expression, but functions as a critical mitogenic regulator of myofibroblast activation.
Fig. 3.
BRD4 inhibition blocks activated HSC proliferation. (A) Normalized proliferative activity of activated HSCs in the presence of the indicated JQ1 concentrations. (B) Apoptosis in JQ1-treated (500 nM) HSCs measured by TUNEL assay. (C) Cellular senescence of JQ1-treated (500 nM) HSCs measured by β-galactosidase staining. (D) BrdU incorporation in control (DMSO) and JQ1-treated (500 nM) HSCs. (E) Fold change in gene expression of Pdgfrb, Ccnd1, Ccnd2, and Myc in primary HSCs treated with DMSO or JQ1 (500 nM), as measured by RT-qPCR. Data represent the mean ± SEM of at least three independent experiments performed in triplicate. Asterisks denote statistically significant differences (Student's t test, *P < 0.05, **P < 0.01, ***P < 0.001). (Scale bar, 50 μM.)
Fig. S3.
No observable proapoptotic or prosenescent effects of JQ1 during HSC activation into myofibroblasts. (A) Representative images of TUNEL staining in primary murine HSCs treated with DMSO or JQ1 (500 nM) at the indicated time points. (B) Representative images of β-galactosidase staining to measure senescence in primary murine HSCs treated with DMSO or JQ1 (500 nM) at the indicated time points.
Fig. S4.
Antiproliferative properties of BET inhibitors in activated human HSCs. Antiproliferative activity of (A) JQ1 and (B) I-BET-151 against LX-2 cells. (C) BrdU incorporation assay in LX-2 cells treated with DMSO or JQ1/I-BET-151 (500 nM) for 72 h. (D) Detection of apoptosis in LX-2 cells treated with DMSO or JQ1/I-BET-151 (500 nM) for 72 h by TUNEL assay. (E) Detection of cellular senenscence in LX-2 cells treated with DMSO or JQ1/I-BET-151 (500 nM) for 72 h by β-galactosidase staining. (F) PDGFRB and CCND1 RT-qPCR analysis in LX-2 cells treated with DMSO or JQ1/I-BET-151 (500 nM) for 72 h. Data represent the mean ± SEM of at least three independent experiments performed in triplicate. Asterisks denote statistically significant differences (Student's t test, *P < 0.05, **P < 0.01, ***P < 0.001). (Scale bar, 50 μM.)
BRD4 Inhibition Is Protective Against Liver Fibrosis.
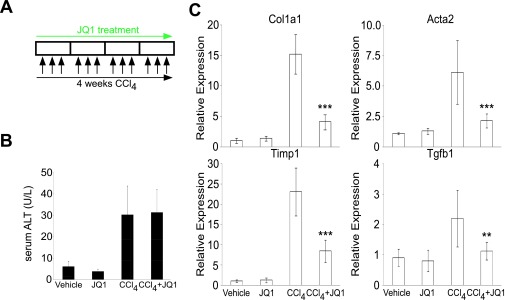
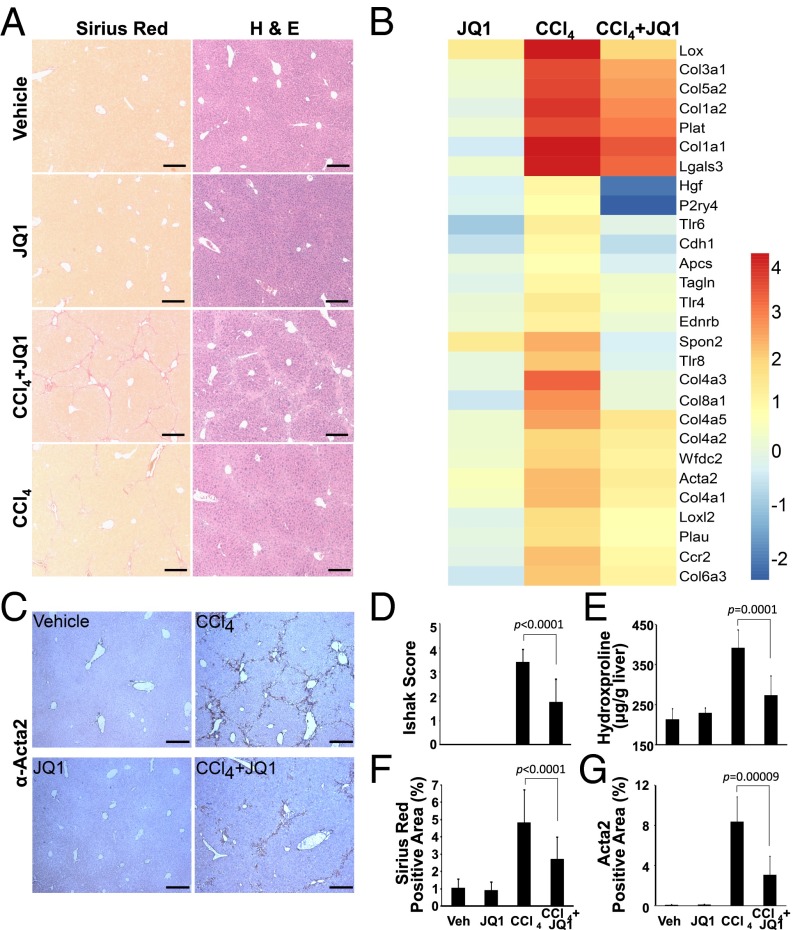
The ability of JQ1 to attenuate multiple facets of HSC activation led us to evaluate BRD4 inhibition as a potential pharmacological treatment for liver fibrosis. In a standard carbon tetrachloride (CCl4) mouse model of liver injury (Fig. S5A), C57BL/6J mice develop extensive bridging fibrosis and substantial collagen deposits after 4 wk of CCl4 exposure. Although JQ1 does not alter the extent of CCl4-induced liver injury, as assessed by serum alanine aminotransferase (ALT) levels (Fig. S5B), cotreatment dramatically reduces the histological indicators of fibrosis, as well as HSC activation markers Col1a1, Acta2, Timp1, and Tgfb1 (Fig. 4A and Fig. S5C). Additionally, JQ1 treatment in combination with CCl4 suppresses the induction of a network of key fibrotic marker genes in the liver (Fig. 4B). Furthermore, HSC activation marker ACTA2 (Fig. 4 C and G), Sirius red staining, hepatic hydroxyproline content (Fig. 4 E and F), and histological fibrotic scoring (Ishak score, Fig. 4D) are all significantly attenuated in JQ1-treated mice.
Fig. S5.
Serum ALT and gene expression analysis in prophylactic model of liver fibrosis. (A) Dosing regime in the preventive liver fibrosis model. (B) Hepatic injury was measured by serum ALT. (C) qRT-PCR measurement of hepatic gene expression levels of Col1a1, Acta2, Tgfβ1, and Timp1. Data represent the mean ± SEM. Asterisks denote statistically significant differences (Student's t test, *P < 0.05, **P < 0.01, ***P < 0.001).
Fig. 4.
BRD4 inhibition protects against liver fibrosis. (A) Sirius red (Left) and hematoxylin and eosin (H&E, Right) staining of livers from 4-wk vehicle [corn oil plus 2-hydroxypropyl-β-cyclodextrin (HP-β-CD), n = 5], JQ1 (corn oil plus JQ1 50 mg/kg i.p., n = 5), carbon tetrachloride (CCl4 0.5 mL/kg plus HP-β-CD i.p., n = 10), and CCl4 plus JQ1 (n = 8) treated C57BL/6J mice. (Scale bar, 250 μm.) (B) Fold change of selected profibrotic genes in liver samples described in A. Euclidean clustering of both rows and columns using log2-transformed mRNA-Seq expression data, n = 3 per treatment group. (C) ACTA2 immunohistochemistry in liver samples described in A. Fibrosis quantified by (D) H&E staining (Ishak score), (E) hydroxyproline content, and (F) Sirius red staining. (G) Quantification of ACTA2 immunohistochemical staining in C. Data represent the mean ± SEM. Statistical significances are as indicated.
JQ1 Is a Potential Therapeutic for Liver Fibrosis.
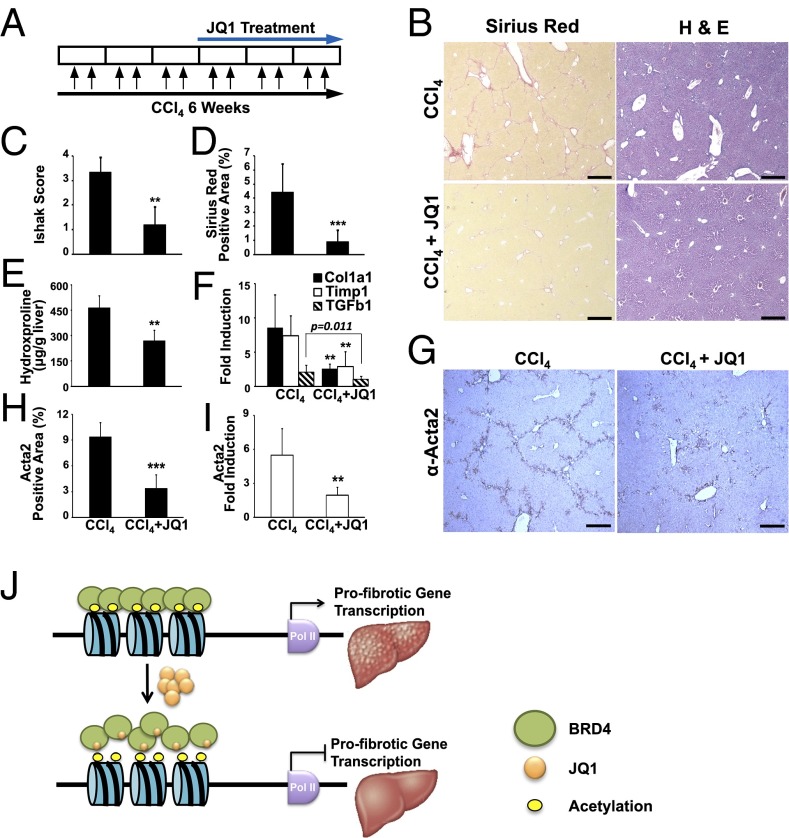
The dramatic antifibrotic properties of JQ1 in vitro and in vivo led us to ask whether BRD4 inhibition could reverse liver fibrosis as an intervention therapy. To address this question, liver fibrosis was initiated in C57BL/6J mice by 3 wk of CCl4 exposure followed by CCl4/JQ1 cotreatment for an additional 3 wk (Fig. 5A). Despite the preexisting damage, JQ1 appears to reverse or at least prevent the further progression of liver fibrosis as determined by histological scoring, quantitation of Sirius red staining, hepatic hydroxyproline content, and profibrotic marker gene expression (Fig. 5 B–F). In addition, CCl4-induced HSC activation is dramatically reduced by JQ1 treatment, as measured by quantitative ACTA2 immunohistochemistry (Fig. 5 G–I). Taken together, our findings demonstrate that small molecule-mediated bromodomain inhibition of BRD4 has the capability to ameliorate liver fibrosis.
Fig. 5.
Therapeutic benefits of BRD4 inhibition in liver fibrosis. (A) Dosing regime in the therapeutic liver fibrosis model. (B) Livers from 6-wk-treated C57BL/6J mice (CCl4, n = 10; CCl4+JQ1, n = 10) stained with Sirius red (Left) and hematoxylin and eosin (H&E, Right). (Scale bar, 250 μm.) Fibrosis quantified by (C) H&E staining (Ishak score), (D) Sirius red staining, and (E) hydroxyproline content. (F) Hepatic expression of Col1a1 and Timp1 measured by qRT-PCR. (G) HSC activation, determined by ACTA2 immunohistochemistry. (H) Quantification of ACTA2 immunohistochemical staining in G. (I) Hepatic expression of Acta2 measured by qRT-PCR. (J) Model depicting proposed epigenetic control of liver fibrogenesis by BETs. Data represent the mean ± SEM. Asterisks denote statistically significant differences (Student's unpaired t test, **P < 0.01, ***P < 0.001).
Discussion
Fibrosis is a complex disease, driven at the cellular level by activation of quiescent HSCs and characterized by the sustained induction of a fibrotic gene program. Unabated fibrosis, such as with viral infection or fatty liver disease, eventually progresses to liver failure and results in the major cause of hepatocellular carcinoma. Given that traditional antifibrotic therapies typically target single pathways, their limited clinical benefits are perhaps not surprising. Thus, despite the recent FDA approval of pirfenidone (Esbriet) and nintedanib (Ofev) as first-line antifibrotic therapies, additional new therapies are needed.
Our recent study of genomic regulatory pathways critical for liver fibrogenesis identified the vitamin D receptor as a key mediator of liver maintenance and stellate cell activation (7). This work led us to explore the epigenetic foundation that underpins the switch between HSC activation and quiescence. Further screening analyses identified BRD4 as a potent driver of the fibrotic response. The enrichment of BRD4 binding at the distal enhancer of profibrotic genes provides previously unidentified mechanistic insight into the injury response. Indeed, the remarkable efficacy of the BRD4 inhibitor JQ1 in preventing liver injury and reversing or limiting the progression of existing fibrosis is, in part, due to the enhanced sensitivity of BRD4-enhancer association to pharmacological intervention.
In sum, our studies on BRD4-mediated profibrotic enhancer activity identified intrinsic genomic and epigenetic mechanisms that can be exploited pharmaceutically to ameliorate liver fibrosis (Fig. 5J). Given that myofibroblasts are a common pathological cell type underlying nearly all fibrotic diseases, targeting profibrotic enhancers through bromodomain inhibition may have clinical benefits in a wide variety of poorly controlled scarring responses.
Materials and Methods
Animals, Cell Culture, and Reagents.
Primary HSCs were isolated from 16-wk-old male C57BL/6J mice by in situ pronase, collagenase perfusion, and single-step Histogenz gradient as previously reported. LX-2 cells, a generous gift from Scott Friedman (Mount Sinai School of Medicine, New York) were cultured as described previously (10). JQ1 (Cayman Chemical) and CCl4 (Sigma) are treated as indicated in each experiment. All experimental procedures have been approved by and informed consent was obtained from the Institutional Animal Care and Use Committee at the Salk Institute for Biological Studies.
Quantitative RT-PCR.
Total RNA was purified following TRIzol extraction and treated with DNaseI (Life Technologies). cDNA synthesis was carried out with iScript RT Supermix (Bio-Rad). Quantitative PCR was performed in technical triplicates using SYBR Green reagent (Bio-Rad). The relative standard curve method was used for quantitation (Bio-Rad). Expression levels were calculated by normalization to either Gapdh (mouse) or U36B4 (human).
RNA-Seq and Data Analysis.
HSCs isolated from mouse livers were cultured on plastic for 24 h (day 1) before DMSO or JQ1 treatment for 2 (day 3) or 5 (day 6) additional days, with biological duplicates for all treatments. Total RNA was isolated using TRIzol (Invitrogen) and the RNeasy mini kit (Qiagen). RNA purity and integrity were confirmed using an Agilent Bioanalyzer. Libraries were prepared from 100 ng total RNA (TrueSeq v2, Illumina) and singled-ended sequencing was performed on the Illumina HiSEq. 2500, using bar-coded multiplexing and a 100-bp read length, yielding a median of 34.1 M reads per sample. Read alignment and junction finding was accomplished using STAR (23) and differential gene expression with Cuffdiff 2 (24), using the University of California Santa Cruz (UCSC) mm9 as the reference sequence.
RNAi-Based Screen.
siRNAs recognizing epigenetic regulators were plated in a 96-well format before transfection into LX-2 cells in the presence or absence of TGF-β. After 72 h, cells were lysed for RNA extraction and cDNA synthesis followed by high-throughput qPCR on the Wafergene SmartChip platform. Gene expression was used as readout to identify hits that are important for fibrotic response.
Transfection of siRNAs.
Transfection was carried out at a concentration of 10 nM of indicated siRNAs (Dharmacon) using RNAiMax transfection reagent (Invitrogen). Transfected cells were cultured without perturbation for at least 72 h before terminal assays.
CCl4 Model of Liver Injury and Fibrosis.
For the preventive study, 6-wk-old male C57BL/6J mice were i.p. injected with 0.5 mL/kg body weight CCl4 (1:50 vol/vol in corn oil from Sigma) or corn oil three times a week for 4 wk. JQ1 (50 mg/kg body weight) or vehicle [10% (wt/vol) (2-hydroxypropyl)-β-cyclodextrin (HP-β-CD) from Sigma] was administered by i.p. injection five times a week, commencing with the first dose of CCl4 or corn oil. The animals were killed 72 h after the final CCl4 injection and whole livers were collected for histological, cytological, biochemical, and molecular analyses. For therapeutic study, 6-wk-old male C57BL/6J mice were first i.p. injected with 0.5 mL/kg body weight CCl4 three times a week for 3 wk to establish liver fibrosis. The same study group was then continuously i.p. injected with 0.5 mL/kg body weight CCl4 three times a week for another 3 wk with JQ1 (50 mg/kg body weight) or vehicle (10% HP-β-CD) coadministration by i.p. injection five times a week.
Fibrotic Score and Quantification of Collagen and Hydroxyproline Content.
The 5-µm sections of formalin-fixed and paraffin-embedded specimens were stained with hematoxylin and eosin (H&E) and Sirius red and reviewed by a pathologist, who was blinded to the experimental conditions. Liver fibrosis was evaluated semiquantitatively using the Ishak modified histological activity index (HAI) scoring system. Liver fibrosis was quantified using ImageJ software on 10 noncontiguous Sirius red-stained sections. Kidney fibrosis was quantified using hydroxyproline assay. All images were obtained using a high-resolution Leica DFC420 digital camera mounted on an Olympus microscope equipped with 4×/0.13, 10×/0.30, 20×/0.50, and 40×/0.75 UplanFL N plan objective lenses and processed with the Leica Application Suite. Tissue hydroxyproline content was measured using a kit from Biovision (K555-100).
Serum ALT Assay.
The ALT activity in mice serum was measured using a kit from Thermo Scientific (TR71121).
Cell Viability Assay.
Primary HSCs or LX-2 cells were seeded onto 96-well tissue culture plates. At 24 h later, cells were treated with JQ1 at a series of concentrations for indicated periods before the luciferase-based cell viability assay using CellTiter Glo kit (Promega, G7571) was performed.
Cell Proliferation Assay.
Primary HSCs or LX-2 cells cultured on four-well chamber slides were treated with BrdU (3 μg/mL) for 4 h followed by immunostaining using Alexa Fluor 488-conjugated mouse monoclonal BrdU antibody (Life Sciences, B35130). BrdU-positive cells were counted under a fluorescent microscope (Olympus, IX51).
TUNEL Assay.
Primary HSCs or LX-2 cells cultured on four-well chamber slides (Nalge Nunc, 154917) were subjected to TUNEL assay using the DeadEnd Fluorometric TUNEL System (Promega, G3250).
Cellular Senescence Staining.
Primary HSCs or LX-2 cells cultured on four-well chamber slides (Nalge Nunc, 154917) in the presence of DMSO (0.1%) or JQ1 (500 nM) were stained for senescence using a β-galactosidase staining kit (Cell Signaling, 9860s).
Lipid Droplet Accumulation Assay.
Primary murine HSCs were seeded onto chamber slides (Nunc). After overnight attachment, cells were treated with DMSO or 500 nM JQ1 for another 5 d. Media were aspirated and cells were washed twice with PBS (Gibco) and fixed in 10% (vol/vol) buffered formalin at room temperature for 15 min. Fixative was removed and cells were washed three times with PBS. Cells were then stained with 1 μg/mL 4,4-difluoro-1,3,5,7,8-pentamethyl-4-Bora-3a,4a-Diaza-s-Indacene (BODIPY 493/503, Molecular Probes) for 1 h at room temperature, protected from light. Dye was removed and cells were washed three times with PBS, then mounted using Vectastain mounting medium (Vector Labs). Fluorescence was visualized through the GFP filter on a Leica DM5000B fluorescent microscope. Nuclear counterstaining was performed using DAPI (Vector).
Immunocytochemistry.
Primary murine HSCs were seeded onto chamber slides (Nunc). After overnight attachment, cells were treated with DMSO or 500 nM JQ1 for another 5 d. Media were aspirated and cells were washed twice with PBS (Gibco) and fixed in 10% buffered formalin at room temperature for 15 min. Fixative was removed and cells were washed three times with PBS. The slides were then blocked with 3% BSA and incubated with rabbit anti-ACTA2 antibody (at 1:100 dilution; Abcam) overnight at 4 °C. After washing, the slides were incubated for 1 h with Alexa Fluor 546-labeled donkey anti-rabbit IgG antibody (at 1:200 dilution; Invitrogen). Finally, the slides were analyzed for fluorescence using an all-in-one type fluorescent microscope (BioZero BZ-9000; Keyence). Nuclear counterstaining was performed using DAPI (Vector).
Immunohistochemistry.
Liver samples were deparaffinized and rehydrated in PBS. Following antigen retrieval with the target retrieval solution (Dako), endogenous peroxidase activity was blocked by incubation with 0.3% hydrogen peroxide. After immersion in diluted normal rabbit serum, the sections were sequentially incubated with rabbit anti-ACTA2 antibody (at 1:2,000 dilution; Abcam) for 1 h at 25 °C and biotinylated anti-rabbit IgG secondary antibody, followed by biotinylated enzyme-conjugated avidin. The color was developed by incubating the slides for several minutes with diaminobenzidine (Dojindo). Counterstaining was performed using Haematoxylin (Sigma).
Chromatin Immunoprecipitation.
LX-2 cells were treated with DMSO (0.1%) or JQ1 (500 nM) for 16 h. Cells were then harvested for ChIP assay. The experimental procedure for ChIP was as previously described. Briefly, after fixation, nuclei from LX-2 cells were isolated, lysed, and sheared with a Diagenode Bioruptor to yield DNA fragment sizes of 200–1,000 bp followed by immunoprecipitation using antibodies listed below: ETS1 (Santa Cruz, sc-350), SRF (Santa Cruz, sc-335), NF-κB (Santa Cruz, sc-372), SMAD3 (Abacm, ab28379), BRD2 (Bethyl, A302-583A), BRD3 (Bethyl, A310-859A), BRD4 (Bethyl, A301-985A) (1), PAF1 (Bethyl, A300-173A) (2), CDK9 (Santa Cruz, sc-484) (D0913), Pol II (Santa Cruz, sc-899) (C1413), Pol II S2p (Abcam, ab5095) (GR104063-1), and Pol II S5p (Abacm, ab5131) (GR104067-1).
ChIP-Seq Data Analysis.
The procedure was as previously described (7, 25). Briefly, short DNA reads were demultiplexed using Illumina CASAVA v1.8.2. Reads were aligned against the human hg18 (NCBI Build 36.1) using the Bowtie aligner allowing up to two mismatches in the read. Only tags that map uniquely to the genome were considered for further analysis. Subsequent peak calling and motif analysis were conducted using HOMER, a software suite for ChIP-Seq analysis. The methods for HOMER, which are described below, have been implemented and are freely available at biowhat.ucsd.edu/homer/. One tag from each unique position was considered to eliminate peaks resulting from clonal amplification of fragments during the ChIP-Seq protocol. Peaks were identified by searching for clusters of tags within a sliding 200-bp window, requiring adjacent clusters to be at least 1 kb away from each other. The threshold for the number of tags that determine a valid peak was selected for a false discovery rate (FDR) of <0.01, as empirically determined by repeating the peak finding procedure using randomized tag positions. Peaks are required to have at least fourfold more tags (normalized to total count) than input or IgG control samples and fourfold more tags relative to the local background region (10 kb) to avoid identifying regions with genomic duplications or nonlocalized binding. Peaks are annotated to gene products by identifying the nearest RefSeq transcriptional start site. Visualization of ChIP-Seq results was achieved by uploading custom tracks onto the UCSC genome browser.
Statistics.
All data are presented as means ± SE. The two-tailed unpaired Student’s t test or one-way ANOVA with Bonferroni’s multiple comparison was used to determine the significance of difference between datasets. These differences were considered statistically significant when P ≤ 0.05.
Acknowledgments
We thank C. Brondos and E. Ong for administrative assistance, Y. Dai and J. Nery for assistance with RNA and DNA sequencing, and H. Juguilon and J. Alvarez for technical assistance. N.D. was supported by Grant K01DK102867. This work was funded by the NIH (Grants DK057978, HL105278, DK090962, HL088093, ES010337, and CA014195) and National Health and Medical Research Council of Australia Project Grants 512354 and 632886 (to C.L. and M.D.), as well as the Leona M. and Harry B. Helmsley Charitable Trust (2012-PG-MED002), Samuel Waxman Cancer Research Foundation, and Ipsen/Biomeasure. R.M.E. and M.D. are supported in part by a Stand Up to Cancer Dream Team Translational Cancer Research Grant, a program of the Entertainment Industry Foundation (SU2C-AACR-DT0509). R.M.E. is an investigator of the Howard Hughes Medical Institute and March of Dimes Chair in Molecular and Developmental Biology at the Salk Institute.
Footnotes
Conflict of interest statement: N.D., R.T.Y., M.H.S., C.L., M.D., and R.M.E. are coinventors of technologies related to methods of treating fibrosis using BET inhibitors and may be entitled to royalties.
Data deposition: The RNA-Seq data reported in this paper have been deposited in the National Center for Biotechnology Information (NCBI) Sequence Read Archive (SRA) database (accession no. SRP043435). The ChIP-Seq data reported in this paper have been deposited in the Gene Expression Omnibus (GEO) database, www.ncbi.nlm.nih.gov/geo (accession no. GSE58680).
This article contains supporting information online at www.pnas.org/lookup/suppl/doi:10.1073/pnas.1522163112/-/DCSupplemental.
References
- 1.Wynn TA, Ramalingam TR. Mechanisms of fibrosis: Therapeutic translation for fibrotic disease. Nat Med. 2012;18(7):1028–1040. doi: 10.1038/nm.2807. [DOI] [PMC free article] [PubMed] [Google Scholar]
- 2.Friedman SL, Sheppard D, Duffield JS, Violette S. Therapy for fibrotic diseases: Nearing the starting line. Sci Transl Med. 2013;5(167):167sr1. doi: 10.1126/scitranslmed.3004700. [DOI] [PubMed] [Google Scholar]
- 3.Wynn TA. Cellular and molecular mechanisms of fibrosis. J Pathol. 2008;214(2):199–210. doi: 10.1002/path.2277. [DOI] [PMC free article] [PubMed] [Google Scholar]
- 4.Bataller R, Brenner DA. Liver fibrosis. J Clin Invest. 2005;115(2):209–218. doi: 10.1172/JCI24282. [DOI] [PMC free article] [PubMed] [Google Scholar]
- 5.Friedman SL. Hepatic stellate cells: Protean, multifunctional, and enigmatic cells of the liver. Physiol Rev. 2008;88(1):125–172. doi: 10.1152/physrev.00013.2007. [DOI] [PMC free article] [PubMed] [Google Scholar]
- 6.Mederacke I, et al. Fate tracing reveals hepatic stellate cells as dominant contributors to liver fibrosis independent of its aetiology. Nat Commun. 2013;4:2823. doi: 10.1038/ncomms3823. [DOI] [PMC free article] [PubMed] [Google Scholar]
- 7.Ding N, et al. A vitamin D receptor/SMAD genomic circuit gates hepatic fibrotic response. Cell. 2013;153(3):601–613. doi: 10.1016/j.cell.2013.03.028. [DOI] [PMC free article] [PubMed] [Google Scholar]
- 8.Lee TI, Young RA. Transcriptional regulation and its misregulation in disease. Cell. 2013;152(6):1237–1251. doi: 10.1016/j.cell.2013.02.014. [DOI] [PMC free article] [PubMed] [Google Scholar]
- 9.Filippakopoulos P, et al. Selective inhibition of BET bromodomains. Nature. 2010;468(7327):1067–1073. doi: 10.1038/nature09504. [DOI] [PMC free article] [PubMed] [Google Scholar]
- 10.Xu L, et al. Human hepatic stellate cell lines, LX-1 and LX-2: New tools for analysis of hepatic fibrosis. Gut. 2005;54(1):142–151. doi: 10.1136/gut.2004.042127. [DOI] [PMC free article] [PubMed] [Google Scholar]
- 11.Dawson MA, et al. Inhibition of BET recruitment to chromatin as an effective treatment for MLL-fusion leukaemia. Nature. 2011;478(7370):529–533. doi: 10.1038/nature10509. [DOI] [PMC free article] [PubMed] [Google Scholar]
- 12.Nicodeme E, et al. Suppression of inflammation by a synthetic histone mimic. Nature. 2010;468(7327):1119–1123. doi: 10.1038/nature09589. [DOI] [PMC free article] [PubMed] [Google Scholar]
- 13.Fish PV, et al. Identification of a chemical probe for bromo and extra C-terminal bromodomain inhibition through optimization of a fragment-derived hit. J Med Chem. 2012;55(22):9831–9837. doi: 10.1021/jm3010515. [DOI] [PMC free article] [PubMed] [Google Scholar]
- 14.Trojanowska M. Ets factors and regulation of the extracellular matrix. Oncogene. 2000;19(55):6464–6471. doi: 10.1038/sj.onc.1204043. [DOI] [PubMed] [Google Scholar]
- 15.Small EM. The actin-MRTF-SRF gene regulatory axis and myofibroblast differentiation. J Cardiovasc Transl Res. 2012;5(6):794–804. doi: 10.1007/s12265-012-9397-0. [DOI] [PubMed] [Google Scholar]
- 16.Seki E, et al. TLR4 enhances TGF-beta signaling and hepatic fibrosis. Nat Med. 2007;13(11):1324–1332. doi: 10.1038/nm1663. [DOI] [PubMed] [Google Scholar]
- 17.Hernandez-Gea V, Friedman SL. Pathogenesis of liver fibrosis. Annu Rev Pathol. 2011;6:425–456. doi: 10.1146/annurev-pathol-011110-130246. [DOI] [PubMed] [Google Scholar]
- 18.Bachem MG, Meyer D, Melchior R, Sell KM, Gressner AM. Activation of rat liver perisinusoidal lipocytes by transforming growth factors derived from myofibroblastlike cells. A potential mechanism of self perpetuation in liver fibrogenesis. J Clin Invest. 1992;89(1):19–27. doi: 10.1172/JCI115561. [DOI] [PMC free article] [PubMed] [Google Scholar]
- 19.Friedman SL, Roll FJ, Boyles J, Arenson DM, Bissell DM. Maintenance of differentiated phenotype of cultured rat hepatic lipocytes by basement membrane matrix. J Biol Chem. 1989;264(18):10756–10762. [PubMed] [Google Scholar]
- 20.Geerts A, et al. In vitro differentiation of fat-storing cells parallels marked increase of collagen synthesis and secretion. J Hepatol. 1989;9(1):59–68. doi: 10.1016/0168-8278(89)90076-7. [DOI] [PubMed] [Google Scholar]
- 21.Wong L, Yamasaki G, Johnson RJ, Friedman SL. Induction of beta-platelet-derived growth factor receptor in rat hepatic lipocytes during cellular activation in vivo and in culture. J Clin Invest. 1994;94(4):1563–1569. doi: 10.1172/JCI117497. [DOI] [PMC free article] [PubMed] [Google Scholar]
- 22.Chen H, et al. PDGF signalling controls age-dependent proliferation in pancreatic β-cells. Nature. 2011;478(7369):349–355. doi: 10.1038/nature10502. [DOI] [PMC free article] [PubMed] [Google Scholar]
- 23.Dobin A, et al. STAR: Ultrafast universal RNA-seq aligner. Bioinformatics. 2013;29(1):15–21. doi: 10.1093/bioinformatics/bts635. [DOI] [PMC free article] [PubMed] [Google Scholar]
- 24.Trapnell C, et al. Differential analysis of gene regulation at transcript resolution with RNA-seq. Nat Biotechnol. 2013;31(1):46–53. doi: 10.1038/nbt.2450. [DOI] [PMC free article] [PubMed] [Google Scholar]
- 25.Barish GD, et al. Bcl-6 and NF-kappaB cistromes mediate opposing regulation of the innate immune response. Genes Dev. 2010;24(24):2760–2765. doi: 10.1101/gad.1998010. [DOI] [PMC free article] [PubMed] [Google Scholar]


