

Abstract
Study objective
Medication history is an essential part of patient assessment in emergency care. Patient-reported medication history can be incomplete. We study whether an electronic pharmacy-sourced prescription record can supplement the patient-reported history.
Methods
In a community hospital, we compared the patient-reported history obtained by triage nurses to a proprietary electronic pharmacy record in all emergency department (ED) patients during 3 months.
Results
Of 9,426 triaged patients, 5,001 (53%) had at least 1 (mean 7.7) prescription medication in the full-year electronic pharmacy record. Counting only recent prescription medications (supply lasting to at least 7 days before the ED visit), 3,688 patients (39%) had at least 1 (mean 4.0) recent medication. After adjustment for possible false-positive results, recent electronic prescription medication record enriched the patient-reported history by 28% (adding 1.1 drugs per patient). However, only 60% of patients with any active prescription medications from either source had any recent prescription medications in their electronic pharmacy record.
Conclusion
The electronic pharmacy prescription record augments the manually collected history.
INTRODUCTION
Background
The patient’s medication history cues physicians about patient problems and provides information needed for removing, adjusting, or adding therapies, and it is valued highly by physicians.1 The Joint Commission2 and Meaningful Use regulation3 ask hospitals to obtain and reconcile a medication history at each emergency department (ED) visit or hospital admission. Direct inquiries to pharmacies uncover medications not reported by the patient in up to 53% of hospitalized patients.4,5 The systematic review by Tam et al6 found omissions in 10% to 61% of the patient medication histories across 22 studies, and these failures caused 25% of the reported prescribing errors.
Importance
In the United States today, almost every prescription and refill is processed through a computer and records of their dispensing (or a close equivalent) are carried in large umbrella computer systems of pharmacy benefits managers, payers, and other organizations. Records for prescriptions not covered by commercial insurance, eg, those filled by fee-for-service Medicaid and the Veterans Administration, are usually not sent to a pharmacy benefit manager, but they are saved to some central computer system, eg, the Veterans Administration Medication Database.7
Today, providers can access many of these central systems for some of their patients through a collaboration of 40 pharmacy benefit managers, payers, and pharmacies. Surescripts (Minneapolis, MN, and Arlington, VA) is a proprietary system that provides access to these collaborating sources as a commercial real-time service.8 Currently, this electronic product processes 2.5 billion US prescriptions per year, representing 60% to 70% of the US prescriptions covered by commercial insurance.
Goals of This Investigation
We sought to describe the change in medication knowledge gained by using this proprietary system in 1 ED.
MATERIALS AND METHODS
Study Design and Setting
We collected data in the Suburban Hospital ED, a 225-bed community hospital and regional trauma center in Bethesda, MD, with 45,000 visits per year. We studied all patients within the 3-month study period, and the Office of Human Subjects Research at the National Institutes of Health and the institutional review board of Suburban Hospital deemed the study exempt from consent requirements.
ED nurses routinely collected a medication history from their patients and entered it into the hospital information system as part of their intake process. At this study, medication names were entered as free text, which was flexible, eg, it allowed entry of “blood pressure drug” when the exact medication was not known, but prone to misspelling of drug names. During the trial period, pharmacists reviewed the triage medication history with the patients, within 0.5 to 4 hours during the day shift.
To retrieve a patient’s prescription records, we sent the first and last name, birth date, zip code, and sex for matching in the proprietary database, which then reported whether the patient was in its registry and delivered to the ED records the name, code, dispensing date, amount dispensed and prescriber’s name for each prescription, and refill record it carried for that patient. All communication occurred automatically and electronically according to the Health Level Seven V.2 messaging standard9 as described by Frisse et al.10 Building on the open-source health care data integration product, Mirth,11 a contractor (software engineer) who was not part of the research team, developed software that routed and saved the messages, gathered additional patient characteristics from the hospital information system, linked the electronic prescription record to their corresponding ED history, and deidentified them per the Health Insurance Portability and Accountability Act of 1996 rules.12 Researchers on this project had access only to deidentified data. After the trial period ended, a printed and easy-to-read graphic, timeline summary of each patient’s full-year prescription records was delivered to the ED staff (Figure 1)
Figure 1.
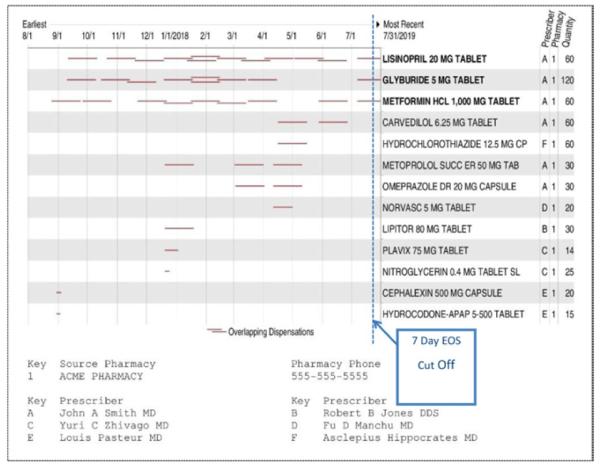
Dispensing of each medication over time. Each red, horizontal line represents a single new prescription or refill, and its length represents the calculated duration of the supply dispensed. We considered any medication with a duration line that crossed the blue dashed vertical line (end of supply is within 7 days of ED visit) to be a recent medication. The document lists the prescribers for each medication. This example patient had 6 different prescribers (fictitious names shown), 13 medications of which the first 3 were considered recent. This report is produced by the NLM/Health Level Seven server and is not the native report delivered by Surescripts.
To standardize the raw medication names from both history sources, we converted their drug names into RxNorm13 generic ingredient names by lexical matching supplemented with manual review and added important distinctions about route (eg, topical versus systemic) when needed. We ignored dosage forms (eg, tablets versus liquid) and strength in our primary analysis, but we tallied the ED medication entries that did not include that information. When a medication contained multiple ingredients, we used all of its ingredient names in alphabetic order as its standardized generic name. To simplify the comparison, we ignored strengths and all item names that were not drugs (eg, insulin needles), could not be resolved to a specific drug (eg, “blood pressure drug”), or were unrecognizable.
To compare the 2 sources for each patient, we first created a list of unique ED medications by removing any duplicate medication names that appeared when we standardized the names in the raw ED medication history. We call this the ED raw medication list. The patient’s electronic prescription report included a full year of dated prescription and refill records. For each patient, we produced a list of unique electronic medications prescribed anytime in the previous year. We call this the raw full electronic list. We also defined a raw recent electronic list, which included all medications whose supply should last until at least 7 days before the ED visit. We used the 7-day buffer based on the design by Lau et al5 to compensate for hoarding and skipped medication doses.
We identified over-the-counter medications in these lists by matching the generic ingredient names in both sources against the Food and Drug Administration’s compendium of generic over-the-counter medication names,14 using lexical matching with manual review. When a medication such as ibuprofen was over-the-counter at low strength coupled with a prescription medication at a higher strength, we classified it as over-the-counter. The electronic records contained drugs obtained only with a prescription, but some of them were over-the-counter medications. For our primary analysis, we removed the over-the-counter medications to generate prescription-medication-only versions of the 3 medication lists described above. We call these lists the ED medication list, the full electronic list, and recent electronic list, respectively. And these lists carry no over-the-counter medications as defined above. We created these lists to obtain identical comparisons between what the electronic pharmacy record is designed to carry, namely, prescription medications and the same kinds of drugs in the ED history.
As our best approximation of a patient’s active prescription medications, we took the unique prescription medications contained in the union of the ED medication list and the recent electronic list for a given patient and called it the active medication list. We used this active medication list as the reference criterion for assessing the completeness of a patient’s ED medication list and the recent electronic list.
To test the effect of changing the end of supply cutoff point on the likelihood that a medication in the full electronic list would be included in the active medication list, we also generated electronic medication lists based on other cutoff points (eg, 30 days, 90 days, 1 year).
The hospital information system time-stamps the start of the triage process and the completion of the medication history. The Health Level Seven messages that request the electronic pharmacy data and the Mirth system record time stamps for each message arrival and departure. We used these time stamps to calculate the time required to obtain the 2 respective histories.
We used drug classes according to Budnitz et al15 that were associated with adverse events and hospitalizations to categorize and assess high-risk drugs. These included anticoagulants, anticonvulsants, digitalis glycosides, injectable hypoglycemics (insulin and exenatide), lithium, opioids, oral hypoglycemics, and theophylline. To determine how the electronic record compared with the ED history at reporting these high-risk drug classes, we determined the rate at which the recent electronic list, the full-year list, and the ED medication list detected drugs in each of these high-risk classes compared with our criterion standard active medication list.
After the trial period, pharmacists integrated the timeline report (Figure 1) generated from the electronic pharmacy record into their ED medication reconciliation process and asked the patient about every medication on the report. To determine the degree of patient initial failed recall that was later restored by the electronic process, we asked the 2 pharmacists conducting ED medication reconciliation to record for patients with an electronic report (1) the number of recent electronic medications, (2) the number of such medications that were missing from the ED history, and (3) the number of the “missing” that the patient said they were receiving when asked about the specific medication during their medication reconciliation process. To facilitate the recordkeeping, we provided the pharmacists with a worksheet with 1 row per patient and a column for each of the 3 counts they were asked to record per patient. Those tallies included any prescribed over-the-counter medications that were reported on their electronic lists because pharmacists could not practically apply the automated rules we used to exclude over-the-counter medication lists during their busy ED workday. They collected these counts during a total of 4 shifts. At the time of this effort, pharmacists performed medication reconciliation only for admitted ED patients.
Primary Data Analysis
We specified exact Poisson confidence intervals (CIs) for quantities with count data, such as the mean of the number of drugs per patient (R package Poisson test),16 and for the binary demographic quantities (eg, age ≤65 years, sex, insurance coverage), we specified exact binomial intervals (R package binom.test).16 For the analysis of high-risk drugs, we calculated the test of difference in the proportion of drugs for recent electronic list versus the ED medication list, and ED medication list versus the full electronic list, using generalized linear mixed model to account for the clustering of multiple drugs per patients (R package lme4).16 A .05 threshold for the significance level was used for all hypothesis tests.
RESULTS
During the 3 months from February 28 to May 27, 2009, 9,966 unique patients visited the Suburban Hospital ED a mean of 1.20 times (95% CI 1.18 to 1.22). If a patient had more than 1 visit in this time frame, we included only his or her first visit in our analysis. Five hundred forty patients bypassed triage and were excluded from the main analysis (see below for a separate analysis of these patients) because they had no ED medication history in the hospital information system to compare with the electronic lists. This left 9,246 patients with triage records, whom we define as our study patients. Table 1 shows the characteristics of these study patients compared with the national ED means.17
Table 1.
Suburban Hospital ED patient characteristics compared with national ED figures.
| Patient Characteristic | % Suburban Hospital ED (95% CI), N=9,426 |
% National ED Survey |
|---|---|---|
| >65 y | 28 (27–29) | 15 |
| Enrolled in Medicare | 26 (25–27) | 17 |
| Ambulance arrival | 26 (25–27) | 16 |
| Medicaid or self-pay | 13 (12–13) | 40 |
| Race | ||
| White (including Hispanic) | 76 (75–77) | 73 |
| Black | 14 (13–15) | 24 |
| Asian/Pacific Islander | 5 (4.6–5.5) | 2 |
| Other | 5 (4.6–5.5) | 1 |
| First visit to the institution | 36 (35–37) | No data |
We matched 86.9% of the 5,899 unique item names in the raw ED history to 827 standardized drug names. These represented 96.6% of 32,630 item name instances in all of the raw ED histories. Of the 3.4% unmatchable ED history item names, equal proportions were drug indications (eg, “blood pressure medication”), class names (eg, “antibiotic”), non–drug-related information (eg, “patient can’t remember”), and unrecognizable names. Twenty-one percent of the identifiable raw ED names lacked dose form and strength information. We matched 97.9% of the 6,497 unique item names in the electronic prescription records to 907 standardized drug names, representing 99.3% of the 41,256 item name instances in all electronic prescription records. The few electronic names that we could not match with drug names were prescribed supplies, eg, insulin syringe. Unmatched items from both sources were excluded from our analysis.
It took a mean of 1 second (SD 4.5 seconds) to obtain an electronic report compared with 5.2 minutes (SD 3.2 minutes) to obtain an ED history, not counting the additional time required to obtain the pharmacist’s review and corrections.
A total of 6,431 patients (68% of the 9,246, study patients) reported receiving at least 1 unique medication and a mean of 4.9 (95% CI 4.8 to 5.0) unique medications (including over-the-counter drugs) in their raw ED medication list. The electronic source carried registration records for 6,085 (66%) patients (which implied they had active drug insurance), and 5,040 (53%) study patients had at least 1 unique medication and a mean of 8.1 (95% CI 8.0 to 8.2) unique medications within their raw full electronic list.
Over-the-counter medications represented 25% of those in the raw ED medication list. The 3 most common categories were vitamins/mineral supplements (42%); non-narcotic analgesics, eg, acetaminophen, ibuprofen (33%); and gastrointestinal drugs, eg, acid-reducing drugs, laxatives (18%). Over-the-counter medications represented 6% of drugs in the raw full electronic list. The 3 most common categories were the same as for ED medications but in different proportions: gastrointestinal drugs (34%), vitamins/mineral supplements (25%), and non-narcotic analgesics (18%).
Considering only prescription medications, 5,792 patients (61% of the study patients; Figure 2, red circle) had at least 1 and a mean of 4.1 (95% CI 4.0 to 4.2) such drugs in their ED medication list. Five thousand one patients (53%; Figure 2, yellow circle) had at least 1 and a mean of 7.7 (95% CI 7.6 to 7.8) prescription medications in their full electronic list; and 3,688 patients (39%; Figure 2, blue circle) had at least 1 and a mean of 4.0 (95% CI 3.9 to 4.1) such medications in their recent electronic list.
Figure 2.
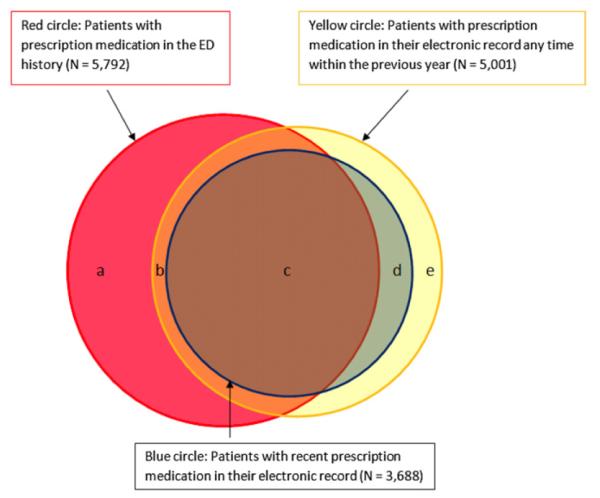
Overlap among patients with an ED history (red circle), a recent electronic history (blue circle), and a full-year electronic history (yellow circle) for prescription medications.
Of the study population, 6,151 patients (65%) (Figure 2) were receiving at least 1 prescription medication and had a mean of 4.7 (95% CI 4.6 to 4.8) such medications in their active medication list. The electronic source reported no recent prescription medication for 2,463 of these patients (40%;Figure 2, areas a+b), though these same patients had at least 1 and a mean of 3.6 (95% CI 3.5 to 3.7) such medications in their ED medication list. Of the 5,792 patients with any ED prescription medication history (Figure 2, red circle), 2,463 (42.5%) had no such medications in their recent electronic list and 2,477 (36%) had no records of prescription medication from any time frame in the electronic source.
If a patient had at least 1 recent electronic prescription medication (3,688 patients), they had a mean of 5.4 (95% CI 5.3 to 5.5) such medications in their active medication list, of which 4 (95% CI 3.9 to 4.1), or 75%, could be found in the recent electronic list, and the same number, 4 (95% CI 4.0 to 4.1), in the ED medication list. Each source contributed 1.4 active prescription medications about which the other was unaware.
The 2 Suburban Hospital pharmacists working in the ED kept detailed per-patient counts of the number of recent electronic medications, the number of these medications that were “missing” from the ED history, and the number of the missing that the patients confirmed they were receiving. They collected the data for 47 consecutively admitted patients during 4 8-hour shifts. Patients in this sample had a mean of 6.8 (SD 3.2) raw recent electronic medications (including over-the-counter medications), 2.72 (SD 1.6) of which were missing from the raw ED history. The patients reported they were receiving 2.4, or 85% (95% CI 79% to 92%), of these missing medications. We used a round number of 0.8 based on the lower bound of this CI to correct our estimates of the electronic record’s contribution to the active medication list downward. With this adjustment, the electronic source contributed 3.8 recent prescription medications to the active list, and the size of the active medication list decreased slightly to 5.1. However, even with this downward adjustment, the prescription medications in the recent electronic list covered almost the same percentage of the patient’s active medications as did the ED medications (73% versus 78%, respectively), and they augmented the active medication list by 1.1 drugs, an increase of 28% compared with what would have been provided by the ED history alone.
For patients with at least 1 recent electronic prescription medication, the full electronic list included a mean 0.7 (95% CI 0.7 to 0.7) prescription medications that were not recent (by our end-of-supply cutoff), but were reported as active within the ED history. These represented an additional increment of information from the electronic source about the patient’s active prescription medications. Adding these 0.7 nonrecent electronic medications to the adjusted 3.8 medications in the recent electronic list increased the electronic source’s coverage of the patient’s active medication to 4.5 drugs (88%) and provided a more complete history than the ED medication list (78%) alone. However, to get this boost in coverage one has to consider all 5.2 nonrecent prescription medications in the full-year electronic list to be potentially active. According to ED history, only 0.7 (13%) of these drugs would likely be active. If we considered all drugs up to an end of supply of 90 days to be potentially active, we would decrease the electronic sources coverage of the active medication list to 83%, but a greater percentage, 26%, of the drugs with end of supply in this interval would likely be active.
Of the 540 patients who bypassed the triage process, 280 patients (52%) were found in the electronic source and 212 (37%) had at least 1 and a mean of 7.9 prescription medications in their full electronic list.
Of the total number of study patients with any drugs on the active medication list (3,688 patients), 40% were receiving at least 1 and a mean of 1.7 high-risk drugs, and 15% of them were receiving an opioid. Table 2 lists the total number of unique prescription medications per high-risk class that appeared in the patient’s active medication list summed across all patients. If a patient was receiving 2 or more different drugs of a unique class, they each were counted in this tally. For each medication class, it also reports the number and percentage of the unique high-risk medications from the active medication list that were also present in the ED medication list, the recent list, and the full electronic list.
Table 2.
Percentage of active medication list drug for each high-risk medication class that the ED, recent, and full electronic lists contained.
| Drug Class | No. of Unique Drugs in Active Medication List |
No. (%) of Active Drugs in Recent Electronic Medication List |
Recent Electronic Versus ED Medication List, P Value* |
N (%) of Active Drugs in ED List |
ED Versus Full Electronic Medication List, P Value* |
No. (%) of Active Drugs in Full Electronic Medication List |
|---|---|---|---|---|---|---|
| Anticoagulants | 295 | 226 (76.6) | <.001 | 266 (90.2) | <.001 | 271 (91.9) |
| Anticonvulsants | 639 | 491 (76.8) | .002 | 541 (84.7) | <.001 | 573 (89.7) |
| Digitalis glycosides | 102 | 86 (84.3) | .07 | 95 (93.1) | .61 | 98 (96.1) |
| Insulin and exenatide | 185 | 128 (69.2) | .29 | 168 (90.8) | <.001 | 173 (93.5) |
| Lithium | 37 | 28 (75.7) | .18 | 33 (89.2) | .096 | 30 (81.1) |
| Opioids | 765 | 545 (71.2) | .001 | 473 (61.8) | <.001 | 670 (87.6) |
| Oral hypoglycemics | 547 | 443 (81.0) | .03 | 473 (86.5) | <.001 | 504 (92.1) |
| Theophylline | 16 | 9 (56.3) | 1 | 16 (100) | .66 | 14 (87.5) |
| Overall | 2,586 | 1,956 (75.6) | <.001 | 2,065 (79.9) | <.001 | 2,333 (90.2) |
To obtain the proportion of drugs for recent versus ED list and ED versus full list, we used generalized linear mixed model to account for the clustering of multiple drugs per patient in our test for significance of the difference.
The ED medication list was more complete with respect to the active medication list than the recent electronic list overall and for 3 of the classes with sample sizes greater than 100. In the case of opioids, it was less complete. Patients may be more reluctant to report their prescribed opioid medications than other medications. The full-year electronic list was more complete than the ED history overall and for the 5 high-risk classes with sample sizes above 100. The ability of the full-year electronic list to predict active medications that included drugs beyond our end-of-supply cutoff of 7 days emphasizes that this does not represent a strict cutoff between active and inactive medications.
The proportion of patients whose recent electronic list included a high-risk drug was about the same for bypass patients and study patients, 45% and 40%, respectively.
LIMITATIONS
The demographics and sources of payment for our study may not be generalizable to all EDs.
Because of the retrospective and deidentified nature of our study design, we could not interview patients or conduct chart reviews to verify the medication history or what the physicians might have had available as handwritten medication histories.
Our active medication list is an imperfect standard compared with other compliance assessment methods such as medicine cabinet inspection and computerized pill bottle caps.
Finally, our results are based on a single proprietary electronic source of prescription records.
DISCUSSION
Our results extend the conclusions of previous studies to the emergency care setting and include a full spectrum of patients and a large population.6
During the trial period, we had no way to ascertain whether the patients were actually receiving the drugs reported in the recent electronic history but not in the ED history. However, our data collected after the trial period about patients’ failed recall are congruent with the results of Lau et al,5 who noted during direct interview that patients were receiving 80% of the 1.7 medications present in their pharmacy dispensing records but missing from their initial manual history. Our results are also consistent with those of previous studies18-22 that revealed gaps in the manual medication history that were filled by pharmacy-derived prescription records. Finally, it seems unreasonable to assume the alternative, ie, that patients would not be receiving a major share of the prescription medications they had invested effort (travel time, waiting time) and money to obtain.
The electronic pharmacy-derived medication history has many advantages beyond its bolstering of the manual history. It delivers unambiguous medication names that the manual ED history failed to do for 3% of its unique drug name instances, and it consistently includes the dose form and strength, required items for medication reconciliation.3 The electronic record arrives in seconds rather than the minutes to hours—if one counts time to completion of pharmacist review—required for the manual ED history, and it requires no time of busy ED personnel to produce. Finally, the availability of these electronic histories is not affected by patient consciousness or ED workload, which would be especially beneficial during disasters. We had the impression from reading many deidentified timeline reports that they could cue to compliance problems and drug-seeking behavior (multiple narcotic drugs from many providers). We did not collect data that would confirm the first impression, but the electronic lists did include more opioid medication than the ED history.
Electronic prescription records could speed, simplify, and improve the medication history and its reconciliation. If the ED staff could receive complete electronic reports of all prescriptions filled by pharmacies, they would not have to call pharmacies to fill in medication history gaps. Instead of asking the patient to recite a list of medications from memory, the nurse or pharmacist could read through the medications in the electronic record and ask “are you taking this drug” and, at the end, “are you taking anything else?” as Suburban Hospital pharmacists now do with the medication report (Figure 1) in hand.
The gathering of over-the-counter medications could be covered by the “anything else” question. Over-the-counter medications represented 25% of the ED history, and nearly half of them were vitamins and minerals. However, fewer than 5% of serious adverse drug reactions are due to over-the-counter medications,15,23,24 and the over-the-counter culprits in these cases are almost always acetaminophen and nonsteroidals (including aspirin). At present, there are no options for obtaining records of purchased over-the-counter medications not covered by insurance because those records are not collected by pharmacy systems or pharmacy benefit managers.
When the electronic record does provide any medications for a patient, its report is a good starting point for the medication history and, according to the ED pharmacists, an almost perfect reference medication list for medication reconciliation. However, the electronic source in our study reported no recent prescription medications for 43% of patients and no prescription medication records for any period for 36% of patients who listed prescription medications in their ED history. These are important shortfalls, which would likely be larger in the average ED whose case mix includes fewer patients with private insurance and Medicare and more self-paying and Medicaid patients,17 for many of whom there would not be electronic prescription records.
Though Surescripts estimates that the prescription coverage of their consortium has increased to 80% to 85% of prescriptions, up from 65% at the beginning of our study, the percentage of all Suburban Hospital ED patients with any electronic records increased only 4 percentage points (from 53% to 57%) from the start of our study to 2012. These shortfalls can be explained in part by the fact that the TriCare military health plan, the Veterans Administration and Department of Defense health care centers, some Medicaid and Capitated Medicaid programs and nongovernmental sources such as the Kaiser Permanente health plans, and prescriptions paid for entirely by patients25 are not routinely delivered to pharmacy benefit managers and are not available to the electronic system we studied.
An interface engine such as the Mirth exchange engine we used (available as open source) could integrate prescription dispensing information sent from many sources into one unified medication history as long as senders used a common standard for requesting and delivering their prescription records. So we can still imagine the day when no ED patients would “have to tell every new [emergency physician] … what prescriptions they’re taking.”26
Editor’s Capsule Summary.
What is already known on this topic
Patient medication lists created in the emergency department (ED) may be incomplete.
What question this study addressed
Does a query of a single, proprietary, national, electronic pharmacy prescription database identify additional medications for the medication list during the ED care interval?
What this study adds to our knowledge
In 1 ED during 3 months, 39% of ED patients had at least 1 current prescription medication identified, with a mean 1.1 medications added in affected patients. The query required seconds to complete.
How this is relevant to clinical practice
Electronic tools that work contemporaneously can help better identify current medications and could affect care.
Acknowledgments
The authors acknowledge the many people from Suburban Hospital who made this project possible: Eugene Passamani, MD, Christopher Timbers, Robert Rothstein, MD, Patricia Jarvis, Pamela Sagan, Spiros Nicols, Pharm D, and Eyerusalem Yemame, Pharm D; Selcuk Ozturk, our contractor programmer; Ann Belsito of the Regenstrief Institute; and Ken Majkowski of Surescripts.
Funding and support: The authors have stated that no such relationships exist. This work was funded in part by the National Naval Medical Center in support of the Bethesda Hospitals’ Emergency Preparedness Partnership and was supported by the Intramural Research Program of the National Institutes of Health, National Library of Medicine.
Footnotes
By Annals policy, all authors are required to disclose any and all commercial, financial, and other relationships in any way related to the subject of this article as per ICMJE conflict of interest guidelines (see www.icmje.org).
Author contributions: KWF and CJM conceived and designed the study, obtained research funding, performed the data analysis, and drafted the article. MK designed the software for collection and deidentification of the data. KWF, MK, and CJM supervised the conduct of the study and data collection. FC provided statistical advice on the study design and data analysis. All authors contributed substantially to article revision. KWF takes responsibility for the paper as a whole.
REFERENCES
- 1.Overhage JM, Dexter PR, Perkins SM, et al. A randomized, controlled trial of clinical information shared from another institution. Ann Emerg Med. 2002;39:14–23. doi: 10.1067/mem.2002.120794. [DOI] [PubMed] [Google Scholar]
- 2.Joint Commission [Accessed January 2, 2013];Revised NPSG on medication reconciliation is approved. Follow-up survey on Universal Protocol reveals widespread support Dec 8, 2010. Available at: http://www.jointcommission.org.
- 3.Centers for Medicare & Medicaid Services [Accessed January 2, 2013];Electronic health record incentive program—stage 2. Available at: http://www.cms.gov/regulations-and-guidance/legislation/ehrincentiveprograms/stage_2.html.
- 4.Mersfelder TL, Bickel RJ. Inpatient medication history verification by pharmacy students. Am J Health Syst Pharm. 2008;65:2273–2275. doi: 10.2146/ajhp080013. [DOI] [PubMed] [Google Scholar]
- 5.Lau HS, Florax C, Porsius AJ, et al. The completeness of medication histories in hospital medical records of patients admitted to general internal medicine wards. Br J Clin Pharmacol. 2000;49:597–603. doi: 10.1046/j.1365-2125.2000.00204.x. [DOI] [PMC free article] [PubMed] [Google Scholar]
- 6.Tam VC, Knowles SR, Cornish PL, et al. Frequency, type and clinical importance of medication history errors at admission to hospital: a systematic review. CMAJ. 2005;173:510–515. doi: 10.1503/cmaj.045311. [DOI] [PMC free article] [PubMed] [Google Scholar]
- 7.Department of Veterans Affairs VHA Decision Support System (DSS) [Accessed February 28, 2013];Clinical NDEs—VA Information Resource Center (VIReC)–US Department of Veterans Affairs. Available at: http://www.virec.research.va.gov/DSS-NDEs/Clinical-NDEs.htm.
- 8.Markle Foundation . Lessons from Katrina Health. Markle Foundation; New York: [Accessed January 2, 2013]. Jun 13, 2006. Available at: http://www.surescripts.com/media/660511/katrinahealthlessons.pdf. [Google Scholar]
- 9. [Accessed January 2, 2013];Health Level Seven. Available at: http://www.hl7.org/implement/standards/v2messages.cfm.
- 10.Frisse ME, Tang L, Belsito A, et al. Development and use of a medication history service associated with a health information exchange: architecture and preliminary findings. AMIA Annu Symp Proc. 2010;2010:242–245. [PMC free article] [PubMed] [Google Scholar]
- 11.The Mirth Project [Accessed January 2, 2013]; Available at: http://www.mirthcorp.com/
- 12.US Department of Health and Human Services. Office for Civil Rights [Accessed January 2, 2013];HIPAA Privacy Rule. Available at: http://www.hhs.gov/ocr/privacy/hipaa/administrative/privacyrule/index.html.
- 13.RxNorm, US National Library of Medicine [Accessed January 2, 2013];RxNorm overview. Available at: http://www.nlm.nih.gov/research/umls/rxnorm/overview.html.
- 14.US Department of Health and Human Services. Food and Drug Administration [Accessed January 2, 2013];Drug approvals and databases—glossary of terms. Available at: http://www.fda.gov/Drugs/informationondrugs/ucm079436.htm.
- 15.Budnitz DS, Pollock DA, Weidenbach KN, et al. National surveillance of emergency department visits for outpatient adverse drug events. JAMA. 2006;296:1858–1866. doi: 10.1001/jama.296.15.1858. [DOI] [PubMed] [Google Scholar]
- 16. [Accessed January 2, 2013];The R statistical package, R R-2.11.1 for Windows. Available at: http://cran.r-project.org/bin/windows/base/old/2.11.1/
- 17.Niska R, Bhuiya F, Xu J. National Hospital Ambulatory Medical Care Survey: 2007 emergency department summary. Natl Health Stat Rep. 2010;26:1–31. [PubMed] [Google Scholar]
- 18.Chung MK, Bartfield JM. Knowledge of prescription medications among elderly emergency department patients. Ann Emerg Med. 2002;39:605–608. doi: 10.1067/mem.2002.122853. [DOI] [PubMed] [Google Scholar]
- 19.Gleason KM, Groszek JM, Sullivan C, et al. Reconciliation of discrepancies in medication histories and admission orders of newly hospitalized patients. Am J Health Syst Pharm. 2004;61:1689–1695. doi: 10.1093/ajhp/61.16.1689. [DOI] [PubMed] [Google Scholar]
- 20.Jaye C, Hope J, Martin IR. What do general practice patients know about their prescription medications? N Z Med J. 2002;115(1162):U183. [PubMed] [Google Scholar]
- 21.Beers MH, Munekata M, Storrie M. The accuracy of medication histories in the hospital medical records of elderly persons. J Am Geriatr Soc. 1990;38:1183–1187. doi: 10.1111/j.1532-5415.1990.tb01496.x. [DOI] [PubMed] [Google Scholar]
- 22.Cornish PL, Knowles SR, Marchesano R, et al. Unintended medication discrepancies at the time of hospital admission. Arch Intern Med. 2005;165:424–429. doi: 10.1001/archinte.165.4.424. [DOI] [PubMed] [Google Scholar]
- 23.Sikdar KC, Alaghehbandan R, MacDonald D, et al. Adverse drug events in adult patients leading to emergency department visits. Ann Pharmacother. 2010;44:641–649. doi: 10.1345/aph.1M416. [DOI] [PubMed] [Google Scholar]
- 24.Elixhauser A, Owens P. Adverse Drug Events in U.S. Hospitals, 2004: Statistical Brief #29. Healthcare Cost and Utilization Project (HCUP) Statistical Briefs. Agency for Healthcare Research and Quality; Rockville, MD: 2006. [Google Scholar]
- 25.Choudhry NK, Shrank WH. Four-dollar generics—increased accessibility, impaired quality assurance. N Engl J Med. 2010;363:1885–1887. doi: 10.1056/NEJMp1006189. [DOI] [PubMed] [Google Scholar]
- 26. [Accessed January 2, 2013];President Barack Obama’s speech to the American Medical Association as reported by CBS News. Available at: http://www.cbsnews.com/stories/2009/06/15/politics/main5090277.shtml.