

Abstract
Subcortical white matter stroke is a common stroke subtype but has had limited pre-clinical modeling. Recapitulating this disease process in mice has been impeded by the relative inaccessibility of the sub-cortical white matter arterial supply to induce white matter ischemia in isolation. In this report, we detail a subcortical white matter stroke model developed in the mouse and its characterization with a comprehensive set of MRI, immunohistochemical, neuronal tract tracing and electron microscopic studies. Focal injection of the vasoconstrictor endothelin-1 into the subcortical white matter produces an infarct core that develops a maximal MRI signal by day 2, which is comparable in relative size and location to human subcortical stroke. Immunohistochemical studies indicate that oligodendrocyte apoptosis is maximal at day 1 and apoptotic cells extend away from the stroke core into the peri-infarct white matter. The amount of myelin loss exceeds axonal fiber loss in this peri-infarct region. Activation of microglia/macrophages takes place at 1 day after injection near injured axons. Neuronal tract tracing demonstrates that subcortical white matter stroke disconnects a large region of bilateral sensorimotor cortex. There is a robust glial response after stroke by BrdU pulse-labeling, and oligodendrocyte precursor cells are initiated to proliferate and differentiate within the first week of injury. These results demonstrate the utility of the endothelin-1 mediated subcortical stroke in the mouse to study post-stroke repair mechanisms, as the infarct core extends through the partially damaged peri-infarct white matter and induces an early glial progenitor response.
Keywords: Oligodendrocyte, Precursor, Myelin, NG2, Biotinylated dextran amine, Peri-infarct, Ischemia, Frontal lobe
1. Introduction
Subcortical white matter stroke constitutes 15–25% of all stroke subtypes (Bamford et al., 1991) and results in white matter lesions. These lesions encompass small infarcts in deep penetrating vessels in brain, as well as ischemic lesions in end-arterial regions of subcortical white matter (Matsusue et al., 2006; Gouw et al., 2008; Wardlaw, 2008). The infarctions in subcortical white matter are closely related to true microvascular stroke and are represented on MRI imaging as lacunar infarctions with a small stroke cavity as well as ischemic white matter hyperintensities (Gouw et al., 2008). Despite an advanced pre-clinical literature of animal modeling in large artery, “gray matter” stroke, there are few animal models of white matter ischemia. A principle problem in modeling white matter stroke in the rodent brain is that it has substantially less white matter than in higher mammals and humans.
A lack of an appropriate model for subcortical stroke presents a critical gap in stroke basic science research, as the mechanisms of cell death and of repair are likely to differ in white matter stroke from large artery gray matter strokes. For instance, oligodendrocytes undergo a different time course of cell death than neurons in large artery stroke models (Pantoni et al., 1996). Also, white matter astrocytes display a differential sensitivity to ischemic injury than those derived from gray matter (Shannon et al., 2007). In addition to this biology of cell death, the biology of the glial progenitor response is also different in cortical versus subcortical regions, and this may contribute to differing degrees of repair. Oligodendrocyte progenitor cells (OPCs) are widely scattered throughout cortical and subcortical regions in the adult brain. Using genetic labeling, it has recently been shown that OPCs in the subcortical white matter of the adult turnover at a higher rate compared to cortical OPCs (Dimou et al., 2008); and that cortical OPCs are fewer in number and experience a block at the progenitor or pre-oligodendrocyte stage (Dimou et al., 2008). Futhermore, this limited progenitor response of cortical OPCs persists after brain injury with few cortical OPCs producing mature oligodendrocytes (Dimou et al., 2008). Because of these apparently different mechanisms of cell death and of repair in cortical vs. white matter ischemia, specific animal models of subcortical white matter stroke are urgently needed. A white matter stroke model developed in the mouse would provide the added advantage that mouse genetic tools can be applied to the labeling and molecular analysis of the cells involved in white matter stroke and repair.
In this report we describe a subcortical stroke model developed in the mouse by using the vasoconstrictor peptide endothelin-1 (ET-1). ET-1 is not directly neurotoxic (Nikolov et al., 1993) and produces local vasoconstriction and loss of blood flow for up to three hours at the injection site (Fuxe et al., 1992; Hughes et al., 2003). The regulation of regional blood flow by ET-1 has been used to produce several different large artery, focal cortical or striatal infarcts. Focal injection of ET-1 into the posterior limb of the internal capsule in the rat produces a small infarction resembling a lacune (Frost et al., 2006; Lecrux et al., 2008). In the present study, ET-1 was microinjected into the subcortical white matter of the frontal lobe of the mouse, and the patterns of cell death, inflammation, gliosis, axon and myelinated fiber loss and glial progenitor responses were determined using immunohistochemical, tract tracing and electron microscopic techniques. This model produces a focal necrotic cavity in subcortical white matter and an adjacent area of axonal damage, myelin loss and oligodendrocyte gliogenesis.
2. Material and methods
2.1. Animals
All experiments were performed in accordance with National Institutes of Health animal protection guidelines and were approved by the University of California at Los Angeles Animal Research Committee. Two-month old male C57/BL6 mice (Charles-River, Shrewesbury, MA, 22–25 g) were used in this study. For axonal fiber labeling adult male YFP-H mice were used (Jackson Laboratories, Bar Harbor, ME, stock number 003782). This line expresses the fluorescent protein YFP in a soluble form that fills the entire cellular architecture of a subset of layer V and some layer II/III pyramidal neurons (Feng et al., 2000). Cohorts of animals (n = 5–7 per group) survived to 1, 3, 7, 14 and 28 days after stroke. Two cohorts of YFP-H mice (n = 5) survived to 7 and 28 days. For both wild type C57BL/6 and YFP-H mice, a cohort of unoperated control animals was processed in parallel (n = 5–7).
2.2. Surgical procedure and tissue processing
Mice were anesthetized with 2% isoflurane in 2:1 N2O:O2, and placed in a stereotaxic apparatus. Temperature was maintained at 36.5–37.5 °C using a rectal probe and heating pad. Pulled glass micropipettes (tip diameter 15–25 μm) were filled with ET-1 (Bachem, Torrance, CA; 1 μg/μL in sterile physiological saline), attached to pressure pump (Picospritzer II, General Valve, Fairfield, NJ) and mounted in a stereotaxic arm. A craniotomy was performed over the sensorimotor cortex overlying the injection sites, and the pipette containing the ET-1 was inserted through the cortex into the underlying white matter at an angle of 36° in order to minimize cortical damage. Three injections (each of 120 nL ET-1 solution) were made, targeting subcortical white matter below forelimb motor cortex (Paxinos and Franklin, 2001): AP + 0.52, ML + 0.15, DV 2.3; AP + 0.88, ML + 0.15, DV − 2.3; AP + 1.24, ML + 0.15, DV − 2.3. The pipette was left in situ for 5 min post-injection to allow proper diffusion. After the post-surgery survival period, each mouse was given a lethal dose of sodium pentobarbital and perfused transcardially with 0.1 M phosphate buffered saline followed by 4% paraformaldehyde. The brains were removed, postfixed overnight in 4% paraformaldehyde and cryoprotected for 2 days in 30% sucrose. Subsequently brains were removed and frozen. Coronal tissue sections of 50 μm were prepared using a cryostat (Leica CM 0530). Adjacent series were cut and processed for immunohisto-chemistry, Nissl staining or cell death studies.
2.3. BDA retrograde labeling
A separate cohort of mice (n = 5) was given 25 mg of the neuroanatomical tracer biotinylated dextran amine (BDA, 10,000MW, Invitrogen, Carlsbad, CA) dissolved in 250 μL of saline along with ET-1 (1:1). BDA is taken up directly into neuronal cell bodies, but is only taken up by damaged axons (Veenman et al., 1992). Mice were sacrificed 7 days after stroke with paraformaldehyde fixation as above. The number of retrogradely labeled neurons from the BDA was determined in six-50 μm coronal sections spaced 175 μm apart through the stroke site.
2.4. BrdU pulse-chase
In a separate cohort, mice received bidaily intraperitoneal injections of BrdU (Sigma, 50 mg/body weight in sterile saline) for one week after ET-1 injection and were sacrificed at days 7 and 28 (early and late time points respectively, n = 3 for each time point). No-stroke control animals received the same BrdU pulse and euthanized at the same time points. The number and phenotype of BrdU incorporated cells were determined by stereology and immunohistochemistry.
2.5. MRI
Mice were anesthetized and placed in a Bruker 7T small animal MRI (Bruker Biospin, Switzerland). MRI imaging was performed on days 1, 2 and 8 after stroke. Respiratory rate was monitored throughout the procedure and body temperature was maintained at 37 ± 0.5 °C. A T2-weighted image set was acquired: rapid acquisition relaxation enhancement factor 8, repetition time 5357 ms, echo time 15.50 ms with an in-plane resolution of 0.086_0.172_0.35 mm with 39 contiguous slices.
2.6. Immunohistochemistry
Single and double label fluorescent immunohistochemistry was performed on free-floating sections (Ohab et al., 2006; Carmichael et al., 2008). Briefly, sections were rinsed in phosphate buffered saline (PBS), blocked in 5% donkey serum, incubated in primary antibodies for 1–4 days at 4 °C, rinsed in PBS, incubated in secondary antibodies for one hour at room temperature, rinsed in PBS, mounted on slides and air-dried, and taken through ascending alcohols and xylene and coverslipped. For BrdU/NG2 and BrdU/transferrin double labeling, the sections were incubated in NG2 or transferrin primary antibody followed by 30 min 2N HCl incubation at 37 °C and 30 min neutralization in 0.1 M sodium borate buffer at room temperature. The sections were blocked again and incubated in anti-BrdU primary antibody followed by secondary antibody incubation. All secondary antibodies were donkey F(ab)2 fragments conjugated to cy2 or cy3 (Jackson Immunoresearch, West Grove, PA) and were used at a dilution of 1:200. Primary antibodies were: rat anti-myelin basic protein (1:800, Carlsbad, CA), rabbit anti-myelin basic protein (MBP)(1:200, Abcam, Cambridge, MA), mouse anti-NeuN (1:500, Abcam), rat anti-GFAP (1:1000, Invitrogen), sheep anti-carbonic anhydrase II (1:600, Morphosys, Germany), sheep and rat anti-BrdU (1:500, Abcam), rabbit anti-transferrin (1:75, Abcam), mouse anti-apoptosis inducing factor (1:200, AIF, Santa Cruz Biotechnology, Santa Cruz, CA), mouse anti-activated Poly(ADP-ribose)polymerase 1 (PARP, 1:100, Cell Signaling, Danvers, MA), rabbit anti-NF200 (1:2000, Sigma, St. Louis, MO), mouse anti-SMI31 and anti-SMI-32 (1:1000, Abcam), rabbit anti-NG2 (1:200, Invitrogen); goat anti-transferrin (1:100, MP Biomedicals, Solon, OH), rabbit anti-IBA1 (1:1000, Wako Chemicals, Richmond, VA) and NeuN (1:500). Control sections were run in parallel with each experiment in which the primary antibody or antiserum were omitted. For glial scar assessment, levels of astrocyte-secreted extracellular matrix polysaccharide hyaluronic acid (HA) were compared between stroke and non-stroke samples (Back et al., 2005). Hyaluronan was visualized with biotinylated hyaluronan binding protein (HABP) (1:50, Associates of Cape Cod, East Falmouth, MA) and then streptavidin-Cy3 (1:100 Jackson Immunoresearch).
2.7. Stereology and statistics
Brdu/NG2 and BrdU/transferrin double labeled cells were stereologically quantified (Ohab et al., 2006) using the optical fractionator probe on a system with a digitizing x/y/z motorized stage, Leica DMLB microscope (Leica Microsystems, Wetzlar, Germany) and neuroanatomical quantification software (Stereoinvestigator, MBF Bioscience, Williston, VT). A counting area was drawn to include all of the subcortical white matter from a point above the lateral most part of the lateral ventricle to the point at which the subcortical white matter sweeps around the lateral one-half of the striatum. For BrdU counts, 5 serial sections spaced 250 μm apart were counted through the lesion. All tissue sections were initially analyzed with observer blinded to the experimental condition. Means ± standard deviations for BrdU/NG2 and BrdU/transferrin in 7 vs. 28 days were compared with two-sample t test assuming equal variances (Excel, Microsoft, Redmond, WA). For quantification of retrogradely labeled neurons in the BDA:ET-1 co-injection brains, 6 serial sections spaced 175 μm apart were used through the stroke site. Similarly, the total number of neurons (NeuN stain) in the same cortical areas was determined in 3 animals and averaged to estimate the ratio of disconnected tracts.
2.8. Cell death detection
Apoptotic cell death was detected with immunohistochemical stains for apoptosis inducing factor (AIF) and caspase-cleaved (activated) PARP, which are indicators of intracellular caspase activity (Mehta et al., 2007). Additionally, double stranded DNA nicked cells, characteristic of apoptosis (van Dierendonck, 2002), were identified with in situ nick translation (EMD Biosciences, Gibbstown, NJ), and modified for free-floating sections with a reduction in proteinase K (0.12 μg/mL). Stained cells were counted in 11 tissue sections through the stroke site using the same counting area with the same microscope system as for immunohistochemical staining.
2.9. Confocal microscopy
100× confocal images were acquired using a Leica DM-IRBE (TCS-SP). For all images, z-sections and z-steps ranged between 0.5 and 1 μm. Images were subsequently processed using Leica Lite software or Adobe Photoshop/Illustrator (Adobe Systems).
2.10. Electron microscopy
Mice were perfused at 1–7 days after stroke (n = 2 each time point) with buffered 4% paraformaldehyde and 1% glutaraldehyde solution. Brains were post-fixed in the perfusion fixative overnight. Cerebral hemispheres were sectioned into 1 mm thick tissue blocks in the frontal plane and processed for electron microscopy. In short, sections were osmicated in a 1% osmium tetroxide solution, dehydrated in ethanol, and plastic-embedded in Epon. Semithin sections were cut, stained with toluidine blue, and examined in the light microscope. Sections demonstrating subcortical areas affected by ischemia were trimmed, and serial ultramicrotome sections (60–70 nm) were collected on formvar-coated one-hole copper grids. The ultrathin sections were next counterstained using uranyl acetate and lead citrate, and examined in a JOEL 100 CX transmission electron microscope.
3. Results
3.1. Overview of small ischemic stroke in frontal subcortical white matter
Subcortical white matter strokes are located in characteristic regions of the frontal and parietal lobes in humans. These lesions produce hyperintensities and/or focal cavities on MRI (Fig. 1A), myelin pallor and cell loss. Fig. 1A illustrates a recent subcortical white matter stroke in a patient, which occurs within a region of previous strokes. To model this disease process in mice, focal microinjections of the vasoconstrictor ET-1 was placed into sub-cortical white matter below the frontal cortex. The injection needle was angled so as to not directly manipulate or pass through the cortex above the stroke site. Three injections of 120 nL ET-1 at 1 μg/μL were made, spaced 300–400 μm apart in the A/P plane so as to extend the stroke core within the subcortical white matter in the mouse. The specific volume and concentration of ET-1 to be used were determined through preliminary studies. ET-1 solution is saturated at 1μg/μL in saline. Of note, larger volumes resulted in difficulty in arousal from the effects of anesthesia and subsequent death of the animal. On the other hand, more dilute ET-1 solutions or smaller volumes did not produce a significant infarct. Following ET-1 injection, MR imaging in the mouse shows a hyperintensity in subcortical white matter and a small region of dorsolateral striatum, similar in location to common sites of human subcortical stroke (Fig. 1B). In this stroke model, the MRI signal is maximal at day 2 and diminished by day 8 after ET-1 injection.
Fig. 1.

Human and mouse subcortical white matter stroke. (A) Human FLAIR sequence MRI taken 2 days after left hemispheric subcortical stroke. Arrow denotes white matter hyperintensity that was new in comparison to previous scans from this patient. Case is taken from clinical service of the authors (STC). (B) Mouse MRI taken 2 days after ET-1 injection. Arrow denotes hyperintensity caused by stroke. (C) Nissl staining of subcortical white matter 7 days after stroke. Note small cavity in white matter and adjacent increase in cellularity. (D) White matter stroke in YFP-H mouse line. Left panel is contralateral and white matter is ipsilateral to the stroke 7 days after ET-1 injection. Arrow denotes infarct core, with loss of axons. Note bright axon retraction bulbs in fibers adjacent to the lesion. Bar in (C) = 350 μm. Bar in (D) = 60 μm.
Nissl stains at 7 days after the injection indicate that the focus of damage is in the subcortical white matter (Fig. 1C). A small cavity is present that is surrounded by a glial reaction. There is some neuronal loss and increase in glial density in the deep cortical layers directly above the lesion and in the very superficial aspect of the dorsolateral striatum below the white matter lesion (Fig. 1C). Notably, vehicle-only injection controls did not show any damage in the white matter, ruling out the possible mechanical damage that microinjections can produce. For that reason, the vehicle-only control brains are interchanged with mouse brains with no injection (unoperated non-stroked controls) for these studies.
In order to visualize the axonal fibers directly within the stroke region and assess the injury, ET-1 was injected into the YFP-H mouse line. The contralateral hemisphere to the injection site displays the same axonal anatomy as control non-injected mice: the subcortical white matter is filled with dense fascicles of axons, some coursing through the subcortical white matter and down through the striatum to subcortical targets (Fig. 1D, left). 7 days after subcortical white matter stroke, axons are clearly lost within the stroke cavity. Fewer axons penetrate through the striatum toward subcortical targets. Axonal retraction bulbs, visible as bright globular accumulations of YFP in dystrophic fiber endings, are present on medial and lateral sides of the stroke center (Fig. 1D, right). These cellular and fiber responses to this stroke are explored in greater detail in each subsequent section.
3.2. Cell death
Cell death after focal injection of ET-1 into subcortical white matter was tracked with immunohistochemical stains for nuclear AIF, activated PARP and in situ nick translation. Nuclear AIF and PARP immunoreactive cells are present as small cells, arranged in large clumps in the center of the lesion site. In white matter adjacent to the lesion site, AIF and PARP positive cells are present in linear rows that extend several hundred microns distant to the lesion site, resembling interfascicular oligodendrocytes (Fig. 2B and D). AIF and PARP immunoreactive cells are maximal in number at day 1 after stroke. Only occasional AIF nuclear immunoreactivity and PARP immunoreactive cells are present at day 3 and none are observed after this time point. AIF and PARP immunoreactivity co-localizes with cell phenotype markers for oligodendrocytes, including carbonic anhydrase II (Fig. 2C, Supplementary Fig. 1) and transferrin. There is a reduced number of CAII and transferrin immunoreactive cells in subcortical white matter and deep cortical layers apparent at days 7 and 14 after ET-1 injection (Fig. 2E). A small number of GFAP immunoreactive astrocytes co-localize with activated PARP or AIF at the lesion site. To quantify apoptotic cells during their maximal occurrence, the number of stained cells in in situ nick translation (Fig. 2D) was counted through the lesion site in subcortical white matter 1 day after ET-1 injection: 195 cells ± 76 (n = 5). There are no positive cells in the control white matter.
Fig. 2.
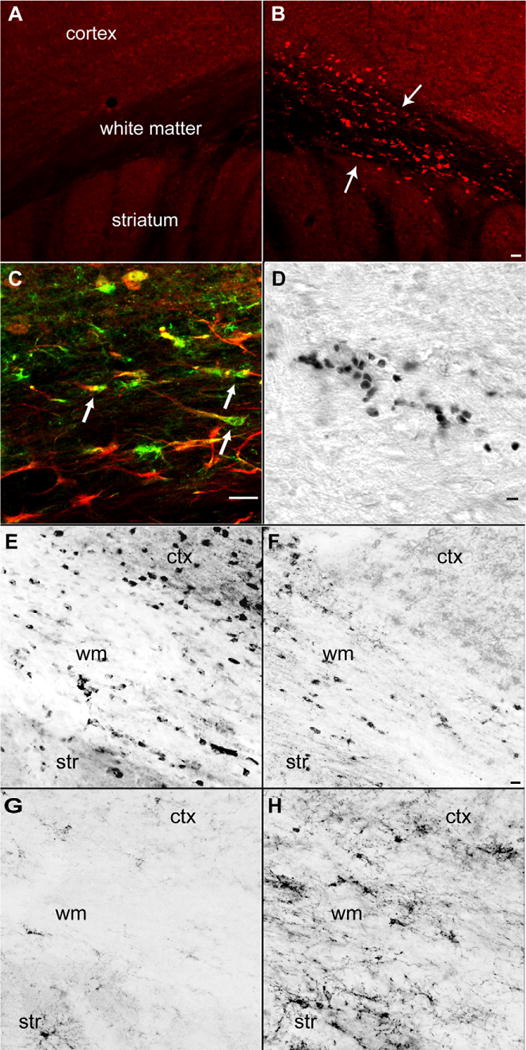
Cell death in white matter one day after stroke. (A) Immunohistochemical staining for AIF in contralateral hemisphere. (B) AIF stain in the hemisphere ipsilateral to stroke. Note positive cells in white matter and deepest cortical layers, and linear rows of AIF immunoreactive cells (arrows). (C) CAII stain for oligodendrocytes (green) activated PARP immunoreactivity (red). Note multiple CAII and activated PARP double positive cells in subcortical white matter (D) In situ nick translation showing double stranded DNA nicking in apoptotic cells in subcortical white matter. (E) Transferrin immunoreactive oligodendrocytes in control subcortical white matter region. (F) Transferrin immunoreactive oligodendrocytes 7 days after subcortical white matter stroke. (G) NG2 immunoreactive OPCs in control subcortical white matter region. (H) NG2 immunoreactive OPCs 14 days after subcortical white matter stroke. ctx = cortex, str = striatum, wm = subcortical white matter. Bar in (B) = 50 μm and applies to (A and B); bar in (Cand D) = 40 μm, Bar in (F) = 20 μm and applies to (E–H) (for interpretation of the references to color in this figure legend, the reader is referred to the web version of the article).
3.3. Inflammation, reactive gliosis
Immunohistochemical staining for GFAP and IBA-1 was used to localize astrocyte and microglial/macrophage immunoreactive cells to ET-1 injections. In control brains, GFAP immunoreactive cells are present in the medial subcortical white matter, within the corpus callosum and that portion of the subcortical white matter dorsal to the subventricular zone (Fig. 3A). There is no change in this distribution or staining intensity of GFAP at day 1 after injection. Beginning at day 3 and reaching a maximal intensity at day 7, densely stained GFAP positive cells fill the subcortical white matter, deep cortical layers and superficial dorsolateral striatum (Fig. 3B). The GFAP positive fibers tend to run parallel to white matter fiber tracts. At 14 and 28 day time points the intensity of immunoreactivity for GFAP declines slightly but the distribution of GFAP positive cells remains the same. Tissue incubation with hyaluronic acid binding protein (HABP) localizes HA in the brain, and is maximal around the stroke cavity and closely associated with GFAP positive cells at day 7 after ET-1 injection (Fig. 3D). There is also an increase in HA labeling in the contralateral subcortical white matter. In control brains, there is low IBA-1 immunoreactivity. Faintly IBA-1 positive cells are localized predominantly in the cortex and striatum but are sparse in white matter of non-stroke control brains (Supplementary Fig. 2A). Unlike astrocyte activation, microglia activation takes place without a delay beginning on day 1 after stroke. Strongly IBA-1 positive microglia, displaying the characteristic ramified appearance of the activated state, fill the subcortical white matter ipsilateral to stroke (Supplementary Figs. 2B and 3F). IBA-1 immunoreactive cells increase up to day 7 after injection, and are associated with SMI-32 immunoreactive injured axons (Fig. 3F, see below). Interestingly, some activated microglia are found in contralateral hemisphere as well (Fig. 3E).
Fig. 3.

Glial and inflammatory responses to white matter stroke. (A) GFAP immunoreactivity in subcortical white matter on control brains. (B) GFAP immunoreactivity in subcortical white matter 7 days after stroke. Hyaluronic acid labeling with HABP in subcortical white matter (C) in control brain and (D) in peri-infarct area 7 days after stroke. (E) SMI-32 immunoreactive axons (red) and IBA-1 immunoreactive microglia/macrophages (green) in contralateral subcortical white matter. (F) SMI-32 positive fibers (red) and IBA-1 positive microglia/macrophages (green) 7 days after stroke. Inset shows a high power view of IBA-1 positive activated microglia. Bar in (B) = 40 μm and applies to (A and B); Bar in (D) = 40 μm and applies to (C and D); Bar in (F) = 40 μm and applies to (E and F) (for interpretation of the references to color in this figure legend, the reader is referred to the web version of the article).
3.4. Axonal fiber and myelin loss
Immunohistochemical staining for neurofilament proteins and myelin basic protein identifies patterns of axonal and myelin damage over the first month after ET-1 injection. 1 day after ET-1 injection there is a small stroke core in the center of the injection site with loss of immunoreactivity for phosphorylated heavy chain neurofilament proteins, NF200 and SMI-31. This pattern of neurofilament staining remains unchanged until 14 days after the injection, after which there is a progressive decrease in NF200 and SMI-31 staining around the stroke site in the subcortical white matter (Fig. 4D and F). MBP is also lost in a small initial area in the center of the stroke at 1 day, and later develops into a larger region of diminished MBP staining from day 14 to day 28 (Fig. 4B and F). However, the region of diminished MBP staining is larger than the region of axonal neurofilament loss: the peripheral or peri-infarct zone around the stroke cavity contains areas in which NF200 and SMI-31 staining is present, but MBP is diminished (Fig. 4F and H). This mismatch of axonal and myelin staining patterns is not seen in control white matter or white matter contralateral to the stroke site (Fig. 4E and G). Additionally, stroke samples were assayed for SMI-32 immunoreactivity, which detects dephosphorylated neurofilament protein found in areas of axonal injury. At 7 days after stroke, there is an increase in SMI-32 immunoreactive fibers at the margins of the stroke site, in a zone above the striatum and just below the cortex. These fibers localize to an area of dense microglial/macrophage activity (Fig. 3F). Whereas, only a few SMI-32 immunoreactive fibers are present in subcortical white matter of control or contralateral brains (Fig. 3E).
Fig. 4.

Axonal and myelin damage after subcortical stroke. (A and B) MBP immunoreactivity contralateral (A) and ipsilateral (B) to stroke at 28 days after the infarct. Note area of stroke seen as a loss of myelin in a hole in subcortical white matter (arrows). (C and D) Neurofilament immunoreactivity contralateral (C) and ipsilateral (D) to stroke in same section as (A and B). The stroke site is apparent as an area of neurofilament/axonal loss (arrows). (E and F) MBP and SMI-31 stain of myelin and neurofilament patterns in contralateral (E) and ipsilateral (F) subcortical white matter 7 days after stroke. Arrows in (F) highlight the area of diminished MBP staining and preserved axonal filament staining. (G and H) High power views of peri-infarct white matter 7 days after stroke. In contralateral white matter (E) axons (red) are closely associated with myelin staining (green). At the stroke site axonal profiles (red) are present in areas of diminished myelin staining. Bar in (B) = 40 μm and applies to (A–F). Bar in (H) = 40 μm and applies to (G and H) (for interpretation of the references to color in this figure legend, the reader is referred to the web version of the article).
Axonal profiles were also examined in the YFP-H mouse line and through electron microscopic observation. At 7 days after stroke, axons are lost in the stroke core (Figs. 1C and 5B). At the margins of the core, dystrophic axon bulbs are seen. Axons can be followed to directly end in these bulbs, or individual axons contain multiple large, bulb-like swellings (Fig. 5C and D). The fascicles of corticofugal axons that penetrate the striatum to eventually form the corticospinal, corticothalamic and corticobulbar tracts also contain groups of degenerating axons, with large dystrophic swellings at end of enlarged and irregular axons (Fig. 5C). At the ultrastructural level, a subset of axons at 1 day after stroke appears dark with electron dense axoplasm at the stroke site (Fig. 5E), a sign of early axonal damage. At 7 days after the stroke, there are large fields of degenerating axonal profiles with disintegrating myelin sheaths. Cells with ultrastructural characteristics of microglia are often found in close physical proximity to degenerating axons (Fig. 5F), corresponding to the observed association of microglia with injured axons in the IBA-1 and SMI-32 staining (Fig. 3F).
Fig. 5.

Axonal damage from ischemic white matter stroke. (A–D) Sections taken from YFP-H line 7 days after stroke. (A) Normal subcortical white matter contains multiple linear axons and axon fascicles. (B) Seven days after white matter stroke axons have dropped out leading to fewer labeled axons in subcortical white matter. Damaged axons contain retraction bulbs seen as bright varicosities. (C) Higher power view of damaged axons and retraction bulbs present in white matter projections through the striatum below the stroke site. (D) Higher power view of retraction bulbs and beaded axons (arrows) in subcortical white matter. (E and F) Electron micrograph of subcortical white matter 1 day after stroke (E) and 7 days after stroke (F). Arrows in (E) show injured axons with electron dense cytoplasm. Arrows in (F) show degenerating axons with vacuoles and separated and fragmented myelin sheaths. Arrowhead in (F) shows cell with microglial morphology adjacent to degenerating axon EM images taken at 4800×. Bar in (B) applies to (A and B) = 40 μm; Bar in (D) applies to (C and D) = 40 μm.
3.5. Neuronal circuits affected by subcortical white matter stroke
This stroke is produced in subcortical white matter below forelimb motor cortex. This region of the subcortical white matter contains fascicles of axons projecting from overlying cortex to contralateral cortex and subcortical projections from the overlying cortex to striatum, thalamus, brainstem and spinal cord. To map the connections that are damaged by this stroke, the neuroanatomical tracer BDA was co-injected with ET-1. Neurons retrogradely labeled by a BDA injection into subcortical white matter represent cells with damaged axons at the stroke site. However, because of the very limited spatial extent of the subcortical white matter in the mouse, some of the injected BDA was placed into the most superficial aspect of the dorsolateral striatum. There was no difference in the character of the induced stroke between BDA/ET-1 injection and ET-1 alone. BDA-labeled neurons are present in layers II/III and V/VI in cortical areas ipsi- and contralateral to the stroke site (Fig. 6). Neurons are labeled in forelimb and hindlimb somatosensory and motor cortex and whisker (barrel field) somatosensory cortex. Within cortex a mean of 1024 ± 41 neurons are labeled per animal, approximately 0.7% of the cortical neurons from this region. The total number of neurons in the corresponding sections is determined by NeuN staining (total 150,995 ± 6277 neurons, n = 3). The largest single collection of cells that project through the stroke site is in layer V of overlying frontal motor cortex (Fig. 6).
Fig. 6.

Neuronal projections through stroke site. Line drawings are from digitized maps of labeled cells from a co-injection of the anatomical tracer BDA with ET-1. The sites of the stroke and BDA injections are indicated with X. The dots represent cells that were retrogradely labeled from the stroke site. Bar = 350 μm. The inset is a high magnification photomicrograph of labeled neurons from the BDA injection. Bar in inset = 20 μm.
3.6. Glial progenitor responses
In animal models of multiple sclerosis, inflammatory white matter lesions produce a limited regenerative response from OPCs, which divide and differentiate into oligodendrocytes. Staining for the OPC marker NG2 indicates a progressively larger and more intensely stained cell population in white matter stroke, beginning at day 3 and progressively increasing to day 14 (Fig. 2G and H). To determine if OPC proliferation occurs in subcortical white matter stroke, mice were administered BrdU for one week after ET-1 injection and sacrificed at days 7 and 28 time points in the early and late phases of neuropathological change in this stroke model. The BrdU pulse-labeling also allowed a preliminary assessment of the fate of these progenitors, as the progeny of the BrdU incorporated cells can be phenotyped by cell-specific markers and their numbers can be compared between time points. BrdU injection through the first week after stroke labeled a population of dividing OPCs that is maximal at day 7 after the stroke, and then declined by day 28 (BrdU/NG2 7 day vs. 28 day 3918.33 ± 238.03, 2150.0 ± 413.54, p = 0.003, Fig. 7B). A similar pattern was observed in BrdU incorporated oligodendrocytes, which are products of differentiated BrdU labeled OPCs (BrdU/transferrin 7 day vs. 28 day 3665.0 ± 456.54, 1941.67 ± 677.98, p = 0.02, Fig. 7B). Whereas, BrdU administration to the no-injection control mice resulted in BrdU incorporation limited to the SVZ and dentate gyrus. Populations of BrdU/NG2 and BrdU/transferrin cells were randomly selected in several sections and examined with high magnification confocal microscopy and z plane reconstruction to confirm that double-labeling was indeed due to colocalization (Fig. 7 A).
Fig. 7.

Early and late response of OPCs and oligodendrocytes following subcortical stroke. BrdU pulse-chase experiment at day 7 and 28 after subcortical stroke. (A) Representative images of BrdU double labeling of oligodendrocyte progenitor cells (OPC) with OPC marker NG2 (top panel), and oligodendrocytes with specific marker transferrin (bottom panel) at day 7. The insets correspond to higher power views. Bar in right middle panel of A = 20 μm. (B) Total number of double labeled cells estimated by stereology: means ± standard deviations. NG2 7 day vs. 28 day 3918.33 ± 238.03, 2150.0 ± 413.54, p = 0.003; transferrin 7 day vs. 28 day 3665.0 ± 456.54, 1941.67 ± 677.98, p = 0.02.
4. Discussion
The animal modeling of human stroke subtypes is limited by the lack of a suitable in vivo model for subcortical white matter stroke. The available stroke models of large vessel occlusion mostly affect a combination of gray matter and white matter by infarcting much of the cerebral hemisphere, or selectively target striatum or cortex (Carmichael, 2005). These approaches do not provide the specific, isolated white matter infarct that is seen in human sub-cortical or lacunar strokes. Although the mechanisms of cellular injury in response to ischemia can been studied in in vitro white matter preparations, this approach fails to reflect the diverse cellular involvement in cell death and repair mechanisms that occur in vivo. Models of subcortical white matter in the mouse would further take advantage of the molecular genetic approaches in this species that allow specific studies of cell types and molecular mechanisms involved in injury and repair. With these issues in mind, an important initial question arises in developing a mouse model of white matter stroke: what type of white matter ischemia should be modeled?
White matter ischemia in humans can be classified into several categories based on imaging and neuropathological findings. Lacunar infarctions result from occlusion of perforating vessels and produce a small stroke cavity on pathology and in MRI (Lammie, 2002; Matsusue et al., 2006). These strokes may cause clinical lacunar syndromes, such as pure motor stroke or hemisensory loss, or may be clinically silent. Lesions without a true stroke cavity appear as subcortical white matter hyperintensites on MRI, and myelin and axon loss and diminished oligodendrocyte staining in pathological studies (Matsusue et al., 2006; Kim et al., 2008). These have also been implicated in lacunar syndromes, but more often are individually asymptomatic and accumulate to produce global cognitive dysfunction (Vinters and Carmichael, 2008). Recent prospective studies indicate these two lesions, subcortical lacunar stroke and subcortical white matter hyperintensities, may represent a spectrum of the same process of subcortical small vessel ischemia (Gouw et al., 2008), although this idea is still controversial (Wardlaw, 2008). This spectrum of subcortical stroke, from a frank infarct cavity to an area of incomplete axonal and myelin damage, is supported by neuropathological grading scales of sub-cortical stroke, which note a range of cell death and white matter destruction from a true stroke cavity to an area of myelin, axon and oligodendrocyte loss (Lammie, 2002; Udaka et al., 2002; Kim et al., 2008). The present studies indicate that ET-1 injection into subcortical white matter of the mouse models the disease spectrum of lacunar stroke-incomplete white matter damage.
4.1. ET-1 induced ischemia results in focal white matter infarct with secondary myelin and axonal damage
The observed focal white matter infarct contrasts with other recently utilized white matter ischemia models. The model of bilateral common carotid occlusion produces a chronic, diffuse white matter ischemia, however it is maximal in the optic nerve, and also produces patchy neuronal cell death in hippocampus and retina (Pappas et al., 1997). Recent reports of ET-1 injection in white matter tracts of the rat also show white matter infarct cavities (Frost et al., 2006; Lecrux et al., 2008). In one of these models, ET-1 injection into the rat results in a behavioral deficit (Frost et al., 2006). In the present model, there was no obvious forelimb motor deficit on gross observation after a 3-day period from the infarct (unpublished observations). However, this model has the advantage that the extensive array of mouse genetic tools can be applied to the study of mechanisms of white matter cell death and repair. In a careful study of ET-1 effects in mouse, Steinberg and colleagues recently reported the ET-1 injection into the mouse did not produce consistent cerebral infarctions (Horie et al., 2008). This finding varies from the present results, where evidence for cell death and white matter damage were noted across eight different measures of death or damage and through electron microscopic analysis. A major difference between the present study and Horie et al. is that in the present technique ET-1 was slowly pulsed directly into white matter using a very fine glass micropipette, along an axis of white matter axonal cylinder diffusion and not through a vertical approach. This may have allowed local ET-1 concentrations to remain at a vasoconstricting level for longer. This is supported in the studies in which the tracer BDA was co-injected with ET-1, as staining for BDA indicate diffusion along white matter fascicles within the short distance of the subcortical region below motor cortex.
Following the white matter infarct, secondary axonal and myelin degeneration takes place around the stroke site. Initially, axons are lost in the infarct core. Subsequently, degenerating axonal fibers form dystrophic “end bulbs” in subcortical white matter adjacent to the core and in white matter tracts that extend from the stroke site through the striatum. This stroke thus disconnects widespread neuronal circuits in bilateral sensory and motor cortical areas. The size of the stroke, as evidenced by neurofilament staining, grew over the first month after the ET-1 injection. This may be due to the turnover time of damaged neurofilaments (Millecamps et al., 2007), but it may also represent a potentially treatable evolving degeneration in hypomyelinated and vulnerable peri-infarct axons. Myelin degeneration is evidenced by loss of myelin staining in the infarct core as well as the peri-infarct zone, and separating myelin sheaths observed in electron microscopy preparations. However, regions of peri-infarct white matter display a relative preservation of axonal profiles in regions of diminished myelin staining. This has been reported in a pig model of subcortical stroke (Tanaka et al., 2008) and in pathological study of human ischemic white matter disease (Lammie, 2002; Kim et al., 2008). Similarly, in longitudinal prospective studies of subcortical white matter lesions on MRI, small lacunar infarcts often produce adjacent rims of abnormal white matter (Gouw et al., 2008). Future studies will need to directly address the problem of infarct evolution in white matter stroke.
4.2. ET-1 induced subcortical stroke causes oligodendrocyte apoptosis and activates inflammatory mechanisms
In large artery stroke models and transient forebrain ischemia, oligodendrocyte cell death occurs within the first several days through an apoptotic mechanism (Tanaka et al., 2003). Indeed, in transient forebrain ischemia apoptotic oligodendrocyte cell death occurs before neuronal cell death (Petito et al., 1998). Oligodendrocyte cell death in the present model of white matter stroke follows a similar time course, with nuclear AIF, activated PARP and double stranded DNA nicking in oligodendrocytes at the center of the stroke site maximal 1 day after ET-1 injection. However, in this white matter stroke model apoptotic oligodendrocytes extend away from the stroke core into adjacent white matter areas that will not form part of the stroke cavity. Importantly, the areas of apoptotic oligodendrocytes correspond to areas of relative myelin loss. Oligodendrocyte cell death and secondary demyelination may place axons at risk for subsequent damage (Tekkok and Goldberg, 2001). Microglia/macrophage cells infiltrate the ischemic white matter and localize to SMI-32 positive axons soon after ET-1 injection. The SMI-32 antibody recognizes a dephosphorylated neurofilament protein that is sparsely present in normal brain, but marks areas of axonal damage after injury (Petzold et al., 2008). Such interaction between microglia and degenerating axons was confirmed ultrastructurally through the electron microscopy studies, Interestingly, IBA-1 positive microglia were also present in the contralateral side to the infarct, which may be a remote effect of the subcortical stroke. Lastly, the white matter hyperintensity observed in MRI studies, especially at day 2, very likely corresponds to immune cell infiltration and associated edema.
4.3. Glial cells respond to subcortical stroke by proliferation and differentiation
White matter stroke triggers a response from OPCs and astrocytes. NG2 positive OPCs respond to the ischemic lesion with proliferation within the first week of the stroke. After a month, fewer proliferated NG2 cells are observed. Newly generated oligodendrocytes are also present in substantial numbers one week after the infarct. These findings suggest a robust process of oligodendrocyte regeneration within the first week after white matter stroke and a potential partial reparative response, especially within the region of relative hypomyelination in peri-infarct white matter. Such a proliferative response from NG2 positive OPCs is seen in cortical stab wound injury and in inflammatory lesions of white matter (Hampton et al., 2004; Menn et al., 2007). Quantification of this process suggests that NG2 cells divide early after the stroke and are initiated to differentiate into oligodendrocytes. However, from the present data it is not clear why the number of BrdU-labeled NG2 cells and oligodendrocytes decline over one month after stroke. One possible explanation may be directly related to the astrocytic activation triggered by the stroke. Reactive astrocytes are concentrated in white matter following subcortical stroke and are found in close association with white matter tracts. Astrocytes produce extracellular hyaluronic acid that plays a role in glial scar formation and impairs OPC regenerative response in neonatal ischemia (Back et al., 2005). Hyaluronic acid is also deposited in the glial scar in this adult white matter stroke model, suggesting that local scar formation in white matter stroke may block OPC differentiation into mature oligodendrocytes. More systematic studies of cell fate mapping with inducible transgenic reporter mice (Dimou et al., 2008) might allow this question to be answered and are under way in this model. The contralateral hemisphere to the ET-1 injection displays an increase in hyaluronic acid deposition as well, yet not as pronounced as the peri-infarct area. As the infarct disconnects axonal tracts that carry connections from cell bodies that are located bilaterally, this increase may be secondary to remote astrocyte activation following axonal injury.
In summary, these data define a viable subcortical white matter stroke model in the mouse and suggest clinically relevant aspects of white matter stroke that impact initial death and degeneration or repair such as: the peri-infarct zone of partial damage, a microglial association with axonal degeneration, a glial progenitor response that may be manipulated to enhance repair in the peri-infarct zone, and the effect of a relatively widespread sensorimotor network that is disconnected by ischemic white matter axotomy.
Supplementary Material
Supplementary Figure 1. Immunohistochemical staining for oligodendrocytes (CAII) and a marker of apoptotic cell death (PARP) co-localize (arrows) in subcortical white matter at the site of endothelln-1 injection.
Supplementary Figure 2. IBA-1 immunoreactive microglia are sparse in control brains (A). Following ET-1 mediated stroke, IBA-1 reactive microglia fills in the subcortical white matter (B).The inset shows a high pwer view of activated microglia.
Acknowledgments
We would like to thank Ms. Caroline Wallner for technical assistance, Ms. Birgitta Sjöstrand for excellent ultrastructural tissue processing, and Andy Frew and Dr. Jeff Alger for assistance in MRI imaging. These studies were supported by the Dr. Miriam and Sheldon G. Adelson, Medical Research Foundation.
Appendix A. Supplementary data
Supplementary data associated with this article can be found, in the online version, at doi:10.1016/j.jneumeth.2009.03.017.
Footnotes
Conflict of interest
The authors declare no conflict of interest.
References
- Back SA, Tuohy TM, Chen H, Wallingford N, Craig A, Struve J, et al. Hyaluronan accumulates in demyelinated lesions and inhibits oligodendrocyte progenitor maturation. Nat Med. 2005;11:966–72. doi: 10.1038/nm1279. [DOI] [PubMed] [Google Scholar]
- Bamford J, Sandercock P, Dennis M, Burn J, Warlow C. Classification and natural history of clinically identifiable subtypes of cerebral infarction. Lancet. 1991;337:1521–6. doi: 10.1016/0140-6736(91)93206-o. [DOI] [PubMed] [Google Scholar]
- Carmichael ST. Animal models of stroke: size, mechanism and purpose. NeuroRx. 2005;2:396–409. doi: 10.1602/neurorx.2.3.396. [DOI] [PMC free article] [PubMed] [Google Scholar]
- Carmichael ST, Vespa PM, Saver JL, Coppola G, Geschwind DH, Starkman S, et al. Genomic profiles of damage and protection in human intracerebral hemorrhage. J Cereb Blood Flow Metab. 2008;28:1860–75. doi: 10.1038/jcbfm.2008.77. [DOI] [PMC free article] [PubMed] [Google Scholar]
- Dimou L, Simon C, Kirchhoff F, Takebayashi H, Götz M. Progeny of Olig2-expressing progenitors in the gray and white matter of the adult mouse cerebral cortex. J Neurosci. 2008;28:10434–42. doi: 10.1523/JNEUROSCI.2831-08.2008. [DOI] [PMC free article] [PubMed] [Google Scholar]
- Feng G, Mellor RH, Bernstein M, Keller-Peck C, Nguyen QT, Wallace M, et al. Imaging neuronal subsets in transgenic mice expressing multiple spectral variants of GFP. Neuron. 2000;28:41–51. doi: 10.1016/s0896-6273(00)00084-2. [DOI] [PubMed] [Google Scholar]
- Frost SB, Barbay S, Mumert ML, Stowe AM, Nudo RJ. An animal model of capsular infarct: endothelin-1 injections in the rat. Behav Brain Res. 2006;169:206–11. doi: 10.1016/j.bbr.2006.01.014. [DOI] [PubMed] [Google Scholar]
- Fuxe K, Kurosawa N, Cintra A, Hallström A, Goiny M, Rosen L, et al. Involvement of local ischemia in endothelin-1 induced lesions of the neostriatum of the anaesthetized rat. Exp Brain Res. 1992;88:131–9. doi: 10.1007/BF02259134. [DOI] [PubMed] [Google Scholar]
- Gouw AA, van der Flier WM, Pantoni L, Inzitari D, Erkinjuntti T, Wahlund LO, et al. On the etiology of incident brain lacunes: longitudinal observations from the LADIS study. Stroke. 2008;39:3083–5. doi: 10.1161/STROKEAHA.108.521807. [DOI] [PubMed] [Google Scholar]
- Hampton DW, Rhodes KE, Zhao C, Franklin RJ, Fawcett JW. The responses of oligodendrocyte precursor cells, astrocytes and microglia to a cortical stab injury, in the brain. Neuroscience. 2004;127:813–20. doi: 10.1016/j.neuroscience.2004.05.028. [DOI] [PubMed] [Google Scholar]
- Hughes PM, Anthony DC, Ruddin M, Botham MS, Rankine EL, Sablone M, et al. Focal lesions in the rat central nervous system induced by endothelin-1. J Neuropathol Exp Neurol. 2003;62:1276–86. doi: 10.1093/jnen/62.12.1276. [DOI] [PubMed] [Google Scholar]
- Horie N, Maag AL, Hamilton SA, Shichinohe H, Bliss TM, Steinberg GK. Mouse model of focal cerebral ischemia using endothelin-1. J Neurosci Methods. 2008;173:286–90. doi: 10.1016/j.jneumeth.2008.06.013. [DOI] [PMC free article] [PubMed] [Google Scholar]
- Kim KW, MacFall JR, Payne ME. Classification of white matter lesions on magnetic resonance imaging in elderly persons. Biol Psychiatry. 2008;64:273–80. doi: 10.1016/j.biopsych.2008.03.024. [DOI] [PMC free article] [PubMed] [Google Scholar]
- Lammie GA. Hypertensive cerebral small vessel disease and stroke. Brain Pathol. 2002;12:358–70. doi: 10.1111/j.1750-3639.2002.tb00450.x. [DOI] [PMC free article] [PubMed] [Google Scholar]
- Lecrux C, McCabe C, Weir CJ, Gallagher L, Mullin J, Touzani O, et al. Effects of magnesium treatment in a model of internal capsule lesion in spontaneously hypertensive rats. Stroke. 2008;39:448–54. doi: 10.1161/STROKEAHA.107.492934. [DOI] [PubMed] [Google Scholar]
- Matsusue E, Sugihara S, Fujii S, Ohama E, Kinoshita T, Ogawa T. White matter changes in elderly people: MR-pathologic correlations. Magn Reson Med Sci. 2006;5:99–104. doi: 10.2463/mrms.5.99. [DOI] [PubMed] [Google Scholar]
- Mehta SL, Manhas N, Raghubir R. Molecular targets in cerebral ischemia for developing novel therapeutics. Brain Res Rev. 2007;54:34–66. doi: 10.1016/j.brainresrev.2006.11.003. [DOI] [PubMed] [Google Scholar]
- Menn B, Garcia-Verdugo JM, Yaschine C, Gonzalez-Perez O, Rowitch D, Alvarez-Buylla A. Origin of oligodendrocytes in the subventricular zone of the adult brain. J Neurosci. 2007;26:7907–18. doi: 10.1523/JNEUROSCI.1299-06.2006. [DOI] [PMC free article] [PubMed] [Google Scholar]
- Millecamps S, Gowing G, Corti O, Mallet J, Julien JP. Conditional NF-L transgene expression in mice for in vivo analysis of turnover and transport rate of neurofilaments. J Neurosci. 2007;27:4947–56. doi: 10.1523/JNEUROSCI.5299-06.2007. [DOI] [PMC free article] [PubMed] [Google Scholar]
- Nikolov R, Rami A, Krieglstein J. Endothelin-1 exacerbates focal cerebral ischemia without exerting neurotoxic action in vitro. Eur J Pharmacol. 1993;248:205–8. doi: 10.1016/0926-6917(93)90044-q. [DOI] [PubMed] [Google Scholar]
- Ohab JJ, Fleming S, Blesch A, Carmichael ST. A neurovascular niche for neurogenesis after stroke. J Neurosci. 2006;26:13007–16. doi: 10.1523/JNEUROSCI.4323-06.2006. [DOI] [PMC free article] [PubMed] [Google Scholar]
- Pantoni L, Garcia JH, Gutierrez JA. Cerebral white matter is highly vulnerable to ischemia. Stroke. 1996;27:1641–6. doi: 10.1161/01.str.27.9.1641. [DOI] [PubMed] [Google Scholar]
- Pappas BA, Davidson CM, Bennett SA, de la Torre JC, Fortin T, Tenniswood MP. Chronic ischemia: memory impairment and neural pathology in the rat. Ann N Y Acad Sci. 1997;826:498–501. doi: 10.1111/j.1749-6632.1997.tb48512.x. [DOI] [PubMed] [Google Scholar]
- Paxinos G, Franklin KBJ. Mouse brain in stereotaxic coordinates. San Diego: Academic Press; 2001. [Google Scholar]
- Petito CK, Olarte JP, Roberts B, Nowak TS, Jr, Pulsinelli WA. Selective glial vulnerability following transient global ischemia in rat brain. J Neuropathol Exp Neurol. 1998;57:231–8. doi: 10.1097/00005072-199803000-00004. [DOI] [PubMed] [Google Scholar]
- Petzold A, Gveric D, Groves M, Schmierer K, Grant D, Chapman M, et al. Phosphorylation and compactness of neurofilaments in multiple sclerosis: indicators of axonal pathology. Exp Neurol. 2008;213:326–35. doi: 10.1016/j.expneurol.2008.06.008. [DOI] [PMC free article] [PubMed] [Google Scholar]
- Shannon C, Salter M, Fern R. GFP imaging of live astrocytes: regional differences in the effects of ischaemia upon astrocytes. J Anat. 2007;210:684–92. doi: 10.1111/j.1469-7580.2007.00731.x. [DOI] [PMC free article] [PubMed] [Google Scholar]
- Tanaka K, Nogawa S, Suzuki S, Dembo T, Kosakai A. Upregulation of oligodendrocyte progenitor cells associated with restoration of mature oligodendrocytes and myelination in peri-infarct area in the rat brain. Brain Res. 2003;989:172–9. doi: 10.1016/s0006-8993(03)03317-1. [DOI] [PubMed] [Google Scholar]
- Tanaka Y, Imai H, Konno K, Miyagishima T, Kubota C, Puentes S, et al. Experimental model of lacunar infarction in the gyrencephalic brain of the miniature pig: neurological assessment and histological, immunohistochemical, and physiological evaluation of dynamic corticospinal tract deformation. Stroke. 2008;39:205–12. doi: 10.1161/STROKEAHA.107.489906. [DOI] [PubMed] [Google Scholar]
- Tekkok SB, Goldberg MP. AMPA/kainate receptor activation mediates hypoxic oligodendrocyte death and axonal injury in cerebral white matter. J Neurosci. 2001;21:4237–48. doi: 10.1523/JNEUROSCI.21-12-04237.2001. [DOI] [PMC free article] [PubMed] [Google Scholar]
- Udaka F, Sawada H, Kameyama M. White matter lesions and dementia: MRI-pathological correlation. Ann N Y Acad Sci. 2002;977:411–5. doi: 10.1111/j.1749-6632.2002.tb04845.x. [DOI] [PubMed] [Google Scholar]
- van Dierendonck JH. DNA damage detection using DNA polymerase I or its Klenow fragment. Applicability, specificity, limitations. Methods Mol Biol. 2002;203:81–108. doi: 10.1385/1-59259-179-5:81. [DOI] [PubMed] [Google Scholar]
- Vinters HV, Carmichael ST. The impact of cerebral small vessel disease on cognitive impairment and rehabilitation. In: Stuss DT, Winocur G, Robertson IH, editors. Cognitive neurorehabilitation: evidence and application. Cambridge: Cambridge Univ Press; 2008. pp. 360–75. [Google Scholar]
- Veenman CL, Reiner A, Honig MG. Biotinylated dextran amine as an antero-grade tracer for single- and double-labeling studies. J Neurosci Methods. 1992;41:239–54. doi: 10.1016/0165-0270(92)90089-v. [DOI] [PubMed] [Google Scholar]
- Wardlaw JM. What is a lacune? Stroke. 2008;39:2921–2. doi: 10.1161/STROKEAHA.108.523795. [DOI] [PubMed] [Google Scholar]
Associated Data
This section collects any data citations, data availability statements, or supplementary materials included in this article.
Supplementary Materials
Supplementary Figure 1. Immunohistochemical staining for oligodendrocytes (CAII) and a marker of apoptotic cell death (PARP) co-localize (arrows) in subcortical white matter at the site of endothelln-1 injection.
Supplementary Figure 2. IBA-1 immunoreactive microglia are sparse in control brains (A). Following ET-1 mediated stroke, IBA-1 reactive microglia fills in the subcortical white matter (B).The inset shows a high pwer view of activated microglia.