

Abstract
Objective: This study was to investigate the effects of siRNA mediated silencing of myeloid cell leukelia-1 (Mcl-1) on the biological behaviors and drug resistance of human drug-resistant gastric cancer (GC) cell lines, and to explore the potential mechanisms. Methods: siRNA targeting Mcl-1 mRNA were designed and independently transfected into SGC-7901/VCR and SGC-7901/DDP. Cell proliferation and drug sensitivity were examined by MTT assay. Cell apoptosis and cell cycle were detected by flow cytometry. Cell Invasion and migration abilities were detected by transwell chamber assays. The expressions of drug-resistance-related genes and apoptosis-related proteins were detected by quantitative real-time PCR and Western blot assay, respectively. Results: siRNA effectively inhibited the Mcl-1 expression, lowered the proliferation rate (P<0.05), raised the apoptosis rate (P<0.05), and arrested cells in S-phase (P<0.05). After inhibiting Mcl-1, the cell migration and invasion decreased (P<0.05), the resistance to VCR, DDP and 5-Fu was reversed to different extents (P<0.05), TS mRNA expression increased significantly (P<0.05), MDR1 remained unchanged (P>0.05), but DPD and TOP2A decreased significantly (P<0.05). Following Mcl-1 silencing, Bcl-2 was over-expressed in VCR-siRNA group, but the expressions of Fas and survivin reduced markedly (P<0.05); Bcl-2 and Fas expressions decreased significantly in DDP-siRNA group (P<0.05), but survivin expression remained unchanged. Conclusion: Mcl-1 is implicated in the proliferation, invasion, apoptosis and drug resistance of GC cells, and may be a promising target for the therapy of GC.
Keywords: Myeloid cell leukelia-1 gene, siRNA, gastric cancer, drug resistance, mechanism
Introduction
Gastric cancer (GC) is one of the most common malignancies worldwide. At initial hospital visit, most GC patients are often diagnosed with GC at middle or advanced stage, surgery alone can’t achieve satisfactory therapeutic efficacy, and postoperative chemotherapy is needed after surgery. However, the presence of multidrug resistance significantly reduces the efficacy of chemotherapy. The molecular mechanism underlying the chemotherapy resistance of GC is not fully understood. Hence, a better understanding of the molecular mechanisms associated with the multidrug resistance of GC will be beneficial for the development of effective therapeutic strategies.
Myeloid cell leukelia-1 (Mcl-1) is a member of the B-cell lymphoma-2 (Bcl-2) family has been reported to be implicated in the drug resistance of many malignancies. Yecies et al. [1] demonstrated that lymphoma cells exposed to ABT-737 for a long time developed drug resistance. Further studies reveal that the emergence of drug resistance is usually accompanied by the Mcl-1 over-expression, and to reduce Mcl-1 expression may restore its drug sensitivity. Li et al. [2] confirmed that aspirin induced reversal of drug resistance of liver cancer cells (ABT-263 cells) was associated with a decrease in Mcl-1 expression. Mcl-1 is over expressed in 5-Fu and DDP-resistant GC cell lines [3]. Given its diverse functions, especially in the drug resistance, to investigate the role of Mcl-1 in the GC will be of great importance.
RNA interference (RNAi) is a new technique developed for gene silencing in recent years, and it can knockdown the mRNA expression of a specific gene at the post-transcription level [4]. RNAi technology has the advantages of high efficiency and good specificity and can effectively inhibit the expression of target genes. With the help of TAR-RNA-binding protein, siRNA binds to the ribonucleotide enzyme complexes to form RNA-induced silencing complex (RISC), which consists of siRNA and Argonaute protein and Dicer enzyme. Activated RISC binds to the homologous mRNA to cleavage and degrade the target mRNA. This method has been widely applied to explore the gene function and for the gene therapy of malignant tumors [5,6]. In this study, RNAi was also employed to investigate the effect of Mcl-1 silencing on the cell proliferation, cycle, apoptosis, migration, invasion and drug resistance of human GC cell lines, and to explore the potential mechanism.
Materials and methods
Cell culture
Human GC cell lines SGC-7901 (adenocarcinomas) were purchased from the Shanghai Cell Bank (http://www.cellbank.org.cn), SGC-7901/VCR (vincristine [VCR]-resistant human GC cells) from Xiangya Cell Bank, Central South University and SGC-7901/DDP (cisplatin [DDP]-resistant human GC cells) from Nanjing KeyGEN Biotech. CO., LTD. These cell lines were maintained in Dulbecco’s modified Eagle’s medium (DMEM) (Gibco, United States) containing 10% (v/v) fetal bovine serum (FBS) (HyClone, Logan City), penicillin G (100 units/mL) (Sigma, United States) and streptomycin (100 μg/mL) (Sigma, United States) at 37°C in humidified air with 5% CO2. SGC-7901/VCR and SGC-7901/DDP were treated with VCR at 1.0 µg/ml and DDP at 0.8 µg/ml, respectively, in the complete medium to maintain their resistant phenotypes. VCR and DDP in the medium were removed at 2 weeks before the experiment.
siRNA synthesis and cell transfection
Four human siRNAs sequences were designed against Mcl-1 (GenBank NM_021960. 4) as follows: siRNA1: Mcl-1-siRNA-892 (sense: 5’-CCAAGGCAUGCUUCGGAAATT-3’, antisense: 5’-UUUCCGAAGCAUGCCUUGGTT-3’); siRNA2: Mcl-1-siRNA-927 (sense: 5’-GACGAUGUGAAAUCGUUGUTT-3’, anti-sense: 5’-ACAACGAUUUCACAUCGUCTT-3’); siRNA3: Mcl-1-siRNA-1023 (sense: 5’-CCUUUGUGGCUAAACACUUTT-3’, antisense: 5’-AAGUGUUUAGCCACAAAGGTT-3’); siRNA4: Mcl-1-siRNA-1543 (sense: 5’-GUAGGGUGGAAAGACUUAATT-3’, antisense: 5’-UUAAGUCUUUCCACCCUACTT-3’). One negative random siRNA (GenePharma, Shanghai, China) exhibiting no significant similarity to human, mouse or rat gene sequences served as a negative control. One negative random siRNA 5 (scrambled negative control, NC) (sense: 5’-UUCUCCGAACGUGUCACGUTT-3’, antisense: 5’-ACGUGACACGUUCGGAGAATT-3’) and negative control sequence with fluorescent marker (FAM) siRNA 6 (sense: 5’-UUCUCCGAACG-UGUCACGUTT-3’, antisense: 5’-ACGUGACACGUUCGGAGAATT-3’) served as two negative controls. Negative random siRNAs exhibit no significant similarity to human, mouse or rat gene sequences. One positive control GAPDH-siRNA (NM-002046. 3): (sense: 5’-GUAUGACAACAGCCUCAAGTT-3’, antisense: 5’-CUUGAGGCUGUUGUCAUACTT-3’) was also synthesized. These siRNAs were synthesized by GenePharma (Shanghai, China). Transfection was performed in the presence of Lipofectamine (Invitrogen, USA) according to the manufacturer’s instructions. Transfection efficiency was detected by calculating the proportion of cells with green fluorescence to total cells under a fluorescence microscope, and then selected the optimal transfection ratio: liposomes/cells/siRNA. The optimal proportion of liposomes/cells/siRNA was used for subsequent experiments.
Quantitative real-time PCR (qRT-PCR)
Trizol reagent (Takara, Japan) was used to independently extract the total RNA from SGC-7901, SGC-7901/VCR and SGC-7901/DDP cells. The purity and concentration of RNA were detected by using ultramicro-spectrophotometer NanoDrop 2000 (Thermo, USA). Reverse transcription was performed in 20 μl of reaction system at 37°C for 15 min and at 85°C for 5 s. After reverse transcription of total RNA, the first-strand cDNA was then used as a template for the expansion of mRNA using quantitative real-time PCR with the SYBR Green Master Mix (Roche, Germany). Quantitative real-time PCR reaction was performed in 20 μl of reaction system as follows: 95°C for 30 s, and 40 cycles of 95°C for 5 s and 60°C for 30 s. β-actin (NM_001101. 3) was used as a control. Quantitative real-time PCR was performed using an ABI 7500 Sequence Detector (ABI, Warrington, United Kingdom) according to the manufacturer’s instructions, and the expression of a specific gene was determined with 2-ΔΔct method. The primers were synthesized in TaKaRa Co. as follows: β-actin: (forward: 5’-TGGCACCCAGCACAATGAA-3’, reverse: 5’-CTAAGTCATAGTCCGCCTAGAAGCA-3’, product size: 186 bp); Mcl-1 (NM_021960. 4): (forward: 5’-GCTTGCTTGTTACACACACAGGTC-3’, reverse: 5’-GCAGAACAATCAGCAATTTCAAGG-3’, product size: 195 bp), GAPDH (NM_002046. 3): (forward: 5’-GCACCGTCAAGGCTGAGAAC-3’, reverse: 5’-TGGTGAAGACGCCAGTGGA-3’, product size: 138 bp), MDR1 (NM_000927. 4): (forward: 5’-AGGCCAACATACATGCCTTCATC-3’, reverse: 5’-GCTGACGTGGCTTCATCCAA-3’, product size: 163 bp); TS (NM_001071. 2): (forward: 5’-GAATCATCATGTGCGCTTGGA-3’, reverse: 5’-TGTTCACCACATAGAACTGGCAGAG-3’, product size of 90 bp); DPD (NM_000110. 3): (forward: 5’-TGCTACATGACCTGTAATGATTCTG-3’, reverse: 5’-TTGGTTCATAAGGTGTTGTCCTG-3’, product size: 166 bp); TOP2A(NM_001067. 3): (forward: 5’-CAATTAGCTGGATCAGTGGCTGAA-3’, reverse: 5’-CTGACCAATGGGCTGCAAGA-3’, product size: 132 bp).
Western blot assay
Total protein were independently extracted form SGC-7901 and SGC-7901/VCR and SGC-7901/DDP, separated by 12% sodium dodecylsulfate polyacrylamide gel electrophoresis (60 µg per lane), and transferred onto a polyvinylidene fluoride membrane. Then, the membrane was blocked with 5% bovine serum albumin at room temperature for 1 h, and incubated with antibodies against β-actin (1:10000, Shanghai Kang Cheng biological engineering Co., LTD), Mcl-1 (1:5000, Abcam UK), Bcl-2 (1:500, CST USA), caspase-3 (1:1000, CST USA), Fas (1:1000, Cell signaling technology, USA), or survivin (1:1000, Abcam UK) at 4°C overnight. Subsequently, the membrane was treated with the secondary antibody (1:5000, ZSGB-BIO) at room temperature for 1 h. ECL kit (Beijing Pulitzer gene technology co., LTD) was used visualization and Quantity One software is employed for the measurement of optical density as the protein expression.
Cell growth assay
Cells were divided into 4 groups: CTRL group, Mock group, NC group and Mcl-1-siRNA group. Cells were plated in 96-well plates (4×10³ cells/200 µL per well). Cells were maintained for 5 days, and cell growth was measured every day. In brief, 20 μl of 3-[4,5-dimethylthiazol-2-yl]-2,5-diphenyltetrazoliumbromide (MTT) bromide solution was added at the indicated time point, followed by incubation for 4 h. After careful removal of the medium, 200 μL of dimethyl sulfoxide was added to each well, followed by incubation for 15 min. The absorbance (A) was measured with the iMark Microplate Reader (Bio-Rad, United Kingdom) at 570 nm. The growth curve was delineated with time as the horizontal axis and A as vertical axis The cell proliferation rate was calculated as follow: Aexperiment/Ablank control×100%.
Drug sensitivity assay
Cells were divided into 4 groups: CTRL group, Mock group, NC groups and Mcl-1-siRNA group. Cells were seeded into a 96-well plate (4000 cells/200 μl per well) and grown in medium supplemented with chemotherapeutics (VCR: 50, 5, 0.5, 0.05, 0.005 and 0.0005 μg/ml; DDP: 50, 10, 2, 0.4, 0.08 and 0.016 μg/ml; 5-Fu: 2500, 250, 25, 2.5, 0.25 and 0.025 μg/ml) for 48 h. MTT assay was performed to evaluate the drugs sensitivity. All experiments were performed in sextuplicate. The cell growth inhibition rate was calculated as follow: (ACTRL group-AExperimental group)/ACTRL group×100%. The curve of cell growth inhibition rate was delineated for different drugs, and then the half inhibitory concentration was calculated (IC50) for each drug. The IC50 was calculated as follow: lgIC50=Xm-I (P-[3-Pm-Pn]/4); Xm: lg maximum dose; I: lg (maximum doseadjacent dose); P: sum of positive reaction rate; Pm: highest positive reaction rate; Pn: lowest positive reaction rate. Resistance Index (RI)=IC50(A)/IC50(B); A: cells with Mcl-1 silencing; B: normal cells.
Detection of cell apoptosis and cell cycle by flow cytometry
Apoptotic cells in early and late stages were detected using an annexin V-FITC Apoptosis Detection Kit from BioVision (Mountain View, CA, United States). In brief, cells were collected by centrifugation. After washing, cells were re-suspended in 100 μL of annexin V binding buffer, followed by addition of 5 μL of annexin V-PE and 5 μL of 7-AAD (BD, USA). After incubation in dark for 15 min at room temperature, 400 μL of binding buffer was added, and cells were subjected to flow cytometry (FCM). For the detection of cell cycle by flow cytometry (FCM), cells were harvested after transfection, washed with PBS, fixed in cold 70% ethanol, and stored at 4°C for staining. After fixation, the cells were washed with PBS and incubated with 100 μL of RNaseA (Sigma, USA) for 30 min at 37°C, followed by incubation with 400 μL of propidium iodide (Nanjing Keygen Technology Development Co., LTD) in dark for 30 min at 4°C and detection by FCM.
Cell migration and invasion assays
Cell migration ability was measured using the Polycarbonate Membrane Transwell Inserts (Corning, USA). The cells were suspended in RPMI-1640 medium that contained 0.5% FBS, its density was adjusted to 1×10⁶/mL. Then, 100 μL of cell suspension was added to the upper chambers of Transwell, and 500 µL of RPMI-1640 containing 5% FBS to lower chambers. Cells were incubated for 24 h at 37°C in a humidified atmosphere containing 5% CO2. The remaining cells on the upper surface were mechanically removed with a cotton swab, and then the basement membranes were washed, fixed in formaldehyde for 5 min, and stained by Methyl Violet (Medion Diagnostics, Germany). The migration ability of cells was determined by calculating the proportion of cells migrating to the lower surface to total cells under a light microscope. Five fields were randomly selected for cell counting and experiment was performed in triplicate.
Cell invasion assay was performed using the polycarbonate membrane transwell (Corning, United States) coated with matrigel (BD Biosciences, San Jose, CA, United States). Matrigel was diluted in cold serum free RPMI-1640. The basement membrane of Transwell chambers were pre-coated with matrigel (50 µL/well), followed by being dried at 37°C for 4 h. The following procedures used for the detection of cell invasion ability were similar to those for cell migration assay.
Statistical analysis
Statistical analysis was performed with SPSS version 16.0, and data are expressed as mean ± standard deviation (SD; x̅ ± s). Values of the two groups (such as the expression of Mcl-1 of SGC-7901 cells vs SGC-7901/VCR cells or SGC-7901/DDP cells) were compared with ANOVA test. Values of several groups in these fields (such as the expression of Mcl-1 at different time points, proliferation, cell cycle distribution, migration and invasion abilities, apoptosis and apoptosis related protein expressions and drug resistance and expressions of drug resistance-related genes after transfection) were compared using Student-Newman-Keuls’ (SNK) test in post-hoc testing of ANOVA. P<0.05 was determined to be statistically significant.
Results
Mcl-1 was over-expressed in drug-resistant gastric cancer cell lines
The Mcl-1 expression was detected by qRT-PCR and Western blot assay in ICC tissues. The mRNA (Figure 1A) and protein (Figure 1B, 1C) expressions of Mcl-1 in SGC-7901/VCR cells and SGC-7901/DDP cells were significantly higher than those in SGC-7901 cells (P<0.05).
Figure 1.

Expression of Mcl-1 in human gastric cancer cell line SGC-7901 cells and human drug-resistant gastric cancer cell line SGC-7901/VCR cells and SGC-7901/DDP cells. A. mRNA expression of Mcl-1 significantly increased in SGC-7901/VCR cells and SGC-7901/DDP cell (*P<0.05 vs SGC-7901 cells). B, C. Protein expression of Mcl-1 markedly increased in SGC-7901/VCR cells and SGC-7901/DDP cells (*P<0.05 vs SGC-7901 cells).
siRNA down-regulated Mcl-1 expression
The transfection efficiency was evaluated under a fluorescence microscope, and results showed difference in the transfection efficiency at different transfection ratio (liposomes/cells/siRNA). The transfection ratio of SGC-7901/VCR cells and SGC-7901/DDP cells was 1.5/105/1.5, 1.5/105/2, 1.5/105/2.5, 1/105/1.5, 1/105/2, 1/105/2.5, respectively. The transfection ratio=1.5/105/2.5 (liposomes/cells/siRNA) was the optimal ratio at which the highest transfection efficiency was achieved. The trasnfection efficiency in SGC-7901/VCR cells and SGC-7901/DDP cells was 89.82% (vs 66%, 81%, 50%, 62%, 46%) and 85.62% (vs 63%, 80%, 45%, 58%, 54%), respectively (Figure 2A, 2B).
Figure 2.
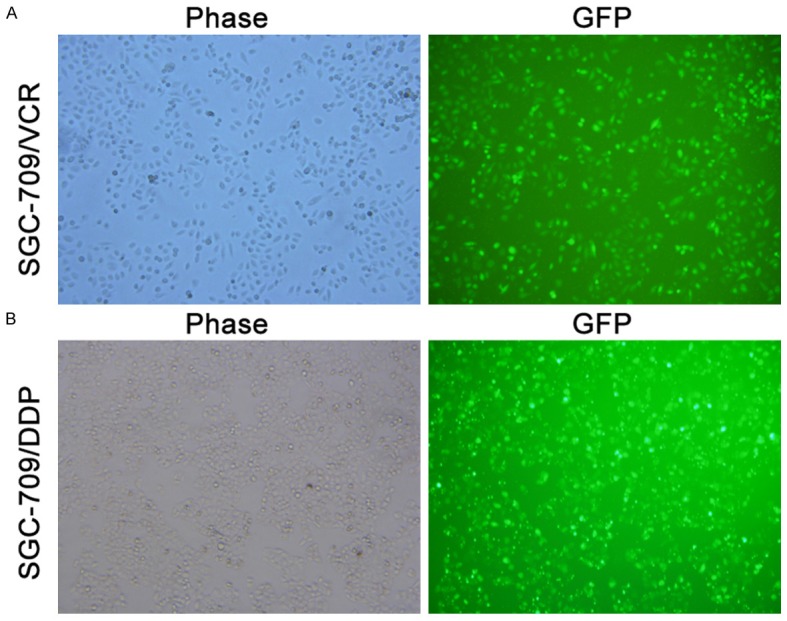
Transfection efficiency of SGC-7901/VCR cells and SGC-7901/DDP cells (×100). A. SGC-7901/VCR cells under light microscope and fluorescence microscope; B. SGC-7901/DDP cells under light microscope and fluorescence microscope.
qRT-PCR showed, in SGC-7901/VCR cells and SGC-7901/DDP cells, the GAPDH mRNA expression was significantly lower than in control group after GAPDH-siRNA transfection for 24 h, 48 h and 72 h (P<0.05) (Figure 3A, 3B). The inhibition rate of was 93.67%, 97.67% and 93.67% respectively in SGC-7901/VCR cells and 83.00%, 81.33% and 75.67%, respectively in SGC-7901/DDP cells. This confirms that the method used for cell transfection is reliable for RNAi experiment. Except in SGC-7901/VCR cells transfected with Mcl-1-siRNA 2 and SGC-7901/DDP cells transfected with Mcl-1-siRNA1 of, the mRNA and protein expressions of Mcl-1 were significantly lower than in CTRL group at 24 h, 48 h and 72 h (P<0.05) (Figure 3C-E). At 48 h, the mRNA and protein expressions of Mcl-1 were the lowest after trasnfection with Mcl-1-siRNA3, and the inhibition rate was 90.67% and 70.97%, respectively in SGC-7901/VCR cells and 89.67% and 75.69%, respectively, in SGC-7901/DDP cells (Figure 3C-E). There was no significant difference among control group, Mock group and NC group (P>0.05). Thus, transfection with Mcl-1-siRNA3 for 48 h was used in following experiment due to the best transfection efficiency.
Figure 3.

Relative Mcl-1 mRNA and protein expressions in SGC-7901/VCR cells and SGC-7901/DDP cells at different time points after transfection. GAPDH mRNA expression was significantly suppressed in SGC-7901/VCR cells (A) and SGC-7901/DDP cells (B) at 24 h, 48 h and 72 h after GAPDH-siRNA transfection (*P<0.05 vs CTRL). (C) Mcl-1 mRNA expression significantly decreased at different time points after Mcl-1-siRNAs transfection in SGC-7901/VCR cells and SGC-7901/DDP cells (*P<0.05 vs CTRL, Mock and NC groups), except at 72 h in SGC-7901/VCR-Mcl-1-siRNA2 group. (D, E) Mcl-1 protein expression significantly decreased at different time points after Mcl-1-siRNAs transfection in SGC-7901/VCR cells and SGC-7901/DDP cells, except at 72 h in SGC-7901/VCR-Mcl-1-siRNA2 group and SGC-7901/DDP-Mcl-1-siRNA1 group (*P<0.05 vs CTRL, Mock and NC groups).
Mcl-1 silencing inhibited the proliferation of SGC-7901/VCR cells and SGC-790/DDP cells
MTT assay showed the proliferation rate of SGC-7901/VCR-Mcl-1-siRNA3 cells and SGC-7901/DDP-Mcl-1-siRNA3 cells was significantly lower than that of control group at each time point (P<0.05) (Figure 4A, 4B), (especially at 48 h: 56.81% and 34.80%, respectively). It suggests that down-regulation of Mcl-1 expression by Mcl-1-siRNA3 inhibits the growth of drug-resistant GC cells in vitro. The proliferation rate was comparable among control group, Mock group and NC group (P>0.05).
Figure 4.

Proliferation (MTT assay) and cell cycle distribution (flow cytometry) of gastric cancer cells after siRNA-Mcl-1 trasnfection. The proliferation rate in Mcl-1-siRNA3 group significantly decreased at each time point in SGC-7901/VCR cells (A) and SGC-7901/DDP cells (B) (*P<0.05 vs CTRL, Mock and NC groups). (C, E) In SGC-7901/VCR cells, the proportion of cells in S phase and G2/M phase after Mcl-1-siRNA3 transfection increased significantly, but that of cells in G0/G1 phase decreases markedly (*P<0.05 vs CTRL, Mock and NC groups). (D, F) In SGC-7901/DDP cells, the proportion of cells in S phase after Mcl-1-siRNA3 transfection increased significantly, but that of cells in G0/G1 phase and G2/M phase decreased markedly (*P<0.05 vs CTRL, Mock and NC groups).
Mcl-1 silencing affected cell cycle in vitro
FCM showed that the proportion of cells in G0/G1, S and G2/M phases changed significantly in SGC-7901/VCR cells and SGC-7901/DDP cells after silencing (Figure 5). The proportion of cells in S phase and G2/M phase in SGC-7901/VCR-Mcl-1-siRNA3 cells was 1.42 times and 1.35 times higher than that in CRTL cells, respectively, and the proportion of cells in G0/G1 phase decreased markedly (P<0.05) (Figure 4C, 4E). For SGC-7901/DDP cells, the proportion of cells in S phase in SGC-7901/DDP-Mcl-1-siRNA3 cells was 1.78 times higher than that in CRTL cells, and the proportion of cells in G0/G1 phase and G2/M phase decreased markedly (P<0.05) (Figure 4D, 4F). This suggests that Mcl-1 silencing arrests SGC-7901/VCR cells in S phase and G2/M phase, and arrests SGC-7901/DDP cells in S stage.
Figure 5.

Migration and invasion abilities of SGC-7901/VCR cells and SGC-7901/DDP cells in vitro after Mcl-1 silencing. A, B, E. Cell migration assay. The number of SGC-7901/VCR cells and SGC-7901/DDP cells crossing the basement membrane significantly decreased after Mcl-1-siRNA3 transfection (*P<0.05 vs CTRL, Mock and NC groups). C, D, F. Cell invasion assay. The number of SGC-7901/VCR cells and SGC-7901/DDP cells crossing the basement membrane markedly decreased after Mcl-1-siRNA3 transfection (*P<0.05 vs CTRL, Mock and NC groups).
Mcl-1 promoted the gastric cancer cell migration and invasion in vitro
Migration assay revealed that the numbers of SGC-7901/VCR-Mcl-1-siRNA3 cells and SGC-7901/DDP-Mcl-1-siRNA3 cells crossing the membrane reduced significantly when compared with CTRL cells (133.00±11.16 vs 268.00±16.09, 155.67±16.26 vs 319.33±24.01; P<0.05) (Figure 5A, 5B, 5E), and the migration inhibition rate was 50.37% and 51.25% respectively. Invasion assay also displayed similar findings (53.67±3.79 vs 121.33±3.51, 51.00±3.00 vs 211.00±19.16; P<0.05 respectively, Figure 5C, 5D, 5F), and the invasion inhibition rate was 55.77% and 75.83% in SGC-7901/VCR-Mcl-1-siRNA3 cells and SGC-7901/DDP-Mcl-1-siRNA3 cells, respectively. In conclusion, down-regulation of Mcl-1 expression inhibits the migration and invasion abilities of SGC-7901/VCR cells and SGC-7901/DDP cells.
Mcl-1 inhibited GC cell apoptosis in vitro
FCM showed the apoptosis rate in SGC-7901/VCR-Mcl-1-siRNA3 cells and SGC-7901/DDP-Mcl-1-siRNA3 cells was significantly higher than that in CTRL group (35.63% vs 11.93%, and 41.38% vs 15.33%, respectively, P<0.05). There was no significant difference in the apoptosis rate among control group, Mock group and NC group (P>0.05) (Figure 6A-C). It suggests that Mcl-1 silencing siRNA3 promotes the apoptosis of drug-resistant GC cells.
Figure 6.

Apoptosis and apoptosis related protein expressions in gastric cancers after Mcl-1 silencing in vitro. A-C. FCM showed the apoptosis rate of SGC-7901/VCR cells and SGC-7901/DDP cells increased significantly after Mcl-1-siRNA3 transfection (*P<0.05 vs CTRL, Mock and NC groups). D. Mcl-1 expression was evidently suppressed (*P<0.05 vs CTRL, Mock and NC groups), but the Bcl-2 expression increased and survivin and Fas expressions decreased markedly (*P<0.05 vs CTRL, Mock and NC groups) in SGC-7901/VCR cells after Mcl-1-siRNA3 transfection. E. Expressions of Bcl-2 and Fas decreased significantly (*P<0.05 vs CTRL, Mock and NC) but survivin expression remained unchanged (P>0.05) in SGC-7901/DDP cells after Mcl-1-siRNA3 transfection.
We further detected the expressions of apoptosis-related proteins (Bcl-2, survivin and Fas). In SGC-7901/VCR cells, Mcl-1 silencing increased Bcl-2 expression while decreased survivin and Fas expressions (P<0.05) (Figure 6D). However, the expressions of these proteins were comparable among CRTL group, Mock and NC group (P>0.05). In SGC-7901/DDP cells, Mcl-1 silencing decreased Bcl-2 and Fas expressions (P<0.05) but the survivin expression remained unchanged (P>0.05) (Figure 6E). Moreover, the expressions of these proteins were similar among CRTL group, Mock and NC group (P>0.05).
Mcl-1 was related to the resistance to VCR, DDP and 5-Fu
The cell inhibition rate in SGC-790/VCR group and SGC-7901/DDP group was higher and higher accompanied with VCR, DDP or 5-Fu concentration increasing. When the concentration of VCR from 0.0005 μg/ml increased to 50 μg/ml, the change of inhibition rate of SGC-7901/DDP and SGC-7901/VCR cells contained: control group (0.16±0.03 to 0.54±0.02) vs (0.01±0.002 to 0.96±0.39), Mock group (0.14±0.04 to 0.52±0.002) vs (0.01±0.004 to 0.96±0.01), NC group (0.16±0.03 to 0.51±0.02) vs (0.01±0.01 to 0.96±0.002), Mcl-1-siRNA3 group (0.19±0.03 to 0.67±0.02) vs (0.15±0.03 to 0.98±0.004). Meanwhile, the concentration of DDP from 0.016 μg/ml in-creased to 50 μg/ml, the change of inhibition rate of SGC-7901/DDP and SGC-7901/VCR cells contained: control group (0.06±0.01 to 0.91±0.01) vs (0.07±0.02 to 0.81±0.02), Mock group (0.05±0.002 to 0.90±0.01) vs (0.06±0.01 to 0.80±0.01), NC group (0.06±0.01 to 0.90±0.002) vs (0.06±0.004 to 0.80±0.01), Mcl-1-siRNA3 group (0.13±0.02 to 0.94±0.01) vs (0.14±0.04 to 0.88±0.01). Moreover, the concentration of 5-Fu from 0.025 μg/ml increased to 2500 μg/ml, the change of inhibition rate of SGC-7901/DDP and SGC-7901/VCR cells contained: control group (0.08±0.01 to 0.38±0.01) vs (0.15±0.03 to 0.50±0.04), Mock group (0.07±0.004 to 0.39±0.02) vs (0.13±0.02 to 0.51±0.001), NC group (0.07±0.01 to 0.39±0.02) vs (0.14±0.02 to 0.51±0.004), Mcl-1-siRNA3 group (0.11±0.01 to 0.74±0.01) vs (0.18±0.01 to 0.76±0.01).
The cell inhibition rate in Mcl-1-siRNA3 group was markedly higher than in control group, Mock group and NC group (P<0.05). There was no significant difference in the inhibition rate among control group, Mock group and NC group (P>0.05). The IC50 of VCR, DDP and 5-Fu in SGC-7901/VCR-Mcl-1-siRNA3 group was significantly lower than in CTRL group (0.31±0.01 vs 1.60±0.27, 0.64±0.02 vs 2.59±0.44, 17.81±3.66 vs 81.93±10.42; P<0.05), and RI was 5.16, 4.05 and 4.05, respectively (Figure 7A-C). In SGC-7901/DDP cells, the IC50 of VCR, DDP and 5-Fu in SGC-7901/DDP-Mcl-1-siRNA3 cells was also significantly lower than in control group (0.20±0.04 vs 1.15±0.24, 0.58±0.04 vs 2.89±0.25 and 36.82±4.34 vs 368.55±71.71; P<0.05), and RI was 5.57, 4.98 and 10.01, respectively (Figure 7D-F). In summary, down-regulation of Mcl-1 expression by Mcl-1-siRNA3 reverses the resistance to VCR, DDP and 5-Fu in SGC-7901/VCR cells and SGC-7901/DDP cells.
Figure 7.

Drug resistance and expressions of drug resistance-related genes in SGC-7901/VCR cells and SGC-790/DDP after Mcl-1 silencing. A-C. As the drug concentrations of VCR, DDP and 5-Fu increased, the inhibition rate of SGC-790/VCR cells undergoing Mcl-1-siRNA3 transfection gradually increased (*P<0.05 vs CTRL, Mock and NC groups). D-F. As the drug concentrations of VCR, DDP and 5-Fu increased, the inhibition rate of SGC-790/DDP cells undergoing Mcl-1-siRNA3 transfection progressively increased (*P<0.05 vs CTRL, Mock and NC groups). G. In SGC-7901/VCR cells, Mcl-1 silencing significantly increased TS mRNA expression, but inhibited the DPD and TOP2A mRNA expressions (*P<0.05 vs CTRL, Mock and NC groups), while MDR1 mRNA expression remained unchanged (P>0.05). H. In SGC-7901/DDP cells, Mcl-1 silencing markedly increased TS mRNA expression, but inhibited the DPD and TOP2A mRNA expressions (*P<0.05 vs CTRL, Mock and NC groups), while MDR1 mRNA expression reduced significantly as compared to control group (ΔP<0.05).
Mcl-1 silencing affected the expressions of drug resistance-related genes
qRT-PCR revealed that Mcl-1 mRNA expression was significantly inhibited in SGC-7901/VCR-Mcl-1-siRNA3 cells and SGC-7901/DDP-Mcl-1-siRNA3 cells (P<0.05). Mcl-1 silencing significantly increased TS mRNA expression, but inhibited the DPD and TOP2A mRNA expressions (P<0.05). However, Mcl-1 silencing decreased MDR1 mRNA expression in SGC-7901/DDP cells (P<0.05), but not SGC-7901/VCR cells (P>0.05) (Figure 7G, 7H). qRT-PCR showed that the Ct value of MDR1 in CTRL group, Mock group, NC group and Mcl-1-siRNA3 group was 34.83±0.18, 34.89±0.12, 34.95±0.11 and 35.51±0.07, respectively, and the Ct value of β-actin as a control was 17.76±0.15, 17.92±0.05, 17.78±0.10 and 16.78±0.12, respectively, suggesting that MDR1 mRNA expression remained unchanged in SGC-7901/DDP cells.
Discussion
In the present study, our results confirmed Mcl-1 was over-expressed in drug-resistant GC cell lines, and Mcl-1 silencing inhibited the proliferation of SGC-7901/VCR cells and SGC-7901/DDP cells, and affected the cell cycle. Mcl-1 inhibited GC cell apoptosis and promoted their migration and invasion in vitro. Moreover, Mcl-1 affected the drug sensitivity of GC cell lines to VCR, DDP and 5-Fu and the expressions of drug resistance-related genes, which were reversed by Mcl-1 silencing expression.
Mcl-1 belongs to the anti-apoptotic members of the Bcl-2 family, and was first identified in the programmed myeloid cell differentiation [7]. Several studies have shown that Mcl-1 is not only highly expressed in the leukemia, breast cancer, lung cancer, colon cancer and stomach cancer, and other tumors [8,9], but also closely related to the drug resistance of tumors. It is also found that inhibition of Mcl-1 expression may reverse the drug resistance in a variety of tumors including leukemia [10], liver cancer [11], and ovarian cancer [12]. However, few studies have been conducted to investigate the roles of Mcl-1 in biological behaviors and drug resistance of GC. In this study, our results showed the mRNA and protein expressions of Mcl-1 in drug-resistant SGC-7901/VCR cells and SGC-7901/DDP cells were significantly higher than in their parent cells (SGC-7901 cells), which suggests that Mcl-1 is related to the drug resistance. Mcl-1-siRNA3 exhibited the highest inhibition efficiency at 48 h, and the mRNA and protein expressions of Mcl-1 were reduced by 90.67% and 90.67%, respectively, in SGC-7901/VCR cells and by 89.67% and 89.67%, respectively, in SGC-7901/DDP cells. Therefore, Mc-1-siRNA3 was used in the subsequent experiments.
Many studies have confirmed that Mcl-1 is closely related to the proliferation of tumor cells. Wacheck et al. [13] found that to inhibit Mcl-1 expression by antisense nucleic acid significantly impaired the proliferation of GC cells and promoted their apoptosis. Li et al. [14] also found that the reduction of Mcl-1 expression could inhibit the proliferation of glioma cells. Our study indicated similar findings in MTT assay: the proliferation of SGC-7901/VCR-Mcl-1-siRNA3 cells and SGC-7901/DDP-Mcl-1-siRNA3 cells reduced significantly, suggesting that Mcl-1 is able to inhibit the growth of drug-resistant GC cells.
In addition, Mcl-1 is also involved in the regulation of cell cycle [15]. Subramaniam et al. [16] concluded Mcl-1 silencing was able to block the cell cycle and Kobayashi et al. suggested that the process of mitosis had involvement of Mcl-1. The phosphorylated Mcl-1 in G2/M phase increases to exert anti-apoptotic effects [17]. In addition, Mcl-1 over-expression may arrest cells in S phase, and PCNA may regulate thos process via Mcl-1 [18]. In our study, the proportion of cells in S phase and G2/M phase increased significantly when Mcl-1 expression was inhibited in SGC-7901/VCR cells, and that of cells in S phase increased markedly in SGC-7901/DDP cells. These results were inconsistent with previous findings, which might be due to the different tumor types and chemotherapeutics.
Apoptosis is also involved in the pathogenesis of malignant tumors. Our results showed the apoptosis rate of drug-resistant GC cells after MCl-1 silencing significantly increased, suggesting that Mcl-1 silencing is able to promote the apoptosis of drug-resistant GC cells [13]. In addition, the expressions of several apoptosis-related proteins (Bcl-2, survivin and Fa) were detected to elucidate the anti-apoptotic mechanisms of Mcl-1 in drug-resistant GC cells. Of note, the changes in the expressions of these proteins were different after Mcl-1 silencing. In SGC-7901/VCR-Mcl-1-siRNA3 cells, Bcl-2 expression increased while Fas and survivin expressions reduced, but Bcl-2 and Fas expressions decreased and survivin expression remained unchanged SGC-7901/DDP-Mcl-1-siRNA3 cells.
Migration and invasion are the basic processes of metastasis in malignant tumors [19]. Koehler [20] found that Mcl-1 silencing significantly decreased the migration and invasion abilities of colon cancer cells, while its over-expression markedly increased the abilities of migration and invasion of these cells. Our results showed the migration and invasion abilities of SGC-7901/VCR cells and SGC-7901/DDP cells significantly decreased after inhibition of Mcl-1 expression, which was consistent with the results in the study of Koehler et al. [20].
There is evidence showing that Mcl-1 is associated with the drug resistance of some cancers, and silencing of Mcl-1 expression may reverse the drug resistance of these cancers to a certain extent [10-12,21-23]. Wei et al. [15] found the high Mcl-1 expression was closely related to the drug resistance of pancreatic cancer, and Mcl-1 inhibition significantly promoted the drug sensitivity of these cells to gemcitabine. Our findings also showed that, after treatment with VCR, DDP and 5-Fu at different concentrations, the inhibition rate of Mcl-1-siRNA3 group was significantly higher than in control group (P<0.05), suggesting that Mcl-1 silencing is able to reverse the resistance of SGC-7901/VCR cells and SGC-7901/DDP cells to VCR, DDP and 5-Fu to different extents. Moreover, the expressions of several resistance related proteins (MDR1, TS, DPD and Topo-IIA) were also detected in order to elucidate the mechanism of resistance reversal by Mcl-1 silencing. Our results showed the MDR1 mRNA expression in SGC-7901/VCR cells and SGC-7901/DDP cells remained unchanged after Mcl-1 silencing (P>0.05), which was supported by the findings from the studies of Wang et al. [24] and Zalcberg et al. [25] In addition, our study revealed that, in the presence reversed resistance of GC cells after Mcl-1 silencing, TS was over-expressed, but the underlying mechanism is still unclear. Previous studies mainly focus on the role of TS in resistance to 5-Fu, but not DDP and VCR. Thus, more studies are required to confirm our findings and to elucidate the potential mechanism. Furthermore, the mRNA expressions of DPD and TOP2A significantly decreased in drug-resistant GC cells after Mcl-1 silencing (P<0.05). DPD is a rate limiting enzyme in the catabolism of Uracil, and plays an important role in the metabolism of 5-Fu [26], and it is over-expressed in 5-Fu resistant colorectal cancer [27]. TOP2A is also closely related to the drug resistance of cancers [28]. Studies have confirmed that low TOP2A expression is associated with the drug resistance cancers [29,30]. However, low TOP2A expression is not observed in all the cancers [31]. Our results showed Mcl-1 silencing significantly reduced the DPD and TOP2A mRNA expressions. In summary, we speculated that DPD and TOP2A were involved in the Mcl-1-induced drug-resistance reversal of GC, but the specific molecular mechanism is still unclear, and required to be elucidated in future studies.
Taken together, siRNA mediated down-regulating of Mcl-1 expression can effectively inhibit the proliferation and abilities of migration and invasion of drug-resistant SGC-7901/VCR cells and SGC-7901/DDP cells, promote their apoptosis, and reverse their multi-drug resistance to different extents. Thus, Mcl-1 is expected to become a new target for the therapy of GC and the reversing of multi-resistance GC.
Acknowledgements
The study was supported by National Natural Science Foundation of China (81360370); Natural Science Foundation of Guangxi (2012GXNSFDA239001). The Research Project of Guangxi Health and Family Planning Commission NO. Z2015526.
Disclosure of conflict of interest
None.
References
- 1.Yecies D, Carlson NE, Deng J, Letai A. Acquired resistance to ABT-737 in lymphoma cells that up-regulate MCL-1 and BFL-1. Blood. 2010;115:3304–3313. doi: 10.1182/blood-2009-07-233304. [DOI] [PMC free article] [PubMed] [Google Scholar]
- 2.Li G, Zhang S, Fang H, Yan B, Zhao Y, Feng L, Ma X, Ye X. Aspirin overcomes Navitoclaxresistance in hepatocellular carcinoma cells through suppression of Mcl-1. Biochem Biophys Res Commun. 2013;434:809–814. doi: 10.1016/j.bbrc.2013.04.018. [DOI] [PubMed] [Google Scholar]
- 3.Akagi H, Higuchi H, Sumimoto H, Igarashi T, Kabashima A, Mizuguchi H, Izumiya M, Sakai G, Adachi M, Funakoshi S, Nakamura S, Hamamoto Y, Kanai T, Takaishi H, Kawakami Y, Hibi T. Suppression of myeloid cell leukemia-1 (Mcl-1) enhances chemotherapy-associated apoptosis in gastric cancer cells. Gastric Cancer. 2013;16:100–110. doi: 10.1007/s10120-012-0153-6. [DOI] [PubMed] [Google Scholar]
- 4.Wurst M, Robles A, Po J, Luu VD, Brems S, Marentije M, Stoitsova S, Quijada L, Hoheisel J, Stewart M, Hartmann C, Clayton C. An RNAi screen of the RRM-domain proteins of Trypanosoma brucei. Mol Biochem Parasitol. 2009;163:61–65. doi: 10.1016/j.molbiopara.2008.09.001. [DOI] [PubMed] [Google Scholar]
- 5.Davidson BL, McCray PB Jr. Current prospects for RNA interference-based therapies. Nat Rev Genet. 2011;12:329–340. doi: 10.1038/nrg2968. [DOI] [PMC free article] [PubMed] [Google Scholar]
- 6.Pecot CV, Calin GA, Coleman RL, Lopez-Berestein G, Sood AK. RNA interference in the clinic: challenges and future directions. Nat Rev Cancer. 2011;11:59–67. doi: 10.1038/nrc2966. [DOI] [PMC free article] [PubMed] [Google Scholar]
- 7.Kozopas KM, Yang T, Buchan HL, Zhou P, Craig RW. MCL1, a gene expressed in programmed myeloid cell differentiation, has sequence similarity to BCL2. Proc Natl Acad Sci U S A. 1993;90:3516–3520. doi: 10.1073/pnas.90.8.3516. [DOI] [PMC free article] [PubMed] [Google Scholar]
- 8.Placzek WJ, Wei J, Kitada S, Zhai D, Reed JC, Pellecchia M. A survey of the anti-apoptotic Bcl-2 subfamily expression in cancer types provides a platform to predict the efficacy of Bcl-2 antagonists in cancer therapy. Cell Death Dis. 2010;1:e40. doi: 10.1038/cddis.2010.18. [DOI] [PMC free article] [PubMed] [Google Scholar]
- 9.Likui W, Qun L, Wanqing Z, Haifeng S, Fangqiu L, Xiaojun L. Prognostic role of myeloid cell leukemia-1 protein (Mcl-1) expression in human gastric cancer. J Surg Oncol. 2009;100:396–400. doi: 10.1002/jso.21344. [DOI] [PubMed] [Google Scholar]
- 10.Russo M, Spagnuolo C, Volpe S, Tedesco I, Bilotto S, Russo GL. ABT-737 resistance in B-cells isolated from chronic lymphocytic leukemia patients and leukemia cell lines is overcome by the pleiotropic kinase inhibitor quercetin through Mcl-1 down-regulation. Biochem Pharmacol. 2013;85:927–936. doi: 10.1016/j.bcp.2013.01.011. [DOI] [PubMed] [Google Scholar]
- 11.Liao M, Zhao J, Wang T, Duan J, Zhang Y, Deng X. Role of bile salt in regulating Mcl-1 phosphorylation and chemoresistance in hepatocellular carcinoma cells. Mol Cancer. 2011;10:44. doi: 10.1186/1476-4598-10-44. [DOI] [PMC free article] [PubMed] [Google Scholar]
- 12.Duan Z, Ames RY, Ryan M, Hornicek FJ, Mankin H, Seiden MV. CDDO-Me, a synthetic triterpenoid, inhibits expression of IL-6 and Stat3 phosphorylation in multi-drug resistant ovarian cancer cells. Cancer Chemother Pharmacol. 2009;63:681–689. doi: 10.1007/s00280-008-0785-8. [DOI] [PMC free article] [PubMed] [Google Scholar]
- 13.Wacheck V, Cejka D, Sieghart W, Losert D, Strommer S, Crevenna R, Monia BP, Selzer E. Mcl-1 is a relevant molecular target for antisense oligonucleotide strategies in gastric cancer cells. Cancer Biol Ther. 2006;5:1348–1354. doi: 10.4161/cbt.5.10.3224. [DOI] [PubMed] [Google Scholar]
- 14.Li RY, Chen LC, Zhang HY, Du WZ, Feng Y, Wang HB, Wen JQ, Liu X, Li XF, Sun Y, Yang DB, Jiang T, Li YL, Jiang CL. MiR-139 inhibits Mcl-1 expression and potentiates TMZ-induced apoptosis in glioma. CNS Neurosci Ther. 2013;19:477–483. doi: 10.1111/cns.12089. [DOI] [PMC free article] [PubMed] [Google Scholar]
- 15.Wei SH, Dong K, Lin F, Wang X, Li B, Shen JJ, Zhang Q, Wang R, Zhang HZ. Inducing apoptosis and enhancing chemosensitivity to gemcitabine via RNA interference targeting Mcl-1 gene in pancreatic carcinoma cell. Cancer Chemother Pharmacol. 2008;62:1055–1064. doi: 10.1007/s00280-008-0697-7. [DOI] [PubMed] [Google Scholar]
- 16.Subramaniam D, Natarajan G, Ramalingam S, Ramachandran I, May R, Queimado L, Houchen CW, Anant S. Translation inhibition during cell cycle arrest and apoptosis: Mcl-1 is a novel target for RNA binding protein CUGBP2. Am J Physiol Gastrointest Liver Physiol. 2008;294:G1025–1032. doi: 10.1152/ajpgi.00602.2007. [DOI] [PubMed] [Google Scholar]
- 17.Kobayashi S, Lee SH, Meng XW, Mott JL, Bronk SF, Werneburg NW, Craig RW, Kaufmann SH, Gores GJ. Serine 64 phosphorylation enhances the antiapoptotic function of Mcl-1. J Biol Chem. 2007;282:18407–18417. doi: 10.1074/jbc.M610010200. [DOI] [PubMed] [Google Scholar]
- 18.Fujise K, Zhang D, Liu J, Yeh ET. Regulation of apoptosis and cell cycle progression by MCL1. Differential role of proliferating cell nuclear antigen. J Biol Chem. 2000;275:39458–39465. doi: 10.1074/jbc.M006626200. [DOI] [PubMed] [Google Scholar]
- 19.Alderton GK. Metastasis: Epithelial to mesenchymal and back again. Nat Rev Cancer. 2013;13:3. doi: 10.1038/nrc3428. [DOI] [PubMed] [Google Scholar]
- 20.Koehler BC, Scherr AL, Lorenz S, Urbanik T, Kautz N, Elssner C, Welte S, Bermejo JL, Jager D, Schulze-Bergkamen H. Beyond cell death-antiapoptotic Bcl-2 proteins regulate migration and invasion of colorectal cancer cells in vitro. PLoS One. 2013;8:e76446. doi: 10.1371/journal.pone.0076446. [DOI] [PMC free article] [PubMed] [Google Scholar]
- 21.Fleischer B, Schulze-Bergkamen H, Schuchmann M, Weber A, Biesterfeld S, Muller M, Krammer PH, Galle PR. Mcl-1 is an antiapoptotic factor for human hepatocellular carcinoma. Int J Oncol. 2006;28:25–32. [PubMed] [Google Scholar]
- 22.Schwickart M, Huang X, Lill JR, Liu J, Ferrando R, French DM, Maecker H, O’Rourke K, Bazan F, Eastham-Anderson J, Yue P, Dornan D, Huang DC, Dixit VM. Deubiquitinase USP9X stabilizes MCL1 and promotes tumour cell survival. Nature. 2010;463:103–107. doi: 10.1038/nature08646. [DOI] [PubMed] [Google Scholar]
- 23.Lincet H, Kafara P, Giffard F, Abeilard-Lemoisson E, Duval M, Louis MH, Poulain L, Icard P. Inhibition of Mcl-1 expression by citrate enhances the effect of Bcl-xL inhibitors on human ovarian carcinoma cells. J Ovarian Res. 2013;6:72. doi: 10.1186/1757-2215-6-72. [DOI] [PMC free article] [PubMed] [Google Scholar]
- 24.Wang TH, Wan JY, Gong X, Li HZ, Cheng Y. Tetrandrine enhances cytotoxicity of cisplatin in human drug-resistant esophageal squamous carcinoma cells by inhibition of multidrug resistance-associated protein 1. Oncol Rep. 2012;28:1681–1686. doi: 10.3892/or.2012.1999. [DOI] [PubMed] [Google Scholar]
- 25.Zalcberg J, Hu XF, Slater A, Parisot J, El-Osta S, Kantharidis P, Chou ST, Parkin JD. MRP1 not MDR1 gene expression is the predominant mechanism of acquired multidrug resistance in two prostate carcinoma cell lines. Prostate Cancer Prostatic Dis. 2000;3:66–75. doi: 10.1038/sj.pcan.4500394. [DOI] [PubMed] [Google Scholar]
- 26.Offer SM, Butterfield GL, Jerde CR, Fossum CC, Wegner NJ, Diasio RB. microRNAs miR-27a and miR-27b directly regulate liver dihydropyrimidine dehydrogenase expression through two conserved binding sites. Mol Cancer Ther. 2014;13:742–751. doi: 10.1158/1535-7163.MCT-13-0878. [DOI] [PMC free article] [PubMed] [Google Scholar]
- 27.Salonga D, Danenberg KD, Johnson M, Metzger R, Groshen S, Tsao-Wei DD, Lenz HJ, Leichman CG, Leichman L, Diasio RB, Danenberg PV. Colorectal tumors responding to 5-fluorouracil have low gene expression levels of dihydropyrimidine dehydrogenase, thymidylate synthase, and thymidine phosphorylase. Clin Cancer Res. 2000;6:1322–1327. [PubMed] [Google Scholar]
- 28.Wang J, Song Y, Xu S, Zhang Q, Li Y, Tang D, Jin S. Down-regulation of ICBP90 contributes to doxorubicin resistance. Eur J Pharmacol. 2011;656:33–38. doi: 10.1016/j.ejphar.2011.01.042. [DOI] [PubMed] [Google Scholar]
- 29.Harris AL, Hochhauser D. Mechanisms of multidrug resistance in cancer treatment. Acta Oncol. 1992;31:205–213. doi: 10.3109/02841869209088904. [DOI] [PubMed] [Google Scholar]
- 30.Arpino G, Ciocca DR, Weiss H, Allred DC, Daguerre P, Vargas-Roig L, Leuzzi M, Gago F, Elledge R, Mohsin SK. Predictive value of apoptosis, proliferation, HER-2, and topoisomerase IIalpha for anthracycline chemotherapy in locally advanced breast cancer. Breast Cancer Res Treat. 2005;92:69–75. doi: 10.1007/s10549-005-1721-9. [DOI] [PubMed] [Google Scholar]
- 31.Qi XC, Xie DJ, Yan QF, Wang YR, Zhu YX, Qian C, Yang SX. LRIG1 dictates the chemo-sensitivity of temozolomide (TMZ) in U251 glioblastoma cells via down-regulation of EGFR/topoisomerase-2/Bcl-2. Biochem Biophys Res Commun. 2013;437:565–572. doi: 10.1016/j.bbrc.2013.06.116. [DOI] [PubMed] [Google Scholar]