JAK2 exon 12 mutations are associated with more marked and isolated erythrocytosis than JAK2V617F. We analyzed expression profiles of JAK2 exon 12-mutant and wild-type erythroid colonies from patients with polycythemia vera (PV). Exon 12 mutations were associated with interferon-target gene upregulation, STAT1 activation and additional gene expression changes that were quantitatively and qualitatively similar to those in JAK2V617F-heterozygous cells from essential thrombocythemia (ET) patients. These results demonstrate that JAK2 exon 12-mutated PV does not reflect attenuated STAT1 signaling, and that transcriptional consequences of JAK2 mutations are remarkably similar in JAK2 exon 12-mutated PV and JAK2V617F-positive ET.
JAK2 exon 12 mutations are found in most patients with JAK2V617F-negative PV,1,2 but unlike JAK2V617F, have never been reported in ET. Compared to PV patients with JAK2V617F, patients with exon 12 mutations have higher hemoglobin concentrations, lower white cell and platelet counts, and isolated bone marrow erythroid hyperplasia.1,3 Similar phenotypic differences were seen between retroviral murine bone marrow transplantation models carrying exon 12 mutant and V617F alleles.1 These differences raise the question of how the signaling consequences of JAK2V617F and exon 12 mutations differ.
Exon 12 mutations, like V617F, are associated with constitutive, erythropoietin-independent activation of JAK2, STAT5 and ERK1/2.1 Overexpression experiments in some,1 but not other,4 cell lines suggested that these mutations might be associated with more marked activation of JAK2 than V617F. The concept that the pronounced PV phenotype associated with exon 12 mutations may reflect the strength of JAK2 activation is also consistent with evidence that JAK2V617F homozygosity results in a PV (rather than ET) phenotype.5,6 However, the signaling consequences of exon 12-mutant JAK2 have not been examined in patient cells. Moreover, the observations that JAK2V617F-heterozygous cells from PV patients show attenuated STAT1 activation compared to those with ET,7 and that impaired STAT1 signaling can contribute to a PV phenotype,7,8 raise the question of whether reduced STAT1 activation is a feature of exon 12-mutated PV. We therefore studied the transcriptional signature of exon 12 mutations in erythroid colonies from PV patients.
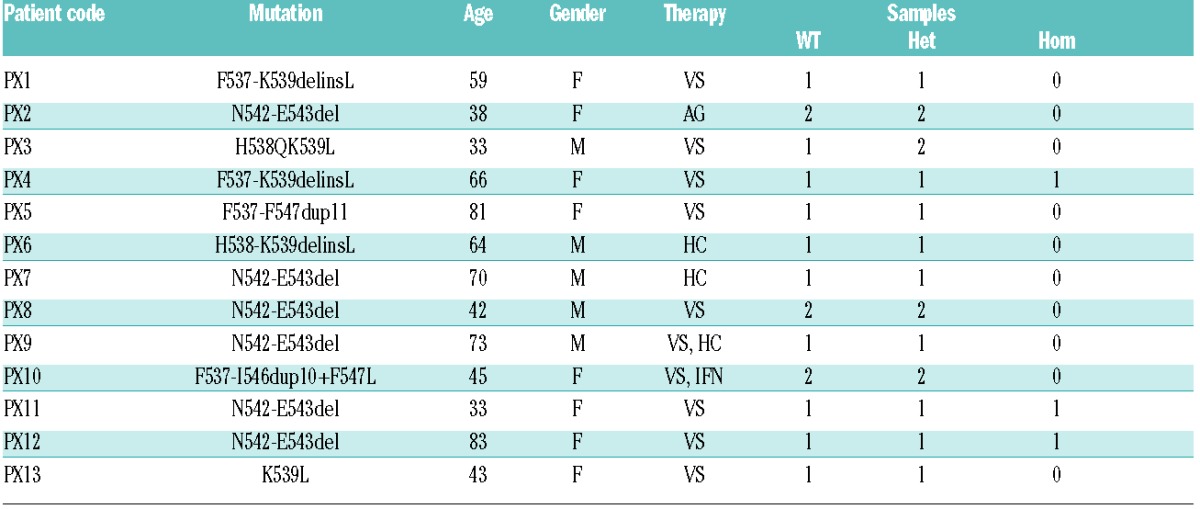
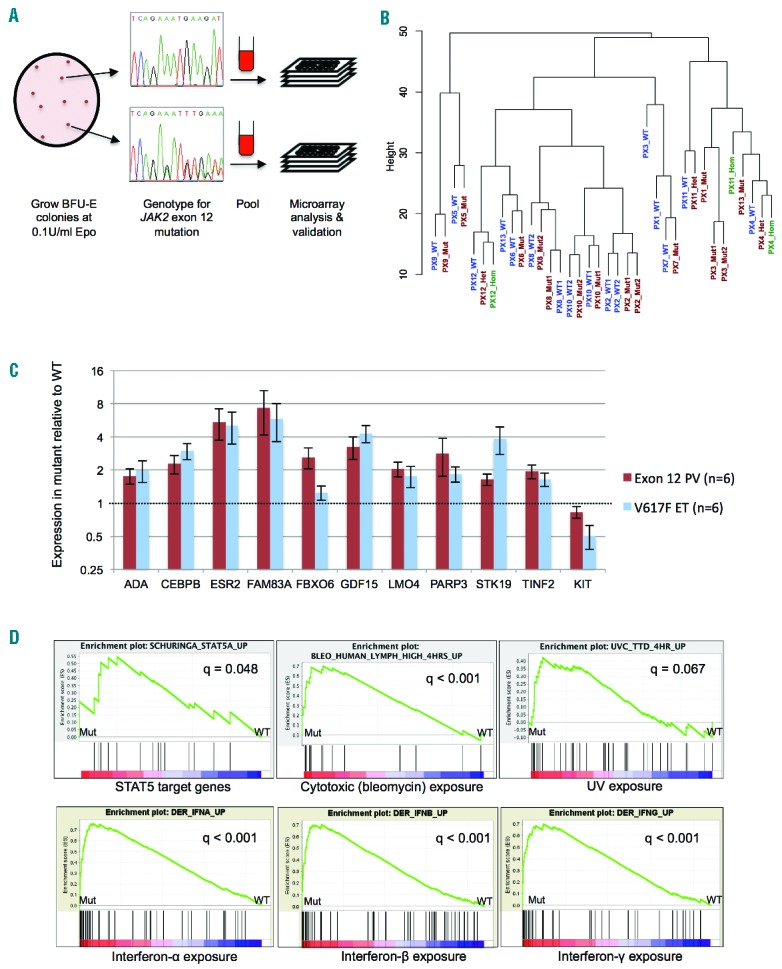
Patients were recruited from seven centers (Online Supplementary Appendix) and met British Committee for Standards in Haematology diagnostic criteria; for clinical features see Table 1 and Online Supplementary Table S1. For 13 patients with JAK2 exon 12-mutated PV, we compared genome-wide RNA profiles of JAK2-mutant and wild-type erythroid colonies grown from a single patient in the same culture plate (Figure 1A). This paired approach controls for factors including age, gender, treatment, germline genetic background and experimental conditions.7 BFU-E colonies were cultured from peripheral blood as previously described5 using 0.1 U/mL erythropoietin (at which concentration known JAK2-target genes show differential expression between wild-type and JAK2-mutant cells7). Colonies were pooled by genotype and RNA analyzed using Illumina Human-12 v.4.0 Expression BeadChips (Online Supplementary Appendix). Unsupervised clustering of global expression profiles showed that mutant colonies were generally most similar to wild-type colonies from the same patient (Figure 1B), demonstrating that the transcriptional changes associated with JAK2 exon 12 mutations are subtle. These data confirm the importance of comparing mutant and wild-type colonies from the same patient to control for inter-individual variation in gene expression.
Table 1.
Samples from JAK2 exon 12-mutated PV patients used for microarray analysis.

Figure 1.

Identification of transcriptional changes in JAK2 exon 12-mutant erythroid cells by clonal analysis. (A) Strategy for sample collection and processing. BFU-E colonies were grown in methylcellulose medium at 0.1 U/mL erythropoietin for 14–16 days, plucked and genotyped for JAK2 exon 12 mutations. Colonies were pooled by genotype and processed for RNA extraction, microarray analysis and validation. JAK2-mutant and wild-type colonies showed no consistent differences in macroscopic or cytological morphology, or in differentiation stages as assessed by flow cytometry for CD71 and GpA (data not shown). (B) Unsupervised hierarchical clustering of microarray datasets from wild-type and mutant colonies for 13 patients with JAK2 exon 12 mutations, performed using the lumi package in R. See Table 1 for patient codes. Wild-type and heterozygous-mutant samples are denoted WT and Mut; where wild-type, heterozygous- and homozygous-mutant samples were analyzed, these are denoted WT, Het and Hom, respectively. Where duplicates were analyzed for a genotype these are denoted WT1/WT2 or Mut1/Mut2. (C) Expression levels of 11 genes, measured in cDNA from BFU-E colonies from PV patients with JAK2 exon 12-heterozygous colonies and ET patients with JAK2V617F-heterozygous colonies by Fluidigm real-time PCR. Colonies were grown at 0.1 U/mL erythropoietin. Data were normalized to a house-keeping gene (HPRT1) and expressed as fold change between expression in mutant and wild-type samples. Histograms show mean +/− SEM. There were no significant differences between fold changes in the JAK2 exon 12-mutant PV and JAK2V617F-positive ET samples (Student’s t test, P>0.05 all genes). (D) Sample GSEA plots and q values for gene sets where stimuli showed a positive association with mutant samples. In the whole analysis, 15 gene sets indicated an association of the mutant genotype with interferon treatment, 13 with viral infection, 13 with treatment with cytotoxic agents and 3 with UV exposure (Online Supplementary Table S3). These include gene sets up-regulated by the stimulus that were enriched in mutant samples and gene sets down-regulated by the stimulus that were enriched in wild-type samples.
Most patients with JAK2V617F-positive PV harbor large homozygous-mutant erythroid clones. By contrast, erythroid colonies from patients with JAK2V617F-positive ET and exon 12-mutant PV are predominantly heterozygous-mutant.5 Despite this similarity, patients with exon 12-mutant PV and JAK2V617F-positive ET show markedly different clinical phenotypes. We therefore focused on these two groups of patients to investigate the signaling differences responsible for these phenotypes. We initially analyzed the transcriptional consequences of exon 12 mutations. Using a pairwise analysis, 66 genes showed differential expression between JAK2 exon 12-mutant and wild-type samples (46 genes up-regulated, 20 genes down-regulated in mutant samples; q<0.1, fold change ≥1.25; Online Supplementary Table S2). Eleven genes were selected for validation based on possible roles in hematopoiesis, cell cycle or other processes relevant to neoplasia (ADA, CEBPB, ESR2, FAM83A, FBXO6, GDF15, LMO4, PARP3, STK19, TINF2, KIT; for references see Online Supplementary Appendix). Real-time PCR using the Fluidigm BioMark system (Fluidigm, CA, USA) (Online Supplementary Appendix) confirmed differential expression for all 11 genes (Figure 1C). Interestingly, when the expression changes in JAK2 exon 12-heterozygous colonies from 6 PV patients were compared with those in JAK2V617F-heterozygous colonies from 6 ET patients, there were no significant differences in the fold changes associated with the two mutation types for any of these 11 genes (Figure 1C). Moreover, an additional 15 of the genes showing differential expression in exon 12-mutant colonies in the microarray analysis (10 up-regulated, 5 down-regulated) were also identified in an analysis of published microarray datasets from JAK2V617F-heterozygous colonies7 (Online Supplementary Table S2). These findings demonstrate that the transcriptional changes associated with JAK2V617F and JAK2 exon 12 mutations in human erythroblasts are remarkably similar, with no differences in quantitative or qualitative expression detected between the mutations in validation experiments.
We next investigated the pathways perturbed in JAK2 exon 12-mutant erythroid cells using Gene Set Enrichment Analysis (GSEA).9 Seventy-four gene sets showed enrichment in mutant samples and 83 gene sets in wild-type samples (q<0.1) (Online Supplementary Table S3). Mutant samples showed enrichment for STAT5 targets (Figure 1D), indicating, as expected, that JAK2 exon 12 mutations are associated with STAT5 activation in erythroblasts. The most frequent gene sets showing association with mutant samples were those for interferon (IFN) treatment (15 gene sets), viral infection (13 gene sets), cytotoxic agents (13 gene sets), UV exposure (3 gene sets) and p53/p21 target genes (3 gene sets) (Figure 1D and Online Supplementary Table S3). Similar observations have been made in JAK2V617F-heterozygous cells from ET patients: upregulation of IFN target genes was associated with STAT1 activation7 and upregulation of genes induced by cytotoxics, UV exposure or DNA damage was associated with DNA replication stress in JAK2V617F-positive cells.10 Overall, 77 of the 157 enriched gene sets from the exon 12 analysis were also identified in a GSEA of datasets from JAK2V617F-heterozygous samples7 (Online Supplementary Table S3), confirming that exon 12 and V617F mutations cause upregulation of similar pathways in erythroblasts.
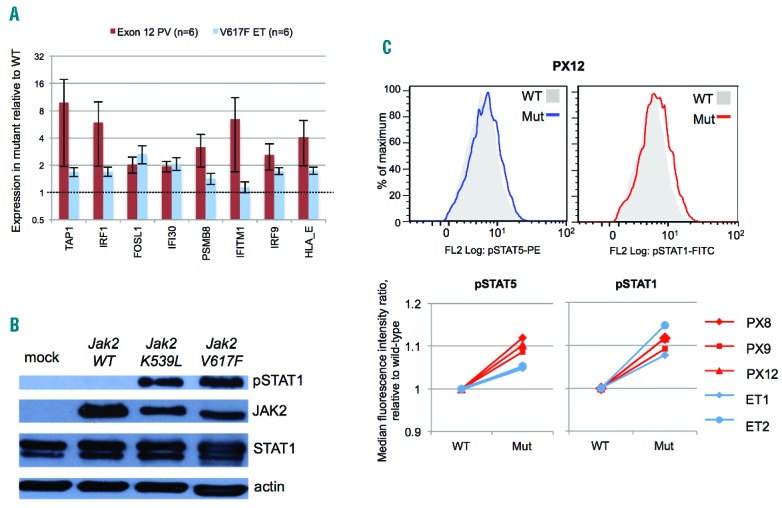
The striking enrichment for IFN-related gene sets in JAK2 exon 12-mutant cells (Figure 1D) was of particular significance. JAK2 exon 12 mutations are associated with an extreme PV phenotype (marked erythrocytosis, minimal thrombocytosis).1,3 However, we previously showed that JAK2V617F-mediated activation of STAT1, which is preserved in JAK2V617F-mutant erythroblasts of patients with ET, is impaired in those with JAK2V617F-positive PV.7 Moreover, functional experiments in human cells7 and transgenic mice8 suggested that attenuated activation of STAT1, which acts downstream of the IFNγ receptor and JAK2, might contribute to the more pronounced erythrocytosis in PV compared to ET. Upregulation of eight IFNγ-inducible genes11 was validated by real-time PCR in colonies from 6 JAK2 exon 12-mutant PV patients and 6 JAK2V617F-positive ET patients (Figure 2A). Although fold changes were variable amongst the exon 12-mutant patients (perhaps reflecting signaling variation between different mutations), they were at least as large as those in JAK2V617F-positive samples. These data demonstrate that interferon target genes are upregulated in JAK2 exon 12-heterozygous erythroblasts to a similar extent as that in JAK2V617F-heterozygous cells from ET patients.
Figure 2.

STAT1 activation in association with JAK2 exon 12 mutations. (A) Expression levels of 8 IFNγ target genes11 measured in cDNA from BFU-E colonies from polycythemia vera (PV) patients with JAK2 exon 12-heterozygous colonies and essential thrombocythemia (ET) patients with JAK2V617F-heterozygous colonies, using Fluidigm real-time PCR. Colonies were all grown at 0.1 U/mL erythropoietin. Data were normalized to a housekeeping gene (HPRT1) and expressed as fold change between expression in mutant and wild-type samples. Histograms show mean +/− SEM. (B) Western immunoblot analyses for phos-pho-STAT1 (tyrosine-701) of JAK2-null γ2A cells mock transfected or transfected with expression vectors for murine wild-type Jak2, Jak2K539L or Jak2V617F. The experiment was performed twice and representative results are shown. (C) Intracellular flow cytometry for phospho-STAT5 (pSTAT5, tyrosine-694) and phos-pho-STAT1 (pSTAT1, tyrosine-701) in BFU-E colonies. Colonies were pooled by genotype and erythroblasts gated on forward scatter and side scatter. Histograms for wild-type and mutant colonies are shown for pSTAT5 (left) and pSTAT1 (right) for patient PX12 (upper panel). Median fluorescence intensity ratios (relative to wild-type) for 3 patients with JAK2 exon 12-mutated PV (red) and 2 with JAK2V617F-positive ET (blue) are summarized in the panels below.
We next asked whether upregulation of IFN target genes in JAK2 exon 12-mutant cells reflects STAT1 activation. Expression of either Jak2K539L or Jak2V617F in JAK2-null γ2A cells (Online Supplementary Appendix) was associated with marked phospho-STAT1 activation compared to wild-type Jak2 (Figure 2B). To investigate whether STAT1 activation also occurs in human erythroid cells, erythroid colonies from 3 exon 12-mutated PV patients and 2 JAK2V617F-positive ET patients were analyzed by intracellular flow cytometry (Online Supplementary Appendix). All patients showed small but consistent increases in phospho-STAT5 and phospho-STAT1 expression in mutant compared to wild-type cells, which were similar in magnitude between JAK2 exon 12-mutated PV and JAK2V617F-positive ET samples (Figure 2C). The changes were modest, which is in keeping with previous studies using phosFlow to measure pSTAT changes in JAK2-mutant primary cells.12 These data demonstrate that JAK2 exon 12 mutations are associated with STAT1 activation in human erythroid cells, to a similar extent to that induced by JAK2V617F in ET. Although impairment of mutant JAK2-induced STAT1 activation was previously observed in JAK2V617F-positive PV,7 this impairment is not necessary for a marked erythrocytosis, nor does it account for this phenotype in JAK2 exon 12-mutated PV.
In summary, we find the transcriptional consequences of JAK2 exon 12 mutations in clonal erythroblasts from PV patients to be indistinguishable from those of heterozygous JAK2V617F in ET. In contrast to JAK2V617F-positive PV, patients with exon 12 mutations show no evidence of attenuated STAT1 activation, demonstrating that this impairment is not necessary for an erythrocytosis. There is now evidence that other mechanisms, such as JAK2V617F homozygosity, additional mutations, mutational order and constitutional factors may contribute to the phenotype of JAK2V617F-positive PV.6,13–15 STAT1 activation has been associated with enhanced megakaryopoiesis and may contribute to the thrombocytosis observed in 20% of patients with exon 12 mutations,3 whilst absence of thrombocytosis in others may reflect STAT1-independent mechanisms such as accelerated platelet destruction.6 Taken together our data support the concept that the development of a PV or ET phenotype reflects combinations of mechanisms that operate differently between individuals, and that, furthermore, these mechanisms differ between classes of JAK2 mutation.
Acknowledgments
We thank Cambridge Blood and Stem Cell Bank for sample collection and the microarray facility of Wellcome Trust Sanger Institute, Hinxton, Cambridge, UK, for assistance with microarrays.
Footnotes
Funding: the work was supported by Leukemia and Lymphoma Research, Wellcome Trust, Medical Research Council, Kay Kendall Leukaemia Fund, Cambridge NIHR Biomedical Research Center, Cambridge Experimental Cancer Medicine Centre, Leukemia and Lymphoma Society of America and Associazione Italiana per la Ricerca sul Cancro (AIRC, Milano; Progetto AGIMM, #1005).
Information on authorship, contributions, and financial & other disclosures was provided by the authors and is available with the online version of this article at www.haematologica.org.
References
- 1.Scott LM, Tong W, Levine RL, et al. JAK2 exon 12 mutations in polycythemia vera and idiopathic erythrocytosis. N Engl J Med. 2007;356(5):459–468. [DOI] [PMC free article] [PubMed] [Google Scholar]
- 2.Scott LM, Beer PA, Bench AJ, Erber WN, Green AR. Prevalance of JAK2 V617F and exon 12 mutations in polycythaemia vera. Br J Haematol. 2007;139(3):511–512. [DOI] [PubMed] [Google Scholar]
- 3.Passamonti F, Elena C, Schnittger S, et al. Molecular and clinical features of the myeloproliferative neoplasm associated with JAK2 exon 12 mutations. Blood. 2011;117(10):2813–2816. [DOI] [PubMed] [Google Scholar]
- 4.Gnanasambandan K, Magis AT, Sayeski PP. A shift in the salt bridge interaction of residues D620 and E621 mediates the constitutive activation of Jak2-H538Q/K539L. Mol Cell Biochem. 2012;367(1–2):125–140. [DOI] [PubMed] [Google Scholar]
- 5.Godfrey AL, Chen E, Pagano F, et al. JAK2V617F homozygosity arises commonly and recurrently in PV and ET, but PV is characterized by expansion of a dominant homozygous subclone. Blood. 2012; 120(13):2704–2707. [DOI] [PMC free article] [PubMed] [Google Scholar]
- 6.Li J, Kent DG, Godfrey AL, et al. JAK2V617F-homozygosity drives a phenotypic switch between myeloproliferative neoplasms, but is insufficient to sustain disease. Blood. 2014;123(20)3139–3151 [DOI] [PubMed] [Google Scholar]
- 7.Chen E, Beer PA, Godfrey AL, et al. Distinct clinical phenotypes associated with JAK2V617F reflect differential STAT1 signaling. Cancer Cell. 2010;18(5):524–535. [DOI] [PMC free article] [PubMed] [Google Scholar]
- 8.Duek A, Lundberg P, Shimizu T, et al. Loss of Stat1 decreases megakaryopoiesis and favors erythropoiesis in a JAK2-V617F-driven mouse model of MPNs. Blood. 2014;123(25):3943–3950. [DOI] [PubMed] [Google Scholar]
- 9.Subramanian A, Tamayo P, Mootha VK, et al. Gene set enrichment analysis: a knowledge-based approach for interpreting genome-wide expression profiles. Proc Natl Acad Sci USA. 2005;102(43):15545–15550. [DOI] [PMC free article] [PubMed] [Google Scholar]
- 10.Chen E, Ahn JS, Massie CE, et al. JAK2V617F promotes replication fork stalling with disease-restricted impairment of the intra-S checkpoint response. Proc Natl Acad Sci USA. 2014;111(42):15190–15195. [DOI] [PMC free article] [PubMed] [Google Scholar]
- 11.Der SD, Zhou A, Williams BR, Silverman RH. Identification of genes differentially regulated by interferon alpha, beta, or gamma using oligonucleotide arrays. Proc Natl Acad Sci USA. 1998;95(26):15623–15628. [DOI] [PMC free article] [PubMed] [Google Scholar]
- 12.Anand S, Stedham F, Gudgin E, et al. Increased basal intracellular signaling patterns do not correlate with JAK2 genotype in human myeloproliferative neoplasms. Blood. 2011;118(6):1610–1621. [DOI] [PubMed] [Google Scholar]
- 13.Jutzi JS, Bogeska R, Nikoloski G, et al. MPN patients harbor recurrent truncating mutations in transcription factor NF-E2. J Exp Med. 2013;210(5):1003–1019. [DOI] [PMC free article] [PubMed] [Google Scholar]
- 14.Tapper W, Jones AV, Kralovics R, et al. Genetic variation at MECOM, TERT, JAK2 and HBS1L-MYB predisposes to myeloproliferative neoplasms. Nat Commun. 2015;6:6691. [DOI] [PMC free article] [PubMed] [Google Scholar]
- 15.Ortmann CA, Kent DG, Nangalia J, et al. Effect of mutation order on myeloproliferative neoplasms. N Engl J Med. 2015;372(7):601–612. [DOI] [PMC free article] [PubMed] [Google Scholar]


