Abstract
DNase I hypersensitive sites (DHSs) provide important information on the presence of transcriptional regulatory elements and the state of chromatin in mammalian cells1–3. Conventional DNase-Seq for genome-wide DHSs profiling is limited by the requirement of millions of cells4,5. Here we report an ultrasensitive strategy, called Pico-Seq, for detection of genome-wide DHSs in single cells. We show that DHS patterns at the single cell level are highly reproducible among individual cells. Among different single cells, highly expressed gene promoters and the enhancers associated with multiple active histone modifications display constitutive DHS while chromatin regions with fewer histone modifications exhibit high variation of DHS. Furthermore, the single-cell DHSs predict enhancers that regulate cell-specific gene expression programs and the cell-to-cell variations of DHS are predictive of gene expression. Finally, we apply Pico-Seq to pools of tumor cells and pools of normal cells, dissected from formalin-fixed paraffin-embedded (FFPE) tissue slides from thyroid cancer patients, and detect thousands of tumor-specific DHSs. Many of these DHSs are associated with promoters and enhancers critically involved in cancer development. Analysis of the DHS sequences uncovers one single-nucleotide variant (chr18:52417839 G>C) in the tumor cells of a follicular thyroid carcinoma patient, which affects the binding of the tumor suppressor protein p53 and correlates with decreased expression of its target gene TXNL1. In conclusion, Pico-Seq can reliably detect DHSs in single cells, greatly extending the range of applications of DHS analysis for both basic and translational research and may provide critical information for personalized medicine.
Keywords: DNase-Seq, single-cell DNase-Seq, chromatin accessibility, FFPE patient tissues, regulatory elements, Pico-Seq
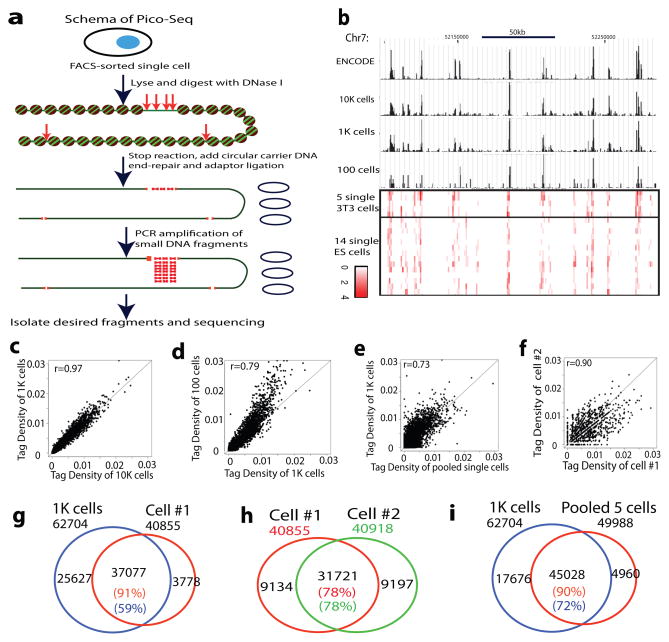
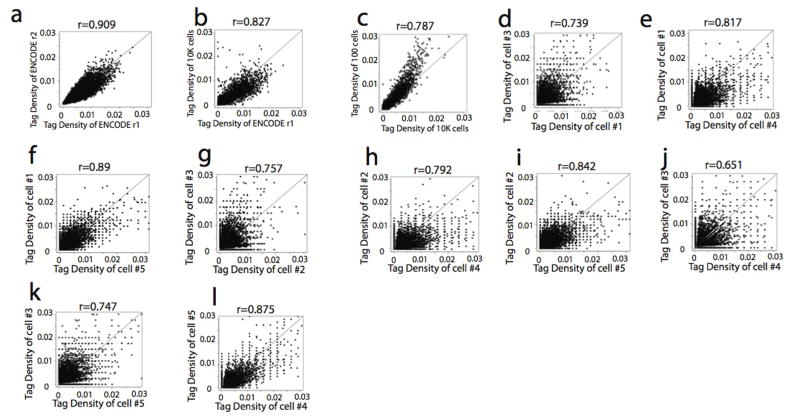
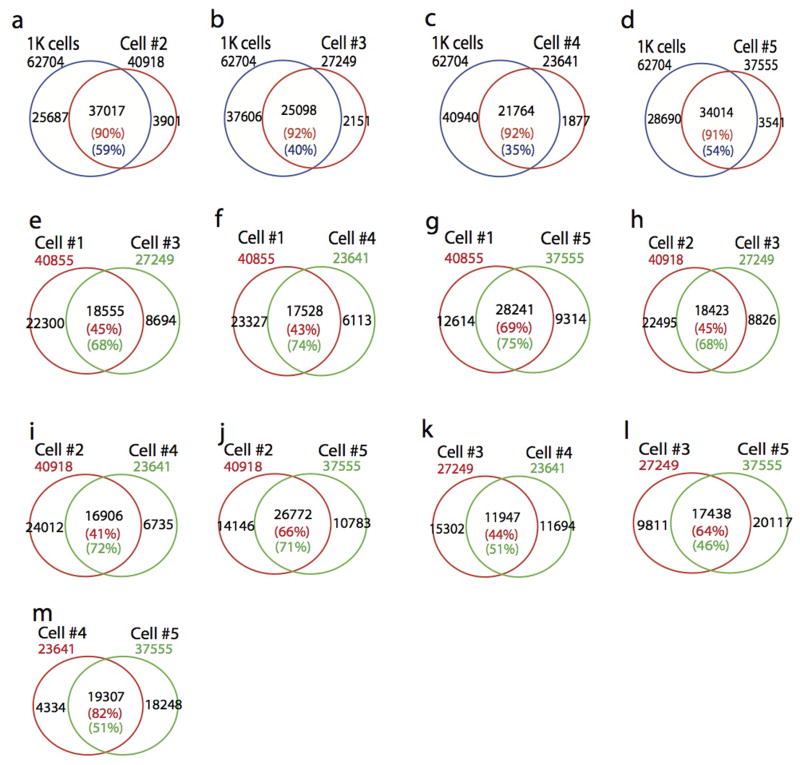
We developed a circular carrier DNA-mediated sequencing method, called Pico-Seq, to analyze genome-wide DHSs in a few cells or even single cells (Fig. 1a). Application of Pico-Seq to NIH3T3 cells generated DHS profiles of 10,000, 1000, 100 and even single cells comparable to that of mouse ENCODE data obtained from 10 to 20 millions of cells (Fig. 1b). On average, about 317K unique Pico-Seq reads and 38K DHSs were detected per single cell. Although the numbers of mapped reads and DHSs decrease as the cell numbers decrease, the enrichments of reads in DHS in different single cells were very similar (23–26% of reads in DHS regions), despite minor differences (Supplementary Table S1–S3). Scatter plot analysis indicated that the DHSs from 10,000, 1000 and 100 cells are as reproducible as the ENCODE data (Fig. 1c–d and Extended Data Fig. 1a–c). The pooled DHSs of five single NIH3T3 cells were significantly correlated with that of 1000 cells (Fig. 1e). We also observed high correlation of DHSs between single cells (Fig. 1f, Extended Data Fig. 1d–l). Venn diagrams showed that ≥90% of DHSs in single cells could be detected in 1000-cells data (Fig. 1g and Extended Data Fig. 2a–d). Large fractions (41–82%) of DHSs were shared between two single-cells (Fig. 1h and Extended Data Fig. 2e–m). While only 35%–59% of the DHS in 1000-cells data were detected in each single cell (Fig. 1g and Extended Data Fig. 2a–d), detectability increased to 72% when the 5 single cells were pooled (Fig. 1i), suggesting single cell specific DHSs contribute to the total number of DHSs detected in a population of cells.
Figure 1. Genome-wide detection of DNase I hypersensitive sites of single cells using Pico-Seq.
a. Schema of Pico-Seq. FACS-sorted single cells were digested with DNase I, followed by end-repair, adaptor ligation, PCR amplification in the presence of circular carrier DNA and sequencing.
b. Genome Browser displays showing the DHS in ENCODE data and Pico-Seq data (black tracks). The red tracks show Pico-Seq read densities in DHSs of 5 single NIH3T3 cells and 14 single mouse ES cells.
c–f. Scatter plots showing the tag density correlation of DHSs between two libraries. Each dot represents one or more DHSs.
g–i. Venn diagrams showing the significant overlaps of DHSs between two libraries.
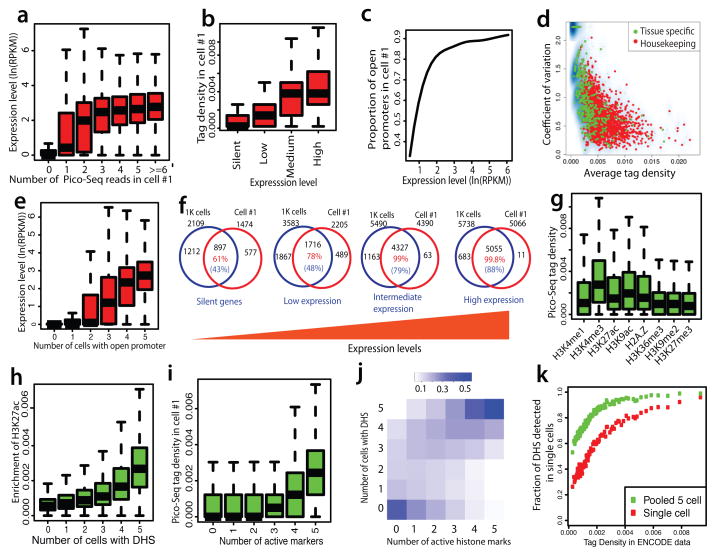
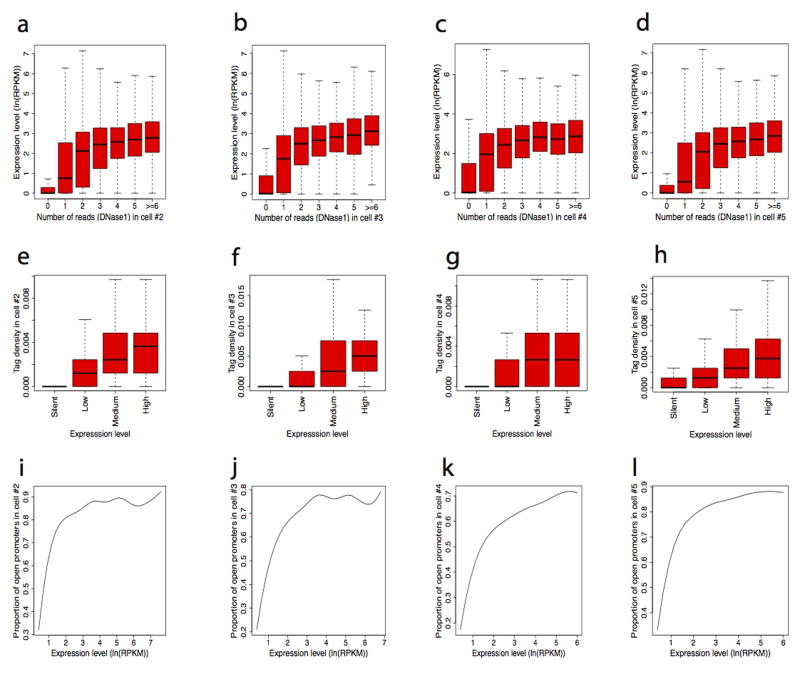
The false discovery rates (FDR) of single cell libraries were 11%–13% (Supplementary Table S2) when one Pico-Seq tag was detected within a DHS region, suggesting that even detection of one tag is likely to represent a true DHS. Indeed, TSSs with one tag exhibited significantly higher expression levels than those without any tag (Fig. 2a and Extended Data Fig. 3a–d). The tag number at TSSs positively correlated with expression levels when the number was low (0–3 tags), but expression levels do not significantly change when the number was high (>3 tags) (Fig. 2a and Extended Data Fig. 3a–d), indicating that the gene expression is no longer limited by accessibility once the promoter has become accessible. As expected, the tag density at TSSs in each single cell correlated with gene expression levels measured in a population of cells (Fig. 2b and Extended Data Fig. 3e–h), and almost all promoters of highly expressed genes were accessible in each single cell (Fig. 2c and Extended Data Fig. 3i–l). Consistent with these observations, the tag densities at housekeeping genes were higher and variations lower than those at tissue-specific genes (Fig. 2d). The number of cells where a promoter exhibited DHS correlated with its gene expression; the genes with DHSs across all the five single cells have the highest expression level (Fig. 2e). Further analysis showed that the genes with the lowest cell-to-cell variation at promoters were significantly enriched in basic cell functions such as transcription, cell cycle and RNA processing (Supplementary Table S4). The genes with the highest cell-to-cell variation were significantly enriched in metal ion binding (Supplementary Table S5).
Figure 2. Detectability of single-cell DHSs is positively correlated with gene expression and number of active histone modifications.
a. Number of tags within −/+ 1Kb of TSSs correlated with higher gene expression in single cell #1.
b. Pico-Seq tag density in single cell #1 is positively correlated with gene expression in a population of cells.
c. The proportion of open promoters detected by Pico-Seq in single cell #1 is positively correlated with gene expression.
d. Housekeeping genes (red) show higher tag density and lower variation than tissue-specific genes (green).
e. Genes with open promoter in more single cells are associated with higher expression levels.
f. The percentage of overlaps between DHSs detected in 1K NIH3T3 cells and single cell #1 positively correlated with gene expression. The total number of genes with DHSs for each group was indicated outside of the Venn diagrams. The number in red indicate that percentages of DHSs detected in single cell #1 that overlapped with the DHSs detected in 1K cells.
g. Active histone modifications (H3K4me1, H3K4me3, H3K9ac, H3K27ac and H2A.Z) are associated with higher Pico-Seq tag density than the repressive H3K27me3 and H3K9me2 modifications in single cells.
h. The H3K27ac level effectively predicts the detectability by Pico-Seq.
i. The Pico-Seq density in cell #1 correlated with the number of histone active modifications.
j. The detection of DHSs across multiple single cells is positively correlated with the number of histone modifications.
k. The DHS detectability in single cells is correlated with the tag density of DHS peaks in the ENCODE data.
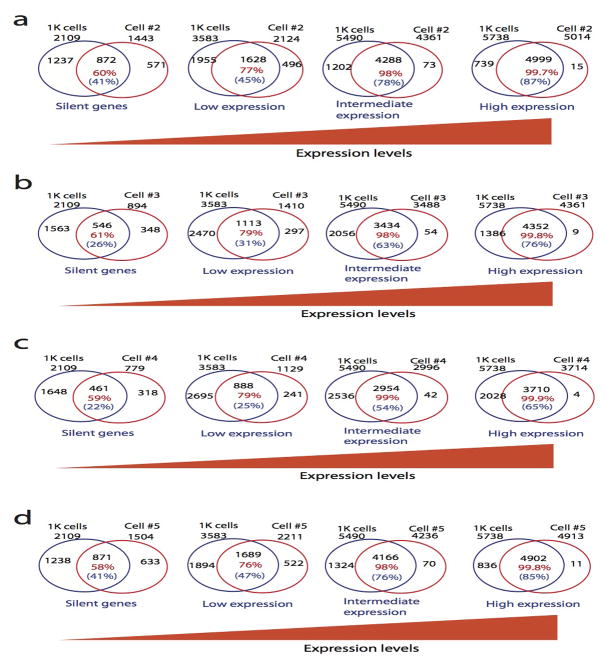
Next we examined the fraction of overlapping open promoters where DHS was detected in either 1000 cells or one single cell in different expression groups. The analysis revealed that while only 58–61% of the open promoters overlapped in the silent gene group, 98–99.9% of the open promoters in intermediately and highly expressed gene groups detected in a single cell overlapped with those detected in 1000 cells (Fig. 2f and Extended Data Fig. 4), indicating that the DHSs of active genes can be consistently detected in single cells.
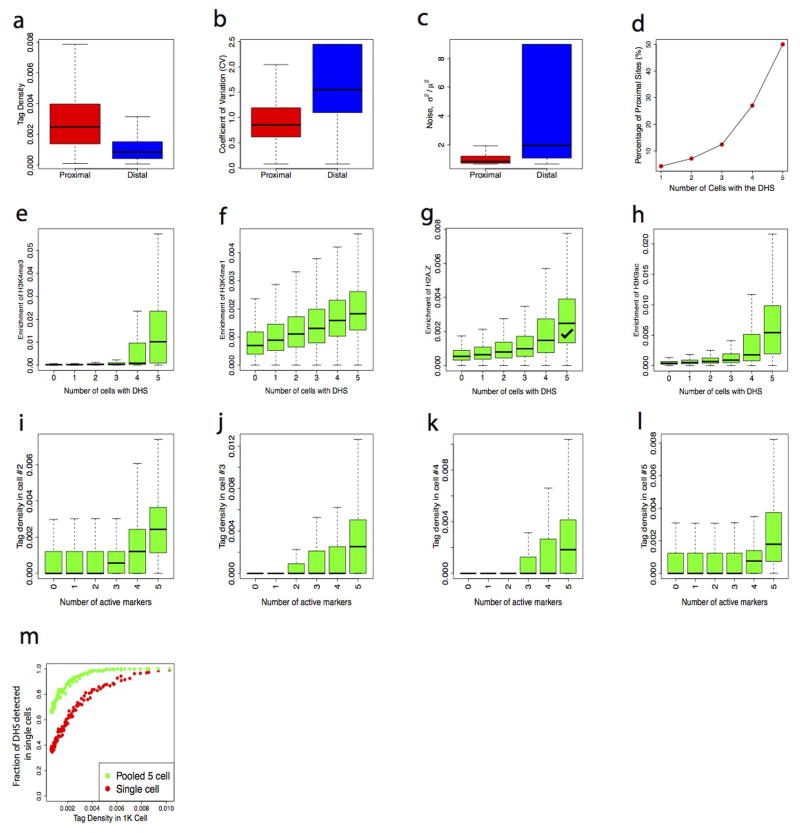
Compared with promoter/proximal DHSa, distal DHSs showed lower tag density, higher cell-to-cell variation, and noise (Extended Data Fig. 5a–d). Nevertheless, distal DHSs in single cells were clearly enriched in active histone modifications (H3K4me1, H3K4me3, H3K9ac, H3K27ac and H2A.Z) but not repressive ones (H3K36me3, H3K9me2 and H3K27me3) (Fig. 2g); which is consistent with the scenario at the population level 6–11 and validated our single cell assay. Interestingly, DHS detectability in single cells correlated with the degree of enrichment of the active histone modification (Fig. 2h and Extended Data Fig. 5e–h), and also correlated with the number of active marks at the DHSs (Fig. 2i and Extended Data Fig. 5i–l). The vast majority of DHSs were detected across all five single cells when five active histone modification marks were present, whereas DHSs exhibited in variable number of cells when only one or two active marks were present (Fig. 2j). These results indicate that DHS at enhancers are variable between different cells and provide strong evidence that multiple active histone modifications strongly correlated with chromatin accessibility across different single cells.
We compared the DHSs detectability in single cell with the tag density of DHSs from 1,000 cells or 20 million cells. The results indicated the detectability of DHSs in single cell positively correlated with the tag density from library by large number of cells (Fig. 2k, Extended Data Fig. 5m). We hypothesized that strong DHSs are present in all the cells and weak DHSs are present in only a fraction of the cells. If this is the case, more strong DHSs and fewer weak DHSs should be detected within one single cell. Indeed, 80% to 90% of the strong DHSs were detected whereas only 20% to 30% of weak DHSs were detected in single cells (Fig. 2k, Extended Data Fig. 5m). Another prediction from this hypothesis is that relatively fewer strong DHSs and more weak DHSs will be additionally detected as we add up single cells. Pooling the 5 single cells indeed showed the fraction of detected weak DHSs was doubled, whereas the fraction of detected strong DHSs only increase by a few percentages (Fig. 2k, Extended Data Fig. 5m).
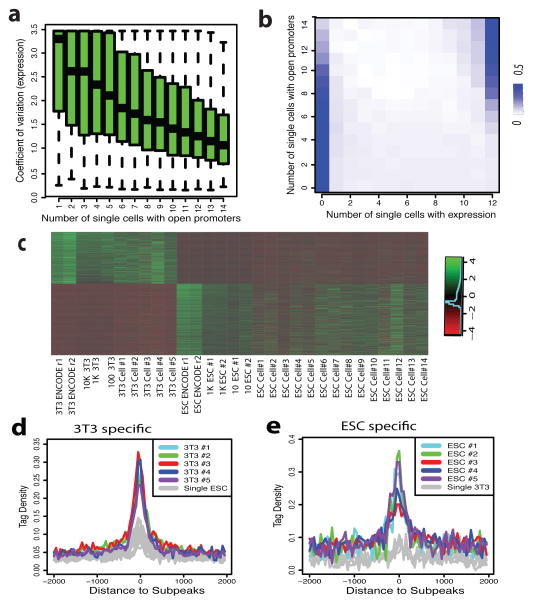
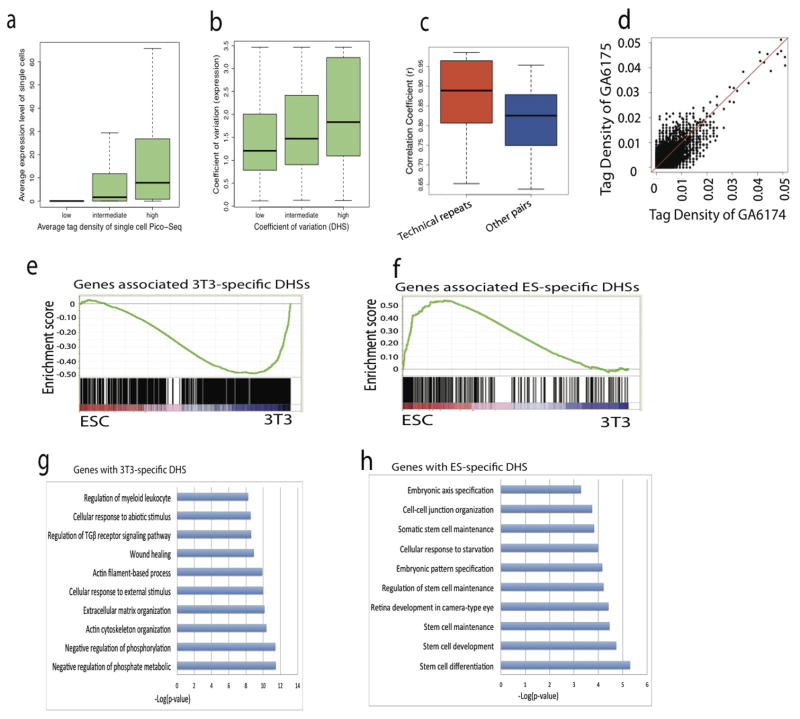
The variation of DHSs among single cells within a “homogenous” population is reminiscent of the well-known phenomenon on variation of gene expression among single cells12. To determine their relationship, we constructed 14 single embryonic stem cell (ESC) Pico-Seq libraries (Supplementary Table S6–S8). Comparison with single cell RNA-Seq data13 reveals that tag density and variation at TSS of single cell Pico-Seq indeed correlated with that of single cell gene expression (Extended Data Fig. 6a, b). Furthermore, the genes with DHSs in fewer single cells show high variation of expression and expressed in fewer single cells (Fig 3a, b). These results further indicate that the cell-to-cell variations of single-cell DHSs are predictive of gene expression. Consistent with this notion, we found a significantly higher correlation between the technical repeats compared to that of two non-technical repeat libraries (Extended Data Fig. 6c, d). The GO terms enriched among genes with the lowest and the highest cell-to-cell variation in the 14 ES cells are consistent with that in single 3T3 cells (Supplementary Table S9, S10).
Figure 3. Single-cell Pico-Seq DHS data can predict cell-specific enhancers.
a. Genes with DHS in fewer single cells (x-axis) exhibit much higher variation of gene expression across different single cells (y-axis).
b. Genes with DHS in fewer single cells (y-axis) are expressed in fewer single cells (x-axis).
c. The NIH3T3-specific and ESC-specific DHSs identified in single cells showed expected cell specificity in all libraries.
d. The subpeaks of NIH3T3-specific super-enhancers showing much higher tag density in NIH3T3 cells than that in ES cells.
e. The subpeaks of ESC-specific super-enhancers showing much higher tag density in ES cells than that in NIH3T3 cells.
We next identified 1,735 NIH3T3-specific DHSs and 2,180 ESC-specific DHSs based on the 5 NIH3T3 and 14 ES single cell Pico-Seq libraries. Heatmap showed these cell-specific DHSs display expected cell specificity in all the libraries (Fig. 3c). The cell-specific DHSs are highly correlated with cell-specific gene expression (Extended Data Fig. 6e, f) and enriched in distinct biological functions (Extended Data Fig. 6g, h). Super-enhancers play a key role in regulating expression of critical cell-specific genes14–16. We identified 275 NIH3T3-specific and 231 ESC-specific super-enhancers and compared their single cell Pico-Seq tag densities. The sub-peaks of 3T3-specific super-enhancers were associated with substantially higher tag density in single 3T3 cells than that in ESC, and vice versa (Fig. 3d, e), indicating that single-cell DHSs can help predict super-enhancers.
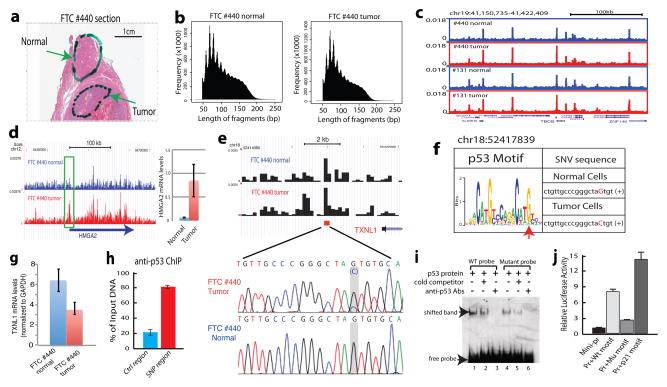
Chromatin defects underlie various diseases including cancers17. Profiling genome-wide chromatin accessibility in patient cells, which are often limiting in numbers, would be clinically invaluable. We applied Pico-Seq to cells dissected from follicular thyroid carcinoma (FTC) sample fixed on FFPE slides (Fig. 4a). DNase I digestion resulted in typical periodic cleavage patterns of nucleosome arrays and reads enrichment around TSSs (Fig. 4b and Extended Data Fig. 7a, b, c). Likewise, the genome browser displays showed peaks (Fig. 4c), suggesting the cells recovered from the FFPE slides retains key chromatin features.
Figure 4. Application of Pico-Seq to FFPE patient tissue sections reveals novel pathophysiological information on thyroid cancers.
a. A full view of a Hematoxylin and Eosin stained slide of FTC #440. Cells recovered from the highlighted areas were subject to Pico-Seq analysis.
b. Typical periodic DNase cleavage patterns of nucleosomes were detected for both the normal and tumor cells by Pico-Seq.
c. Genome Browser image displaying the Pico-Seq profiles of the normal (blue) and tumor (red) cells from two thyroid carcinomas #440 and #131.
d. Genome Browser image showing the increased chromatin accessibility of the HMGA2 promoter in the tumor cells of FTC #440 (left panel). qRT-PCR analysis shows the increased HMGA2 mRNA level in the tumor cells (right panel).
e. A single nucleotide variation (SNV) was identified at a DHS near the 3′ end of the TXNL1 gene in the tumor cells of FTC #440. The SNV location is indicated by the red square. The SNV was confirmed by Sanger sequencing (highlighted region).
f. The G to C change in tumor cells negatively impacts p53 target motif. The SNV in the p53 motif logo is indicated by a red arrowhead.
g. The G to C change in the tumor cells is correlated with decreased expression of TXNL1 by qRT-PCR analysis.
h. p53 is bound to the SNV region in a human thyroid cell line by ChIP-qPCR analysis.
i. The G-to-C change decreases p53 binding affinity in vitro by gel shift assay.
j. The G-to-C change reduces the activity of the p53 motif to activate a reporter promoter in vivo. The p53 motif from the p21 promoter was used as a positive control.
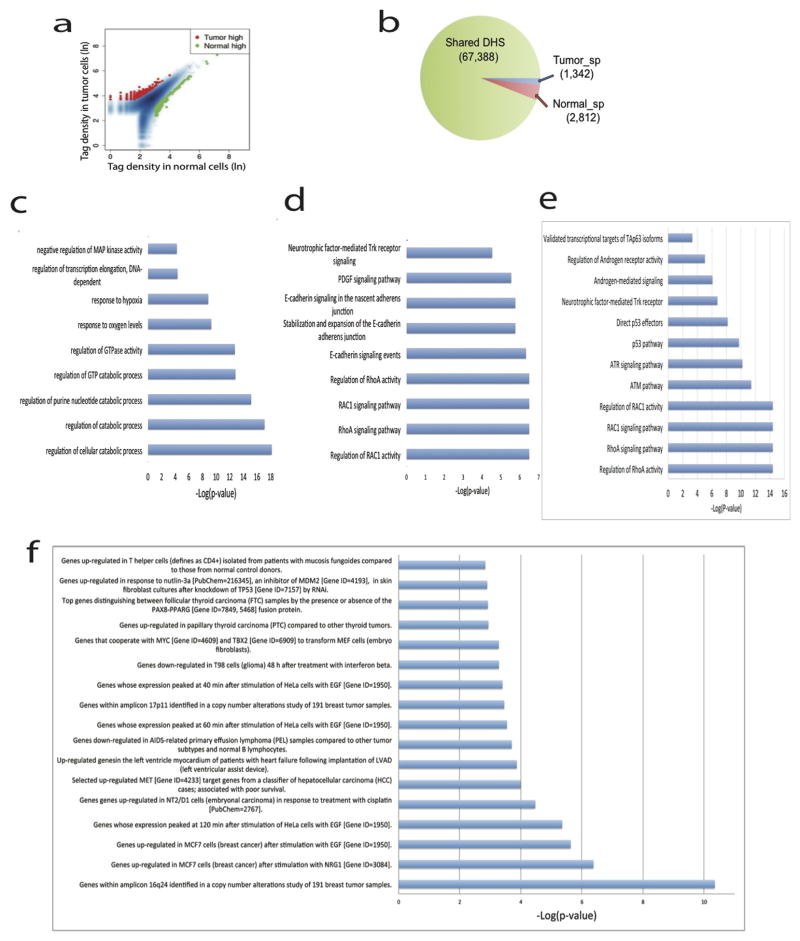
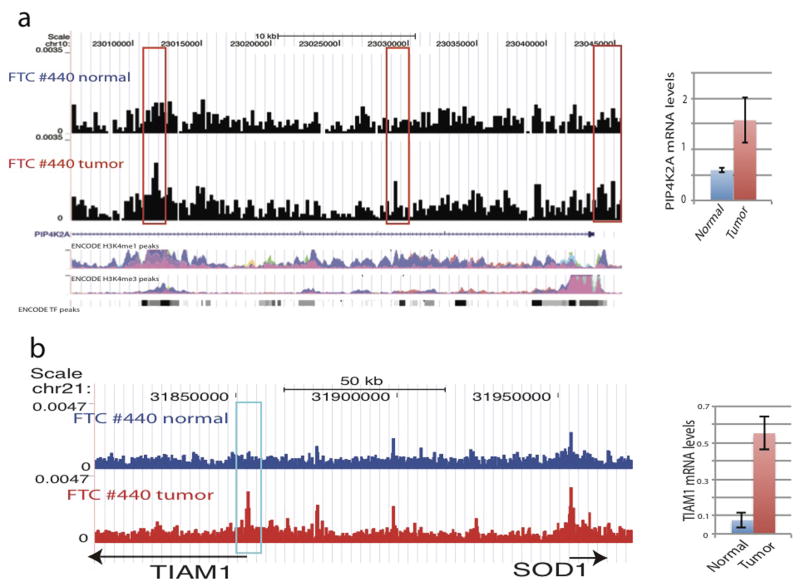
HMGA2 is up-regulated in FTC18,19 and its promoter indeed exhibited higher accessibility in the tumor than that in adjacent normal cells (Fig. 4d). Overall, 1,342 tumor-specific and 2,812 normal-specific DHSs are identified (Extended Data Fig. 8a, b). The genes associated with the tumor-specific DHSs were significantly enriched in the GO biological process terms such as regulation of GTPase activity and response to hypoxia, and pathways such as E-cadherin signaling, RhoA signaling, p53 pathway, RAC1 signaling and MYC transformation (Extended Data Fig. 8). Among these were several interesting genes, such as TIAM1 and PIP4K2A (Extended Data Fig 9a, b), involved in tumors20,21. Interestingly, genes that are characteristic of PAX8-PPARG fusion22 in FTC are enriched in tumor-specific DHSs (Extended Data Fig. 8f and Supplementary Table S11), even though PPARG gene rearrangement was not detected by FISH analysis of FTC #440 (data not shown). This suggests that pathways associated with the transcriptional regulation by PAX8-PPARG but not necessarily the PAX8-PPARG rearrangement itself is important in mediating follicular thyroid tumorigenesis.
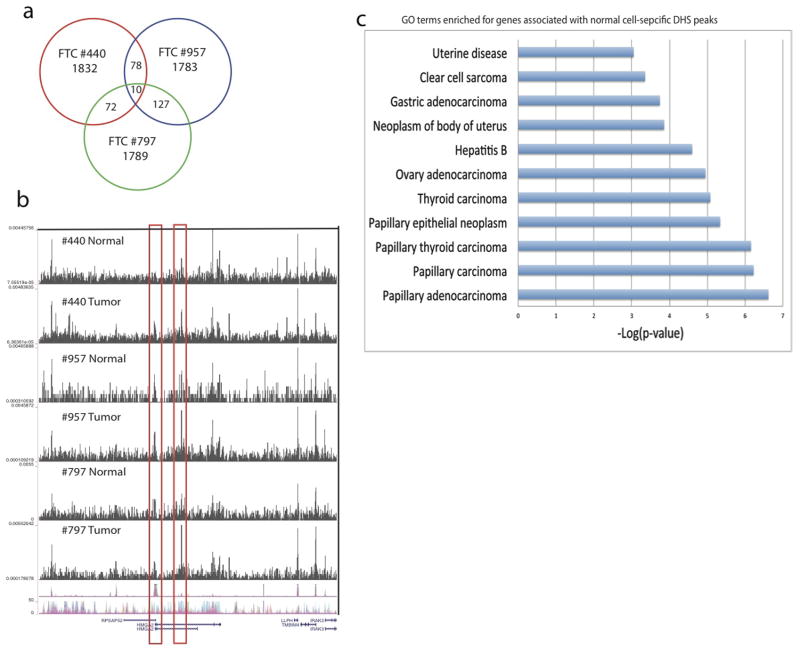
We similarly analyzed samples from two more FTC (#797 and #957) and one papillary thyroid carcinoma (PTC #131) samples (Supplementary Table S12). Comparison of the tumor-specific DHSs identified in the three FTC samples revealed very few shared DHSs among all three FTC samples (Extended Data Fig. 10a). The HMGA2 promoter exhibited a strong DHS in the tumor cells but not in their neighboring normal cells in FTC #440, while, in the other two FTC cases (#957 and #797) the promoter shows strong DHSs in both tumor and normal cells (Extended Data Fig. 10b). Instead, an intronic enhancer showed differential DHSs between the tumor and normal cells (Extended Data Fig. 10b). These results suggest that the mis-regulation of HMGA2 in the tumor cells may be attributed to different regulatory elements in different patients. Analysis of PTC #131 also identified numerous tumor cell-specific and normal-cell specific DHSs, which are enriched in disease ontologies (Extended Data Fig. 10c). Overall, our results indicate that the vast majority of DHSs are patient-specific, implying that these tumors may arise or progress via different mechanisms in different patients.
To gain further mechanistic insight, we searched for genetic lesions within DHSs in FTC#440 by comparing the DHS sequence between tumor and normal cells. A total of 31 potential single nucleotide variations (SNVs) were identified in the DHS regions, which included both loss of heterozygosity of known SNPs and de novo mutations (Supplementary Table S13). We confirmed the de novo mutation (chr18:52417839 G>C) at a DHS downstream of the Thioredoxin-like 1 gene (TXNL1) (Fig. 4e). TXNL1 encodes a regulatory subunit of the human 26S proteasome23. Down-regulation of TXNL1 is associated with poor prognostic outcomes, aneuploidy in colorectal carcinoma24 and is implicated in cispatin-induced apoptosis25. Interestingly, the G>C change appears to negatively impact the binding motif of p53 (Fig. 4f) and correlates with significantly decreased expression of TXNL1 in the tumor cells (Fig. 4g). p53 binds to this DHS in a human thyroid cell line (Fig. 4h). The G>C mutation at this site compromises p53 binding (Fig. 4i) and impairs its ability to activate a reporter promoter (Fig. 4j), suggesting that the G>C change may underlie the decreased TXNL1 expression in the tumor cells (Fig. 4g). This SNP was not detected in the other 3 patients (#797, #957 and #131). Therefore, our strategy for searching SNVs in relevant DHS regions seems to be a cost-effective alternative to whole genome sequencing for detecting functionally important mutations in regulatory regions.
Tn5 transposase-mediated detection of chromatin accessibility (scATAC-Seq)26,27 in a large number of single cells has been reported recently. However, the reads per cell generated by scATAC-Seq may be too sparse to examine the cell-to-cell variation at individual regulatory regions26,27. In comparison, our Pico-Seq detects a much larger number of DHSs per cell, which provides information on cell-to-cell variations of individual DHSs. Pico-Seq is expected to find its use in multiple settings, such as the analysis of rare cell populations during lineage development and the study of clinical samples with extremely small number of cells such as circulating tumor cells, laser-captured cells, core biopsy or fine needle aspiration samples. Being able to evaluate of the chromatin states associated with the specific disease or developmental programs may provide valuable new information for developing new diagnostic and therapeutic strategies for these malignancies.
Methods
Cell culture and Sorting
NIH/3T3 tet-on 3G cells (Clontech cat# 631197) were cultured in DMEM (Invitrogen cat# 10566-016) supplemented with 10% FBS (Sigma cat# F4135-500ML) and 100U/ml Penicillin-Streptomycin (Invitrogen cat# 15140-122). Mouse ES cells were cultured as described28. Single cell suspension after trypsinization was used for DAPI staining immediately before sorting by flow cytometry. Single live cells were sorted and deposited directly into each tubes of a PCR strip-tube, which containing 30μl cell lysis buffer (10mM Tris-HCl, pH 7.5, 10mM NaCl, 3mM MgCl2, 0.1% Triton X-100).
DNase I digestion and Pico-Seq library preparation
To prevent loss of the extremely small amount of DNase I hypersensitive DNA (< 0.001pg) released by DNase I digestion of single cells, we added a large amount of circular plasmid DNA (30ng; 3×10⁷ times of the DHS DNA) as carrier DNA in the subsequent steps of library preparation. The circular DNA was not compatible with the adaptor ligation and thus could minimize the non-specific amplification by the subsequent PCR. The PCR conditions were optimized to amplify the small fragments (<200 base pairs) derived from DNase I hypersensitive sites without prior fractionation of these fragments.
For DNase I digestion, 0.2 to 1 unit of DNase I (Roche, catalog # 04716728001) was added to the cells and incubated at 37°C for 5 minutes. The reaction was stopped by adding 80 μl of Stop Buffer (10mM Tris-HCl, pH 7.5, 10mM NaCl, 0.15% SDS, 10mM EDTA) containing 1μl of 20mg/ml Proteinase K and 5μl of 6ng/μl circular carrier DNA. The mixture was incubated at 55°C for 1 hour and DNA purified by Phenol-chloroform extraction, followed by precipitation with ethanol in the presence of 20μg glycogen. The library was prepared using Illumina kits as described29. The libraries were amplified using a two-step method to preferentially amplify the small DNA fragments derived from the DNA hypersensitive sites and to reduce non-specific amplification of the carrier DNA. The first amplification was done with index primers with the PCR condition: 98°C, 10″; 67°C, 30″; 72°C, 30″ for 6 cycles. After isolation of the desired fragments (160 to 300bp) using 2% E-gel (Invitrogen), the second amplification was done with the P5 and P7 primers with the condition: 98°C, 10″; 68°C, 30″; 72°C, 30″ for 22 cycles. The fragments between 160bp to 300bp were isolated on E-gel and sequenced on Illumina HiSeq2500.
Recovery of cells from formalin-fixed paraffin-embedded tissue slides
The anonymized tumor samples from Ambry Genetics, IRB-approved with informed consent, were used in this study. Three thyroid cancer cases were diagnosed as follicular thyroid carcinoma and one case was diagnosed as papillary thyroid carcinoma. Cells were manually scraped off from the highlighted area of a paraffin slide using a razor blade and resuspended in 150μl of deparaffinization solution (Qiagen, Mat. No. 1064343) and incubated at 56°C for 3 minutes. After cooling to room temperature, 150 μl of lysis buffer (10mM Tris-HCl, pH 7.5, 10mM NaCl, 3mM MgCl2, 0.1% Triton X-100) was added and incubated at 37°C for two hours. The cells in the lower layer were transferred to a new tube and digested by DNase I as described above. The formaldehyde cross linking was reversed by incubating DNA at 65°C, overnight, which was followed by DNA purification and library preparation.
Extraction of total RNAs from cells recovered from FFPE slides, RT-PCR, RNA-Seq
Cells recovered from FFPE slides were resuspended in 150μl of deparaffinization solution (Qiagen, Mat. No. 1064343) and incubated at 56°C for 3 minutes. Total RNA was extracted using an RNA extraction kit from (Qiagen, Cat #73504), following manufacture’s instruction. After reverse transcription using an oligo dT primer, the mRNA expression levels of selected genes were analyzed using the following gene-specific primers and probes from Applied Biosystems: (HMGA2-Hs00171569_ml, TIAM1-Hs01021959_ml, TXNL1-Hs00355488_ml, PIP4K2A-Hs00178197_ml and GADPH-Hs99999905_ml.
The RNA-Seq libraries were generated according to established protocols and sequenced on HiSeq2500 platforms.
Validation of SNVs by Sanger sequencing
The tumor and adjacent normal cells from FFPE slides were recovered and resuspended in 100μl of 1xTE + 0.1% SDS + 0.2mg/ml proteinase K. Following incubation at 65°C for overnight, the genomic DNA was purified using phenol-chloroform extraction and ethanol precipitation. The genomic region containing the potential sequence variation was amplified by PCR using specific primers. The PCR products were then sequenced by Sanger sequencing.
Forward primer: AAGCTAAATGAGCAAAATATTCCT
Reverse primer: GGGAGGCTGAGGCAGTAGAATCG
ChIP, EMSA and promoter reporter assays
Chromatin extracts were prepared from a human thyroid cell line (Nthy-ori 3-1 human Cell Line, from Sigma-aldrich, Catalog # 90011609). ChIP experiments were performed with p53 antibodies (SANTA CRUZ BIOTECHNOLOGY, Catalog # sc-6243X) using established protocols1. The ChIP DNA was analyzed using qPCR with the following primers: p53 positive forward primer: GTCATGCGATCTTGGCTCACT, reverse primer: CTTGGGAGGCTGAGGCAGTA, probe: CAACCTCCGCCTCCCGGGTTC. Control forward primer: CCCCATGCTGTTCTCGTGATA, reverse primer: GCAAAGGTGAATCAAGGCATCT, probe: TTTATAAGGTTCTCTTCCCCTTTCGCTGGG.
EMSA experiments were performed using nuclear extracts of HeLa cells transfected with a p53 expression vector (kindly provided by Dr. Jing Huang). Briefly, the double-stranded oligonucleotide probes (Wild type p53 site: CACTCTGTTGCCCGGGCTAGTGTGCAGT; Tumor p53 site: CACTCTGTTGCCCGGGCTACTGTGCAGT; p21 promoter p53 site: CAGGAACAAGTCAAGACATGTTCAGC) were synthesized and labeled with biotin using Biotin 3zeEnd DNA Labeling Kit (Thermo scientific, Catalog # 89818). The EMSA assays were conducted by using LightShift Chemiluminescent EMSA Kit (Thermo scientific, Catalog # 20148) according to manufacture’s instructions.
To test the activity of the p53 binding sites to activate a reporter promoter, we cloned the wild type p53 binding motif, the motif with the G>C mutation and the p53 motif from the p21 promoter into the Xho I + Bgl II upstream of the basal CMV promoter driving a luciferase reporter gene (kindly provided by Dr. Jing Huang). The constructs were transfected into Nthy-ori 3-1 human Cell Line cells for two days and the luciferase activity of whole cell extracts was measured using Dual-Luciferase Reporter Assay kit (Promega, Catalog # E1960). The oligo sequences used in the reporter constructs: wild type p53 site: TCGAGCTGTTGCCCGGGCTAGTGTGA; Tumor p53 site: TCGAGCTGTTGCCCGGGCTACTGTGA; p21 promoter p53 site: TCGAGGAACAAGTCAAGACATGTTCA.
Data analysis
Data, reads mapping and filtering
In this study, we constructed a total of 38 Pico-Seq libraries including 8 NIH3T3 libraries (Supplementary Table S1), 18 ES cell libraries (Supplementary Table S6) and 12 FFPE patient libraries (Supplementary Table S12). Among these libraries, there are 5 NIH3T3 single cell Pico-Seq libraries and 14 ESC single cell Pico-Seq libraries. We also prepared 8 RNA-Seq libraries using cells recovered from the FFPE tissue section slides of FTC #440 (Supplementary Table S12). In addition to the Pico-Seq and RNA-Seq libraries prepared in this study, we integrated the histone modification ChIP-Seq data of NIH3T3 from our previous study30. We also downloaded the DNase-Seq data of NIH3T3 cells and embryonic stem cells (ESC) from mouse ENCODE project31. Reads of DNase-Seq/Pico-Seq/ChIP-Seq were mapped to the mouse genome (mm9) or human genome (hg18) using Bowtie232. Iterative alignment, in which the unmapped reads were trimmed 5bp and were re-aligned until reads <26bp, were conducted for small cell number Pico-Seq libraries and single cell Pico-Seq libraries. The reads with MAPQ <=10 or redundant reads that map to the same location with the same orientation were removed from further analysis in each library. The mappability of 1000-cell Pico-Seq libraries to the mouse or human genome was about 40% while that of the single-cell Pico-Seq libraries was about 2% due to non-specific amplification of carrier DNA. The tag density at each bin of 200bp was calculated by normalizing the number of reads in the bin to the total number of reads in the library and the bedgraph were uploaded to the UCSC genome browser.
Peak calling for DNase-Seq/Pico-Seq and correlation between different libraries
The DHS (DNase I Hypersensitive sites) in mouse ENCODE DNase-Seq data and small cell number Pico-Seq data were identified using MACS33 by setting a p-value to 1e-5. The peaks identified in the ENCODE data were extended ±1Kb from the summit of the peak if the peak size is <2Kb and overlapping peaks were merged. Then the number of reads in each DHS for all DNase-Seq libraries and Pico-Seq libraries was counted. The tag density at each DHS was calculated by normalizing the number of reads in the DHS to the total number of reads in the library (possibility of a tag located on a base-pair per million reads). Pearson product-moment correlation coefficient (r) of tag densities at genome-wide DHS between two libraries was calculated to indicate the correlation between different Pico-Seq libraries. For single cell libraries, the reads out of DHS were filtered and the number of reads in each 1000bp size bin was counted for generating the heatmaps. Any DHS region in a single cell with a reads located in was treated as open accessibility thus a DHS in this single cell. For the pooled 5 single cells, any DHS region with ≥2 reads located in was treated as the DHS in the pooled 5 single cells.
The false discovery rate of the DHS detected in single cells
In a NIH3T3 single cell Pico-Seq library, the total number of observed DHSs and false positive (type I error) DHSs were denoted by NDHS and NFP, respectively. On the other hand, any reads that located out of the DHSs detected in ENCODE data must be caused by noise generated during library preparation. The noise level (σ) should be the total number of reads that located out of the DHS in ENCODE data dividing total length of the regions that are not DHS. The false positive are genome-wide noise level (σ) multiply the total length of the DHS. Thus, the false discovery rate (FDR) should be the false positive DHSs dividing all the detected DHS in single cell:
Based on this formula, we calculated the FDR for each NIH3T3 and ESC single cell Pico-Seq library (Supplementary Table S2, S7).
Differentially expressed genes and tissue-specific genes
The reads from RNA-Seq libraries were mapped to the mouse genome (mm9) or human genome (hg18) using bowtie232. The gene expression level was measured by RPKM (Reads per kilobase per million mapped reads) and number of reads in each gene. The cell specific genes between ESC and NIH-3T3 were identified using EdgeR (FDR < 0.05; Fold change > 1.5 or < 2/3)34.
We used tissue specificity index τ35 to measure the tissue specificity of each gene, which is defined as the heterogeneity of its expression level across all the tissues. Assuming there are n tissues, the expression level of a gene in the jth tissue is E(j) and the highest expression level of the gene across all tissues is Emax. Thus τ is calculated by
The values of τ range from 0 to 1, with higher value indicating higher variation of expression across tissues and thus higher tissue specificity, while the lower value indicated the lower variation of expression across tissues. The genes with the lowest τ were could be considered as housekeeping genes. In this study, we calculated the τ based on gene atlas data from bioGPS. The 2000 genes with the highest τ and the 2000 genes with the lowest τ were treated as the tissue specific genes and housekeeping genes, respectively.
The histone modification ChIP-seq data and peak calling
Since the peaks of some histone marks such as H3K36me3 and H3K27me3 are very broad, we identified the tag-enriched peaks using SICER36, which takes advantage of the enrichment information from neighboring bins to identify spatial clusters of signals that are unlikely to appear by chance. We set the window size to 200bp and FDR =0.01 for each histone modification ChIP-Seq library, while we set the gap to 200bp for H3K4me3, H3K9ac; 400bp for H2A.Z; and 600bp for the H3K4me1, H3K9me2, H3K27ac and H3K27me3. We calculated the tag densities of each active histone modification peak and identified whether the peak is a DHS in each single cell in order to find whether the enrichment of an active histone mark is correlated with the number of cells with DHS at the same locus. We calculated the tag densities of each single cell Pico-Seq library at each DHS and examined whether a DHS co-occurs with these active histone modification in order to find whether the chromatin accessibility in each single cell is correlated with the number of histone modification in the same locus. Two peaks from different libraries were considered co-occurrence if the overlapped region accounts for >10% length of a peak.
Reads around promoters and subpeaks of super-enhancers
The RefSeq genes (mm9 and hg18) were downloaded from the UCSC website. The regions ±1Kb around the TSS were treated as promoters in this study. The number of Pico-Seq reads located in a promoter was used to measure the chromatin accessibility of the promoter. We searched the super-enhancer in NIH3T3 via ROSE15 based on H3K27ac ChIP-Seq data and Pico-Seq data, respectively. We obtained a total of 275 high-confidence super-enhancers in NIH3T3 by identifying super-enhancers showed in both H3K27ac data and DNase-Seq data. In addition, the 231 super-enhancers in ESC reported by Whyte et al.15 were used in this study. Subpeaks in super-enhancers were identified by MACS and average reads densities around these subpeaks of super-enhancer were calculated.
Single-cell specific DHS and Gene Set Enrichment Analysis (GSEA)
For each DHS detected in ENCODE data, the number of reads in each NIH3T3 and ES cells were counted. To examine whether the chromatin accessibility between NIH3T3 and ES cells are significant different, Wilcoxon signed-rank test was performed on the number of reads in the 5 the NIH3T3 and 14 ES cells at each DHS. A DHS was active (indicated by 1) in a single cell if there are ≥1 reads located on the DHS region in the cell, while the alternative is not active (indicated by 0). The Fisher’s exact test on each locus was performed on the number of cells with active DHSs and number of cells without active DHSs between the 5 NIH3T3 and 14 ES cells. The DHSs with p value <0.05 by both Wilcoxon test and Fisher’s test were treated as cell type specific. Finally, we identified 1,735 single-cell NIH3T3-specific DHSs and 2,180 single-cell ESC-specific DHSs. We employed GSEA37 to determine whether the priori defined genes in or vicinity of single cell-specific DHSs showed statistically significant differences between NIH3T3 and ESC based on the gene expression data.
Gene ontology of single-cell NIH3T3-specific and ESC-specific DHSs
In order to predict the function of single-cell NIH3T3-specific or ESC-specific DHSs, we performed gene ontology analysis using GREAT38 with the 1,735 NIH3T3-specific and 2,180 ESC-specific DHSs. It is obvious that the single cell ESC-specific DHSs are enriched with stem cell development and differentiation genes and the single-cell NIH3T3-specific DHSs are enriched with in genes with different functions (Extended Data Fig. 6g,h). These results indicated that the ESC-specific and NIH3T3-specific DHSs identified in the single-cell Pico-Seq libraries predict important enhancers critical for tissue-specific gene expression.
Identifying tumor-specific mutation
We generated Pico-Seq libraries using tumor or their neighboring cells recovered from formalin-fixed paraffin-embedded tissue section slides. The sequence reads were mapped by bowtie2 to the human reference genome (hg18). The paired reads with distance <500bp were kept if pair-end sequencing was performed. Then reads with MPAQ<20 and possible duplication were removed by SAMtools39. Variation calling on each normal-tumor pair was conducted using SAMtools mpileup, with diploid model, mapQ>=20 and phred-like score (BAQ)>=30. The variations that only normal and tumor show different genotypes were kept. Then the low quality variations were filtered (QUAL <20, MQ<20, FQ<0, VDB<0.01 and minor allele <3). We obtained 31 variation candidates in FTC #440 (Supplementary Table S13) and many of them were located on the predicted TF binding motifs.
Tumor and normal cell specific DHS
The genome-wide DHSs were obtained by peak calling of the normal cell Pico-Seq and tumor cell Pico-Seq libraries, respectively. The DHSs in normal cells and tumor cells were pooled and reads in each library among the pooled DHS were counted. The normal cell and tumor cell specific DHSs were identified using EdgeR.
Extended Data
Extended Data Fig. 1. Scatter plots showing the high correlation of DHSs detected in a small number of cells or single cells.
Each dot represents the tag density of one DHS or more DHSs with the same value. a–c, Correlation of DHS between ENCODE data and small cell number libraries. d–i, Correlation of DHSs between the 5 single cells.
Extended Data Fig. 2. Venn diagrams showing DHSs detected in single cell significantly overlap with that detected in 1000-cells or the other single cells.
The total number of DHSs in each library was indicated outside of the Venn diagrams. a–d, Overlapping DHSs between single cell and 1000-cells data. e–m, Overlapping DHSs between two single cells.
Extended Data Fig. 3. Detectability of single cell DHSs at promoters is positively correlated with gene expression.
a–d, Detection of DHSs around TSSs is correlated with higher gene expression in each single cell. Genes were sorted according to the number of Pico-Seq reads within −/+ 1Kb region of TSSs and plotted against their expression on Y-axis. e–h, Pico-Seq tag density is positively correlated with gene expression in each single cell. Genes were sorted to four groups according to their expression levels. Box plots show Pico-Seq tag density around TSSs (Y-axis). i–l, The proportion of open promoters detected by Pico-Seq in each single cell is positively correlated with gene expression.
Extended Data Fig. 4. The DHSs on the promoter of highly expressed genes are more reproducible.
The percentage of overlapping between DHSs detected in 1K cells and each single cell positively correlated with gene expression. The total number of silent genes, lowly expressed, intermediately expressed and highly expressed genes showing DHSs were indicated outside of the Venn diagrams. The numbers in red indicate that percentages of DHSs detected in a single cell that overlapped with the DHSs detected in 1K cells.
Extended Data Fig. 5. The high variations of distal DHSs and detectability of single-cell DHSs correlated the number of active histone modifications.
a–d, Distal DHSs showing lower tag density and higher variation than that of proximal DHSs among single cells. The average tag densities of the proximal DHSs among single cells are higher than that of distal DHSs (a). The proximal DHSs showed much higher variation (b) and noise (c) compared with that of distal DHSs. The fraction of proximal DHSs highly correlated with the number of cells with the DHSs (d). e–h, The histone modification levels (H3K4me3, H3K4me1, H3K9ac and H2A.Z) correlated with the detectability of DHSs in single cells. Histone modification peaks were sorted according to the number of single cells where they were detected by Pico-Seq. The active histone modification enrichment levels of each group are displayed using Box plots. i–l, The Pico-Seq density in each NIH3T3 single cell positively correlated with the number of active histone modifications at the DHS. Tag density of each Pico-Seq was sorted according to the number of histone modifications measured on a population of cells using ChIP-Seq. The Pico-Seq tag densities for each group are shown by Box plots. m, The DHS detectability in single cells is correlated with the tag density of DHS peaks in the 1000 cells library. The DHSs obtained from the 1000 cells library were binned to 100 groups based on the tag density (or peak height) (x-axis). Y-axis indicates the fraction of DHS detected in a single cell or pooled 5 single cell Pico-Seq libraries for each bin.
Extended Data Fig. 6. Biological variations contributed to cell-to-cell variation and DHSs detected in single-cell Pico-Seq can predict cell-type specific enhancers.
a–b, Single cell chromatin accessibilities and single cell gene expressions are positively correlated. Average (a) and variation (b) of tag density in single cell Pico-Seq at gene promoters correlated with that of gene expression level in single cells, respectively. c–d, Biological variations contributed to cell-to-cell variations because correlation coefficient between technical repeats are significantly higher than that of other pairs of libraries (non-technical repeat pairs). Two NIH3T3 cells were sorted into one tube, which were digested with DNase I and then split to two tubes. Thus each tube contained the amount of DNA that should be similar to that of one cell. By doing this, the two libraries prepared using the two tubes could be treated as technical repeats. Correlations coefficient between technical repeats are higher than that of other pairs of libraries(c). Scatter plot of a pair of technical repeat (d). e–f, Genes associated with NIH3T3-specific DHSs and ESC-specific DHSs correlated with NIH3T3 and ESC specific expressed genes, respectively. g–h, Genes associated with NIH3T3-specific DHS or ESC-specific DHSs are enriched in distinctive gene ontology terms.
Extended Data Fig. 7. The Pico-Seq libraries for FFPE tissues slide showing expected patterns.
a, DNA fragments of the Pico-Seq libraries from both cultured cells and FFPE tissues showed periodical cut patterns expected from DNase I digestion of nucleosomal DNA. b, The Pico-Seq reads from both cultured cells and FFPE tissues are enriched around TSSs. c. The reads enrichments around TSS of FTC #440 normal and FTC #440 tumor are similar.
Extended Data Fig. 8. Tumor specific DHS in FTC #440 enriched GO terms and pathways.
a–b, Normal-specific and tumor-specific DHSs account a small fraction of the total DHS. c, GO biological process terms significantly enriched in the tumor specific DHS. d, Pathways significantly enriched in the tumor specific DHS. e, Pathways significantly enriched in the tumor specific DHS with relaxed threshold. f, Gene sets that represent gene expression signatures of genetic and chemical perturbations significantly enriched in tumor specific DHS.
Extended Data Fig. 9. Tumor-specific DHSs are correlated with increased expression in the tumor cells.
a, Genome Browser image showing the increased chromatin accessibility of two tumor-specific DHS regions at the PIP4K2A gene locus (left panel). The ENCODE H3K4me1 and H3K4me3 peaks are shown at the bottom of the panel. The PIP4K2A mRNA levels in normal and tumor cells, respectively, determined by quantitative RT-PCR and normalized to GAPDH (Right panel). b, Genome Browser image showing the increased chromatin accessibility of the TIAM1 promoter in thyroid tumor cells (left panel). TIAM1 mRNA levels in normal and tumor cells, respectively, determined by quantitative RT-PCR and normalized to GAPDH (Right panel).
Extended Data Fig. 10. The tumor-specific DHSs in each individual usually are unique.
a, The vast majority of DHSs are unique to each individual tumor case. b, Genome Browser image showing the two tumor-specific DHSs at the HMGA2 locus in three FTC patients. c, The normal cell-specific DHSs are enriched in multiple disease ontologies in PTC #131.
Supplementary Material
Acknowledgments
We thank Drs. James Cooper and Benjamin Stanton for critical reading of the manuscript, the NHLBI DNA Sequencing Core facility for sequencing the libraries and the NHLBI Flow Cytometry Core facility for sorting the cells. The work was supported by Division of Intramural Research, National Heart, Lung and Blood Institute (K.Z.), Intramural Research Program of National Library of Medicine (T.M.P.), CCR of National Cancer Institute (D.L.) of the National Institutes of Health. The Datasets have been deposited in the NCBI short reads archive.
Footnotes
Author contributions
KZ conceived the project. QT, KC, MW and KZ performed the experiments. WJ analyzed the data. YZ, GR, BN, JS, TMP, RC and DL contributed to the experiments or data analysis. DL and KZ directed the project. WJ and KZ wrote the manuscript.
Accession numbers
Our Pico-Seq and RNA-seq data sets have been deposited in the Gene Expression Omnibus database with accession number GSE61844.
References
- 1.Boyle AP, et al. High-resolution mapping and characterization of open chromatin across the genome. Cell. 2008;132:311–322. doi: 10.1016/j.cell.2007.12.014. [DOI] [PMC free article] [PubMed] [Google Scholar]
- 2.Thurman RE, et al. The accessible chromatin landscape of the human genome. Nature. 2012;489:75–82. doi: 10.1038/nature11232. [DOI] [PMC free article] [PubMed] [Google Scholar]
- 3.Sheffield NC, et al. Patterns of regulatory activity across diverse human cell types predict tissue identity, transcription factor binding, and long-range interactions. Genome Res. 2013;23:777–788. doi: 10.1101/gr.152140.112. [DOI] [PMC free article] [PubMed] [Google Scholar]
- 4.Song L, Crawford GE. DNase-seq: a high-resolution technique for mapping active gene regulatory elements across the genome from mammalian cells. Cold Spring Harb Protoc. 2010;2010 doi: 10.1101/pdb.prot5384. pdb prot5384. [DOI] [PMC free article] [PubMed] [Google Scholar]
- 5.John S, et al. Chromatin accessibility pre-determines glucocorticoid receptor binding patterns. Nat Genet. 2011;43:264–268. doi: 10.1038/ng.759. [DOI] [PMC free article] [PubMed] [Google Scholar]
- 6.Roh TY, Cuddapah S, Zhao K. Active chromatin domains are defined by acetylation islands revealed by genome-wide mapping. Genes Dev. 2005;19:542–552. doi: 10.1101/gad.1272505. [DOI] [PMC free article] [PubMed] [Google Scholar]
- 7.Litt MD, Simpson M, Gaszner M, Allis CD, Felsenfeld G. Correlation between histone lysine methylation and developmental changes at the chicken beta-globin locus. Science. 2001;293:2453–2455. doi: 10.1126/science.1064413. [DOI] [PubMed] [Google Scholar]
- 8.Heintzman ND, et al. Distinct and predictive chromatin signatures of transcriptional promoters and enhancers in the human genome. Nat Genet. 2007;39:311–318. doi: 10.1038/ng1966. [DOI] [PubMed] [Google Scholar]
- 9.Creyghton MP, et al. Histone H3K27ac separates active from poised enhancers and predicts developmental state. Proc Natl Acad Sci U S A. 2010;107:21931–21936. doi: 10.1073/pnas.1016071107. [DOI] [PMC free article] [PubMed] [Google Scholar]
- 10.Rada-Iglesias A, et al. A unique chromatin signature uncovers early developmental enhancers in humans. Nature. 2011;470:279–283. doi: 10.1038/nature09692. [DOI] [PMC free article] [PubMed] [Google Scholar]
- 11.Wang Z, et al. Combinatorial patterns of histone acetylations and methylations in the human genome. Nature genetics. 2008;40:897–903. doi: 10.1038/ng.154. [DOI] [PMC free article] [PubMed] [Google Scholar]
- 12.Shalek AK, et al. Single-cell RNA-seq reveals dynamic paracrine control of cellular variation. Nature. 2014;510:363–369. doi: 10.1038/nature13437. [DOI] [PMC free article] [PubMed] [Google Scholar]
- 13.Sasagawa Y, et al. Quartz-Seq: a highly reproducible and sensitive single-cell RNA sequencing method, reveals non-genetic gene-expression heterogeneity. Genome biology. 2013;14:R31. doi: 10.1186/gb-2013-14-4-r31. [DOI] [PMC free article] [PubMed] [Google Scholar]
- 14.Lin C, Garruss AS, Luo Z, Guo F, Shilatifard A. The RNA Pol II elongation factor Ell3 marks enhancers in ES cells and primes future gene activation. Cell. 2013;152:144–156. doi: 10.1016/j.cell.2012.12.015. [DOI] [PMC free article] [PubMed] [Google Scholar]
- 15.Whyte WA, et al. Master transcription factors and mediator establish super-enhancers at key cell identity genes. Cell. 2013;153:307–319. doi: 10.1016/j.cell.2013.03.035. [DOI] [PMC free article] [PubMed] [Google Scholar]
- 16.Hnisz D, et al. Super-enhancers in the control of cell identity and disease. Cell. 2013;155:934–947. doi: 10.1016/j.cell.2013.09.053. [DOI] [PMC free article] [PubMed] [Google Scholar]
- 17.You JS, Jones PA. Cancer genetics and epigenetics: two sides of the same coin? Cancer Cell. 2012;22:9–20. doi: 10.1016/j.ccr.2012.06.008. [DOI] [PMC free article] [PubMed] [Google Scholar]
- 18.Chiappetta G, et al. HMGA2 mRNA expression correlates with the malignant phenotype in human thyroid neoplasias. Eur J Cancer. 2008;44:1015–1021. doi: 10.1016/j.ejca.2008.02.039. [DOI] [PubMed] [Google Scholar]
- 19.Belge G, et al. Upregulation of HMGA2 in thyroid carcinomas: a novel molecular marker to distinguish between benign and malignant follicular neoplasias. Genes Chromosomes Cancer. 2008;47:56–63. doi: 10.1002/gcc.20505. [DOI] [PubMed] [Google Scholar]
- 20.Habets GG, et al. Identification of an invasion-inducing gene, Tiam-1, that encodes a protein with homology to GDP-GTP exchangers for Rho-like proteins. Cell. 1994;77:537–549. doi: 10.1016/0092-8674(94)90216-x. [DOI] [PubMed] [Google Scholar]
- 21.Emerling BM, et al. Depletion of a putatively druggable class of phosphatidylinositol kinases inhibits growth of p53-null tumors. Cell. 2013;155:844–857. doi: 10.1016/j.cell.2013.09.057. [DOI] [PMC free article] [PubMed] [Google Scholar]
- 22.Lui WO, et al. Expression profiling reveals a distinct transcription signature in follicular thyroid carcinomas with a PAX8-PPAR(gamma) fusion oncogene. Oncogene. 2005;24:1467–1476. doi: 10.1038/sj.onc.1208135. [DOI] [PubMed] [Google Scholar]
- 23.Andersen KM, et al. Thioredoxin Txnl1/TRP32 is a redox-active cofactor of the 26 S proteasome. J Biol Chem. 2009;284:15246–15254. doi: 10.1074/jbc.M900016200. [DOI] [PMC free article] [PubMed] [Google Scholar]
- 24.Gemoll T, et al. HDAC2 and TXNL1 distinguish aneuploid from diploid colorectal cancers. Cell Mol Life Sci. 2011;68:3261–3274. doi: 10.1007/s00018-011-0628-3. [DOI] [PMC free article] [PubMed] [Google Scholar]
- 25.Ni P, et al. TXNL1 Induces Apoptosis in Cisplatin Resistant Human Gastric Cancer Cell Lines. Curr Cancer Drug Targets. 2015;14:850–859. doi: 10.2174/1568009614666141028094612. [DOI] [PubMed] [Google Scholar]
- 26.Buenrostro JD, et al. Single-cell chromatin accessibility reveals principles of regulatory variation. Nature. 2015;523:486–490. doi: 10.1038/nature14590. [DOI] [PMC free article] [PubMed] [Google Scholar]
- 27.Cusanovich DA, et al. Epigenetics. Multiplex single-cell profiling of chromatin accessibility by combinatorial cellular indexing. Science. 2015;348:910–914. doi: 10.1126/science.aab1601. [DOI] [PMC free article] [PubMed] [Google Scholar]
- 28.Hu G, et al. H2A.Z facilitates access of active and repressive complexes to chromatin in embryonic stem cell self-renewal and differentiation. Cell Stem Cell. 2013;12:180–192. doi: 10.1016/j.stem.2012.11.003. [DOI] [PMC free article] [PubMed] [Google Scholar]
- 29.Hu G, et al. Expression and regulation of intergenic long noncoding RNAs during T cell development and differentiation. Nat Immunol. 2013;14:1190–1198. doi: 10.1038/ni.2712. [DOI] [PMC free article] [PubMed] [Google Scholar]
- 30.Kraushaar DC, et al. Genome-wide incorporation dynamics reveal distinct categories of turnover for the histone variant H3.3. Genome biology. 2013;14:R121. doi: 10.1186/gb-2013-14-10-r121. [DOI] [PMC free article] [PubMed] [Google Scholar]
- 31.Mouse EC, et al. An encyclopedia of mouse DNA elements (Mouse ENCODE) Genome Biol. 2012;13:418. doi: 10.1186/gb-2012-13-8-418. [DOI] [PMC free article] [PubMed] [Google Scholar]
- 32.Langmead B, Salzberg SL. Fast gapped-read alignment with Bowtie 2. Nat Methods. 2012;9:357–359. doi: 10.1038/nmeth.1923. [DOI] [PMC free article] [PubMed] [Google Scholar]
- 33.Zhang Y, et al. Model-based analysis of ChIP-Seq (MACS) Genome Biol. 2008;9:R137. doi: 10.1186/gb-2008-9-9-r137. [DOI] [PMC free article] [PubMed] [Google Scholar]
- 34.Robinson MD, McCarthy DJ, Smyth GK. edgeR: a Bioconductor package for differential expression analysis of digital gene expression data. Bioinformatics. 2010;26:139–140. doi: 10.1093/bioinformatics/btp616. [DOI] [PMC free article] [PubMed] [Google Scholar]
- 35.Yanai I, et al. Genome-wide midrange transcription profiles reveal expression level relationships in human tissue specification. Bioinformatics (Oxford, England) 2005;21:650–659. doi: 10.1093/bioinformatics/bti042. [DOI] [PubMed] [Google Scholar]
- 36.Zang C, et al. A clustering approach for identification of enriched domains from histone modification ChIP-Seq data. Bioinformatics. 2009;25:1952–1958. doi: 10.1093/bioinformatics/btp340. [DOI] [PMC free article] [PubMed] [Google Scholar]
- 37.Subramanian A, et al. Gene set enrichment analysis: a knowledge-based approach for interpreting genome-wide expression profiles. Proceedings of the National Academy of Sciences of the United States of America. 2005;102:15545–15550. doi: 10.1073/pnas.0506580102. [DOI] [PMC free article] [PubMed] [Google Scholar]
- 38.McLean CY, et al. GREAT improves functional interpretation of cis-regulatory regions. Nature biotechnology. 2010;28:495–501. doi: 10.1038/nbt.1630. [DOI] [PMC free article] [PubMed] [Google Scholar]
- 39.Li H, et al. The Sequence Alignment/Map format and SAMtools. Bioinformatics. 2009;25:2078–2079. doi: 10.1093/bioinformatics/btp352. [DOI] [PMC free article] [PubMed] [Google Scholar]
Associated Data
This section collects any data citations, data availability statements, or supplementary materials included in this article.


