Abstract
1. Introduction
Measuring ciliary beat frequency (CBF) is a technical challenge and difficult to perform in vivo. Doppler optical coherence tomography (D-OCT) is a mesoscopic non-contact imaging modality that provides high-resolution tomographic images and detects micromotion simultaneously in living tissues. Here we use D-OCT to measure CBF in ex vivo tissue as the first step toward translating this technology to clinical use.
2. Methods
Fresh ex vivo samples of rabbit tracheal mucosa were imaged using both D-OCT and phase-contrast microscopy (n = 5). The D-OCT system was designed and built to specification in our lab (1310 nm swept source vertical-cavity surface-emitting laser (VCSEL), 6 μm axial resolution). The samples were placed in culture and incubated at 37°C. A fast Fourier transform was performed on the D-OCT signal recorded on the surface of the samples to gauge CBF. High-speed digital video of the epithelium recorded via phase-contrast microscopy was analyzed to confirm the CBF measurements.
3. Results
The D-OCT system detected Doppler signal at the epithelial layer of ex vivo rabbit tracheal samples suggestive of ciliary motion. CBF was measured at 9.36 ± 1.22 Hz using D-OCT and 9.08 ± 0.48 Hz using phase-contrast microscopy. No significant differences were found between the two methods (p ≫ 0.05).
4. Conclusions
D-OCT allows for the quantitative measurement of CBF without the need to resolve individual cilia. Furthermore, D-OCT technology can be incorporated into endoscopic platforms that allow clinicians to readily measure CBF in the office and provide a direct measurement of mucosal health.
Keywords: Cilia; Ciliary Motility Disorders; Epithelial Cells; Fiber Optic Technology; Fourier Analysis; Mucociliary Clearance; Mucous Membrane; Nasal Mucosa; Respiratory Mucosa; Tomography, Optical Coherence
1. Introduction
The upper airway is lined by delicate respiratory epithelium, which serves as the first line of defense against inhaled pathogens, allergens, and noxious stimuli. The key mechanical barrier is a layer of mucous continuously cleared from the airway by the rhythmic beating of microscopic cilia on the surface of the epithelial cells. These cilia are approximately 7 microns tall and beat at a native ciliary beat frequency (CBF) estimated to vary from 7 to 16 beats per second (Hz). CBF changes in response to infections, drugs, irritants, temperature, and age, and any prolonged decrease in CBF promotes inflammation and infection in the upper airway.1 Altered CBF and defective mucociliary clearance can be also be seen in diseases such as cystic fibrosis (CF) and chronic obstructive pulmonary disease (COPD) where thickened mucous inhibits ciliary motion.2,3 CBF can also be severely affected in primary ciliary dyskinesia (PCD) due to malformation of ciliary microtubules. Additionally, a significant number of children with primary ciliary dyskinesia may exhibit decreased CBF with normal ciliary ultrastructure.4 CBF is therefore an important indicator of respiratory health.
Currently, CBF measurements are made using ex vivo or in vitro tissue culture. A brush biopsy can be performed of the nasal epithelium and the epithelial cells are grown in a culture dish, or rarely incisional tissue biopsies can be performed. These procedures are moderately invasive and require time-consuming specimen preparation, imaging with specialized microscopes, and data analysis with specialized software. Furthermore, In order to obtain more information on ciliary structural defects, like those found in PCD patients, one must perform electron microscopy on the epithelial tissue. The aforementioned procedures and analysis cannot be performed in vivo and are therefore cannot be incorporated into a quick in office procedure.
Optical Coherence Tomography (OCT) is an emerging imaging modality with minimally invasive in vivo potential to study airway epithelial substructure.5–12 OCT is an interferometer based imaging modality that provides high resolution cross sectional images of living tissues. It has many advantages over other imaging techniques specifically concerning the visualization of living beating cilia. OCT is non-contact and there is no need for dyes or fixatives. Also, OCT uses non-ionizing infrared light that does not damage the delicate epithelial cell layer. Furthermore, OCT has minimally invasive in vivo potential as the laser source can be attached to a small form factor fiber optic probe that can be inserted into the upper airway.13–15
Current work using OCT and related technologies to image cilia has focused on looking at the structural behavior of these subcellular appendages or focused on physiologic variables such as tracking cilia driven fluid flow.16–20 Less attention has been focused on developing this technique as a tool to evaluate CBF in vivo in human subjects. The potential benefit of a simple office based measure to determine CBF is immense as this would aid the clinician in monitoring the progression of airway disease, the overall health of the respiratory epithelium, as well as the response to pharmacologic therapy. Sino-nasal disorders alone cost over $2.4 billion annually and estimations of the indirect costs to society reach the tens of billions of dollars.21 Therefore, monitoring the factors that predispose to or exacerbate airway epithelial dysfunction, such as inhibited ciliary motility, could provide a significant public health benefit.
The challenge with imaging cilia is selecting a technique to either resolve their small size (approximately 7 microns tall) or detect their movement. The axial resolution of most modern OCT devices cannot resolve the small distances covered by the cilium during its complex movement pattern consisting of a power stroke and recovery stroke which may only cover a distance of a few microns.22 An important extension of OCT for functional imaging is Doppler OCT (D-OCT), which allows the examiner to obtain high-resolution tomographic images and detect micromotion simultaneously.23 D-OCT detects the phase shift of the back-scattered light to provide velocity sensitivity. The clinical utility of D-OCT has previously been reported with regards to detection of blood flow and tissue vibration.24–29 It is therefore possible for D-OCT to facilitate detection of microscopic ciliary motion with more moderate axial resolutions. In the present study we demonstrate the application of D-OCT to ex vivo airway epithelial tissue samples in order to detect motion and calculate CBF as the first step towards translating this technology to clinical use.
2. Methods
2.1 OCT System Hardware and Data Acquisition
The key component of the D-OCT system was a swept source vertical-cavity surface-emitting laser (VCSEL). The source features a center wavelength of 1310 nm, with a bandwidth of 100 nm, an average power of 26 mW, and a repetition frequency of 100 kHz. Compared to other swept source laser technologies, VCSEL sources feature a very short cavity length, which is translated to increased imaging range and increased phase stability between adjacent sweeps which allows for improved performance for phase resolved techniques.30 The system will use a Mach-Zehnder interferometer with 90% of the light going to the sample arm and 10% to a static reference mirror. The light from the two arms are recombined with a 50/50 coupler and detected with a high-speed balanced receiver. Figure 1 shows a schematic diagram of the VCSEL D-OCT system. 2-D Cross-sectional images were obtained of the tissue at approximately 6 μm axial resolution and 25 μm lateral resolution at a depth of up to 500 microns and a lateral extent entirely user defined. B-scans were obtained at rates 100 and 200 frames per second (fps), allowing 1,000 and 500 A-lines per frame in the respective linear scans.
Figure 1. VCSEL D-OCT system diagram.
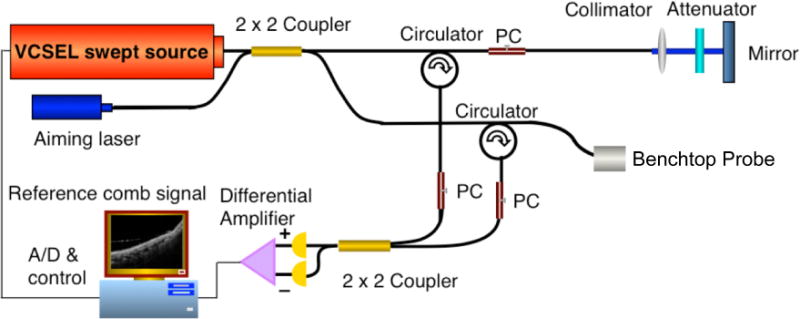
See description in text. PC = polarization controller, A/D = analog to digital convertor.
2.2 Ex vivo Tissue Sample Preparation
Ex vivo tracheal samples were harvested form freshly euthanized 3.4–4.2 kg male New Zealand white rabbits under the regulations of the IACUC at UC Irvine. The tracheae were submerged in buffer solution (Hanks Balanced Salt Solution) and microdissection techniques were used to remove excess soft tissue. The tracheae were maintained at room temperature (21–23°C) for four hours. Then, 1–2 mm thick samples were sectioned from the tracheae and incubated in buffer preheated to 35–37°C with a hotplate for 30 minutes. The samples then were mounted with pins on rubber lined culture dishes with the mucosal surface facing upwards and submerged so that a thin layer of buffer covered the surface of the mucosa. The samples were then immediately transferred to a warmed imaging stage maintained at 35–37°C and imaged with D-OCT. After the scanning, the samples were then fixed in 10% formalin for 30 minutes and imaged again with D-OCT. All samples were imaged at both 100 fps and 200 fps.
2.3 Determining CBF Imaged Using D-OCT by Fourier Analysis
Algorithms written in MATLAB were employed to calculate CBF measurements from the periodic Doppler signal detected in the ex vivo tissue samples. Doppler data was calculated from the raw OCT image data as previously described31. This processed D-OCT image set in the time domain underwent two fast Fourier transforms (FFT, Equation 1) to obtain Doppler images and extract frequency information. The first FFT was performed in the wavenumber domain to calculate depth information of the OCT signal in each A-line. The Doppler phase shift (ΔΦ) at each element in the A-line was then calculated using Equation 2. The phase shift result was unwrapped by assigning all values greater than π as π, and all values less than −π as −π, as shown in Equation 3. With the Doppler phase shift data, the sums of the ΔΦ in each element of an A-line were then calculated (Equation 4); these values were analyzed to determine a threshold that was used to eliminate background speckle noise. The threshold was applied to each A-line to visualize regions of movement in the tissue. The locations of such regions were determined automatically in MATLAB and were overlaid onto the structural OCT images to locate the corresponding regions in the tissue. In order to account for the gross movement of the tissue sample due to environmental disturbances, the mean phase shift of all elements in the A-line was subtracted from each element of the A-line. This method allowed the use of the tissue as a reference against which to measure relative motion of tissue sub-structures. Additionally, in each A-line, the mean of the remaining phase shift was calculated and the second FFT was performed, resulting in a frequency power spectrum. The sum of the power spectra of all A-lines was then calculated to allow the determination of the dominant peaks, which indicated the most common frequencies in the tissue sample.
To visualize the Doppler images, a bidirectional Doppler visualization mode with a blue-to-red colormap ranging from −π to π was assigned to ΔΦ The positive value of ΔΦ represented movement toward the source, while the negative value of ΔΦ corresponded to movement away from the source.
| Equation 1 |
| Equation 2 |
| Equation 3 |
| Equation 4 |
2.4 Validation of CBF Measured from D-OCT using Phase-contrast Microscopy
As the standard optical method of CBF measurement, phase-contrast microscopy was used to confirm D-OCT results. All tissue samples were observed with an inverted microscope (Axiovert 10, Carl Zeiss, Germany) equipped with a Zeiss long working distance phase 2 contrast objective (32 ×, n.a. 0.4) after each incubation period in order to confirm ciliary beat frequency measurements from D-OCT. Ciliary movement was recorded using a high speed digital camera (iPhone 6, Apple, California) at 240 fps. CBF was calculated from the digital video using custom algorithms written in MATLAB. Five regions of interest from each sample were selected manually using this program (Figure 2), and an FFT was performed in the time domain to yield a frequency power spectrum (Figure 3A).
Figure 2. CBF analysis using phase-contrast microscopy at 32× magnification.
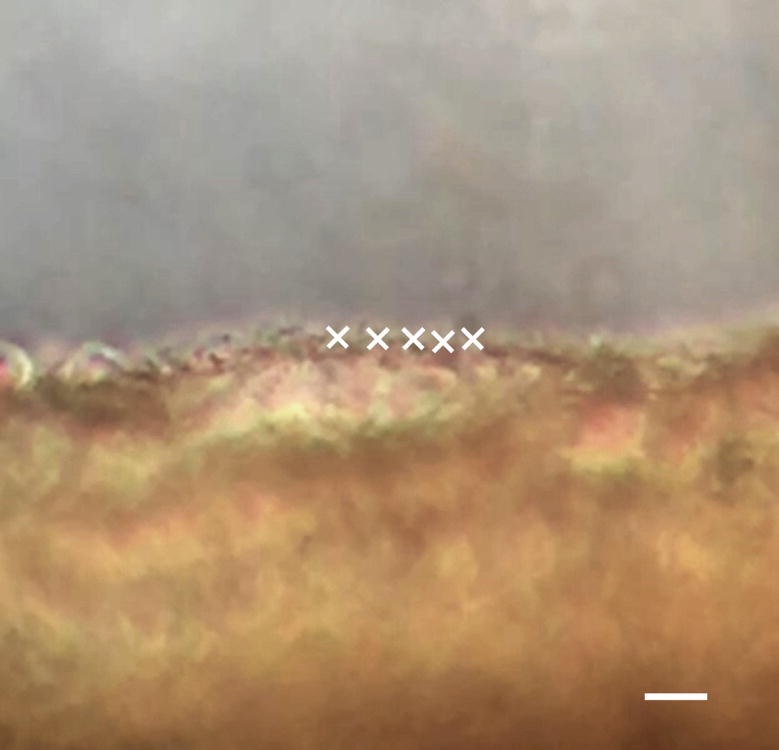
This is a cropped image segmented from a high speed digital video recorded at 240 fps using phase-contrast microscopy. The MATLAB program developed in the lab allows the user to manually select points of interest along the ciliated epithelium, as indicated by the white X’s. The scale bar indicates 10 μm.
Figure 3. Phase-contrast microscopy FFT results.
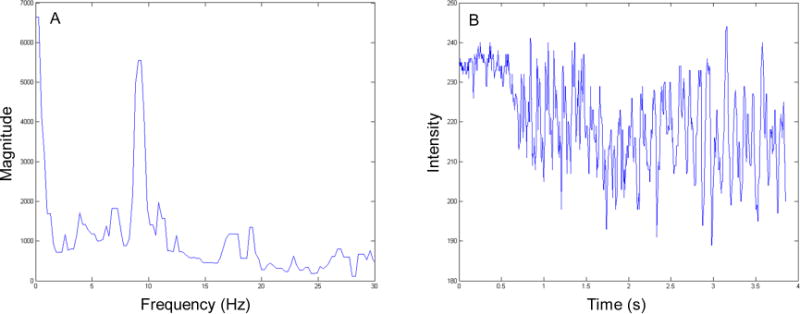
(A) The corresponding frequency power spectrum from the selected points shown in Figure 2 showing a peak magnitude frequency of approximately 9 Hz. (B) The change in intensity in time domain plotted to assist the user in determining the characteristic frequency at the points of interest. The pixel intensity fluctuates with ciliary motion.
3. Results
3.1 Structural imaging of tracheal epithelium
Figure 4 illustrates the tracheal mucosal substructure resolvable with VCSEL OCT in comparison to histology. A single cell layer of pseudostratified respiratory epithelium forms a dark band on the surface of the tissue sample, with an inferiorly located bright band indicating the lamina propria of the tracheal mucosa. The D-OCT analysis was focused on the surface of the epithelial cell layer where the cilia reside.
Figure 4. Functional anatomy of rabbit tracheal mucosa.
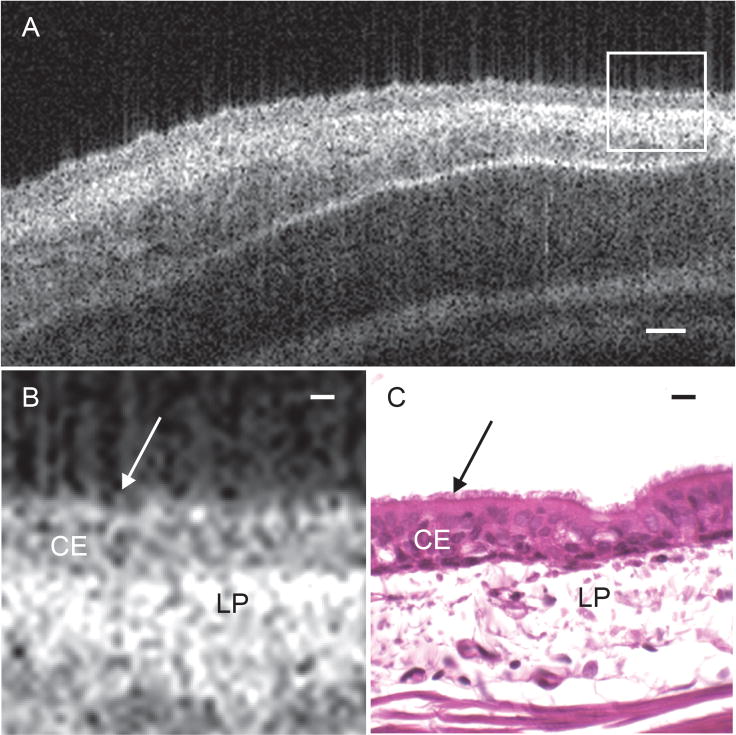
(A) Cropped OCT B-scan captures a 2D-crossectional image of ex vivo rabbit tracheal mucosal tissue at approximately 6 μm axial resolution and 25 μm lateral resolution. (B) Magnified region outlined in white box of tracheal mucosa in figure 4(A) to show tissue substructure. (C) Corresponding histology of rabbit tracheal mucosa. Arrows indicate the surface of the epithelial layer where the cilia reside. CE = ciliated epithelium, LP = lamina propria. Scale bar in (A) indicates 50 μm. Scale bars in (B) and (C) indicate 10 μm
3.2 Doppler Detection of Mucosal Ciliary Motion
Although individual cilia cannot be resolved with the resolution of our system, microscopic motion is detected by measuring phase shift of the back scattered light from the tissue sample. Figure 5 shows Doppler signal obtained from a B-scan of a rabbit tracheal ex vivo sample at 35–37°C. The MATLAB algorithm is able to localize noticeable Doppler phase shift along the surface of the mucosal tissue, indicating the present of ciliary motion. This Doppler phase shift signal not only occupies the surface but also extends below into the epithelial layer, which is a one cell-layer thick pseudostratified columnar epithelium. Figure 6 shows one A-line through the tissue in M-mode with time along the x-axis. The Doppler phase shift demonstrates red and blue areas indicative of periodic vertical motion on the surface of the tissue sample. No Doppler signals were detected at the surface of the tissue sample incubated in 10% formalin.
Figure 5. Location of detected D-OCT signal overlaid on structural image.
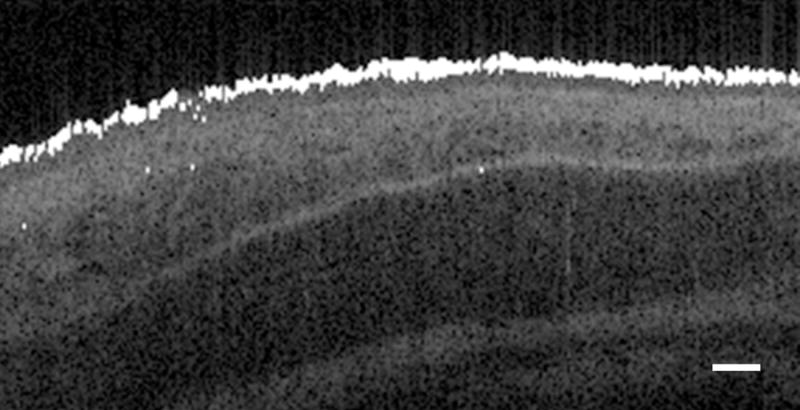
White pixels indicate regions of detected Doppler phase shift signal, which correspond with ciliary motion at the surface of the mucosa. The scale bar indicates 50 μm.
Figure 6. A single D-OCT A-line visualized in M-mode.
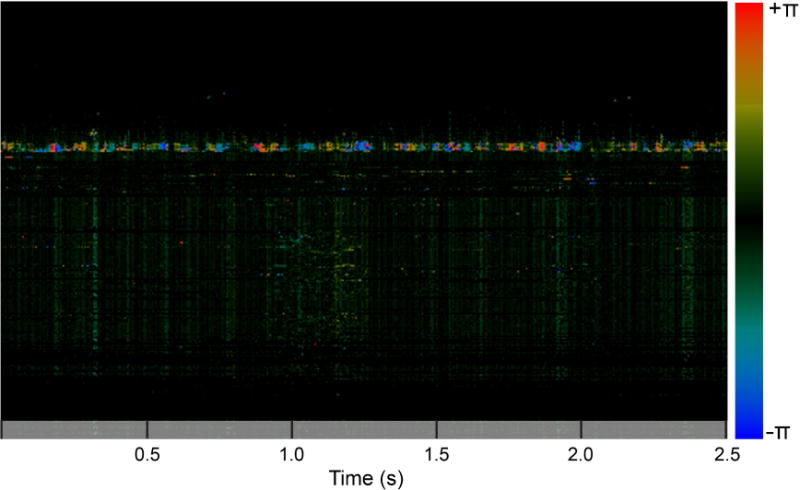
Notice the periodic change in Doppler shift over time corresponding to a CBF of approximately 9 Hz. The magnitude of the phase shift is indicated by color: red indicates velocity toward the laser source, and blue indicates velocity away from the laser source.
3.3 CBF Analysis
Five ex vivo tissue samples were collected from 3 different tracheal specimens and were analyzed using both D-OCT and phase-contrast microscopy. When the FFT was performed on the Doppler signals at the surface of the tissue samples at physiologic temperature (37–39°C), the frequencies with the highest magnitude were 8.80 Hz, 10.80 Hz, 10.80 Hz, 8.60 Hz, and 7.80 Hz, and the mean was 9.36 ± 1.22 Hz. Figure 7 shows the frequency power spectrum measured at physiologic temperature with a clearly defined peak magnitude frequency of approximately 9 Hz. The mean CBF value measured under the phase-contrast microscopy was 9.08 ± 0.48 Hz. A 2-tailed t test was performed, and no significant difference was found between the two methods (p ≫ 0.05).
Figure 7. D-OCT FFT results.
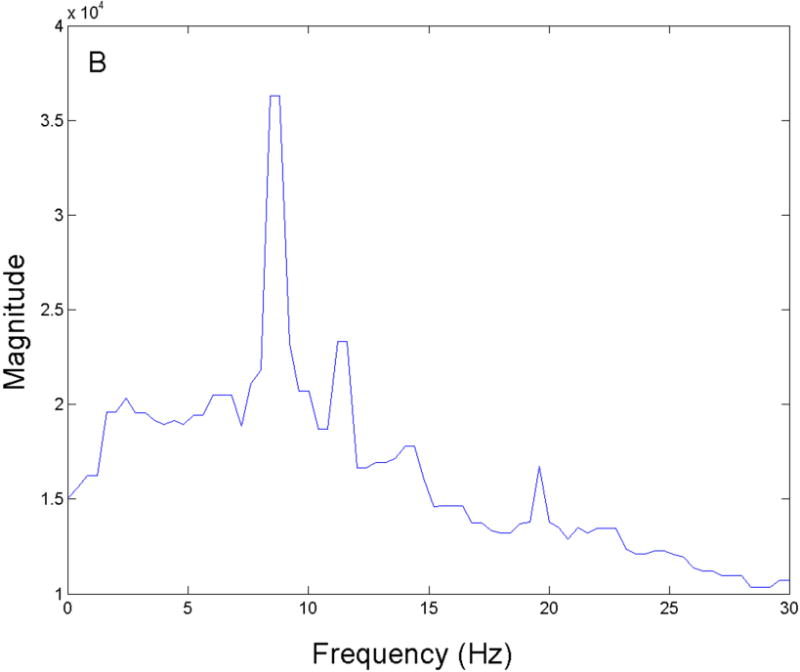
An FFT was performed on the D-OCT signals and the resulting power spectra were summed across all A-lines to measure the highest magnitude frequency present at the surface of the ex vivo rabbit tracheal sample. A peak with the strongest magnitude was measured at approximately 9 Hz.
4. Discussion
To our knowledge, this is the first study using D-OCT to detect and calculate CBF on the surface of ex vivo tracheal mucosal tissue samples. When compared to histology, it was observed that D-OCT phase shift signal was only detected at the surface of the mucosa, indicating the location of cilia motion. Ideally, the axial resolution of an OCT device used to analyze the respiratory epithelium should be able to resolve individual cilia; however, the increased capability and sensitivity to motion afforded by Doppler phase shift analysis allows the detection of ciliary motion without the need to resolve cilia structure directly. Furthermore, the Doppler signal was detected in a region larger than expected for the size of cilia (approximately 7 μm tall) and instead covered a range that corresponded with the epithelial cell layer (approximately 30–50 μm tall). Up to 200 beating cilia are located at the surface of each epithelial cell and each cilium is intimately connected to the cytoskeleton of the underlying cell via the basal body.32 As Doppler allows for higher axial resolution, any transferred motion from the basal body to the epithelial cell layer may be detected.
One limitation of D-OCT is that it cannot detect motion transverse to the laser source. While previous studies have reported that cilia beat in a complex pattern consisting of a forward power stroke and a sideway sweeping recovery stroke, other studies have argued that both the power stroke and recovery stroke occur in the same vertical plane.33 D-OCT is therefore ideal for identifying this vertical motion, as indicated by the periodic motion detected in the D-OCT M-mode images as shown in Figure 5. Although detection of the transverse motion of cilia was not the focus of this study, analyzing Doppler variance has the potential to detect such transverse components of the ciliary beat pattern.34 This technique will be especially useful for in vivo studies to allow detection of all components of the complex ciliary beat pattern.
The VCSEL D-OCT device measured a CBF value at physiologic temperature of approximately 9 Hz, which is similar to that reported in other ex vivo tissue studies.35,36 Pharmacologic agents and temperature are known to augment CBF in ex vivo mucosal samples; although we diminished CBF using 10% formalin, we also expect D-OCT to reproduce the known correlation between temperature or pharmacological agents and CBF reported in the literature.37–39 In the future, the ability of D-OCT to monitor changes in CBF due to these conditions will be evaluated ex vivo and in vivo.
A major challenge of D-OCT detection of ciliary motion is the discontinuous distribution of motile cilia along the airway mucosal surface.22 As verified by phase-contrast microscopy, some areas of the ex vivo tracheal sections had small patches of stationary or slow-moving cilia. During phase-contrast microscopy, the tissue samples are viewed lengthwise, and the cilia along the incised edge of the sample are analyzed to calculate CBF. It is unclear if these regions of decreased ciliary motion are caused by damage to the epithelial layer during ex vivo tissue sample preparation or are present in vivo. The D-OCT scans are performed in the center of the tissue samples. During the D-OCT scanning trials, the cross sectional B-scans obtained may contain these regions of slow-moving cilia which will broaden the lower frequency peaks in the power spectra obtained from the Fourier analysis.
5. Conclusion
Cilia play a crucial role in protecting the airway from pathogens and irritants, and CBF has been demonstrated to be an important physiologic measure of overall respiratory mucosal health. The measurement of CBF has the potential to provide the clinician with a new tool to track the progression of upper airway diseases, such as CF and PCD, and provide quantitative outcomes of airway therapies rather than gauging patient symptomatology. D-OCT technology allows for the estimation of CBF in ex vivo tissue samples without the need to resolve individual cilia at a modest axial resolution of approximately 6 μm. The VCSEL D-OCT system detected Doppler signal at the surface of ex vivo rabbit tracheal samples suggestive of ciliary motion. Calculating the highest magnitude frequency of the periodic Doppler signal at the surface of the mucosal tissue served as a good estimation of CBF as verified by phase-contrast microscopy. The long term objective of our group is to develop and translate this technology to be used in a clinical setting particularly employing the D-OCT technique, which has many advantages in the elimination of large scale motion and tremor. This is an active area of research for us, and we are focused on developing instrumentation to use D-OCT to measure and map CBF in vivo in an office based setting.
Figure 8. Comparison of CBF measurement by D-OCT and phase-contrast microscopy.
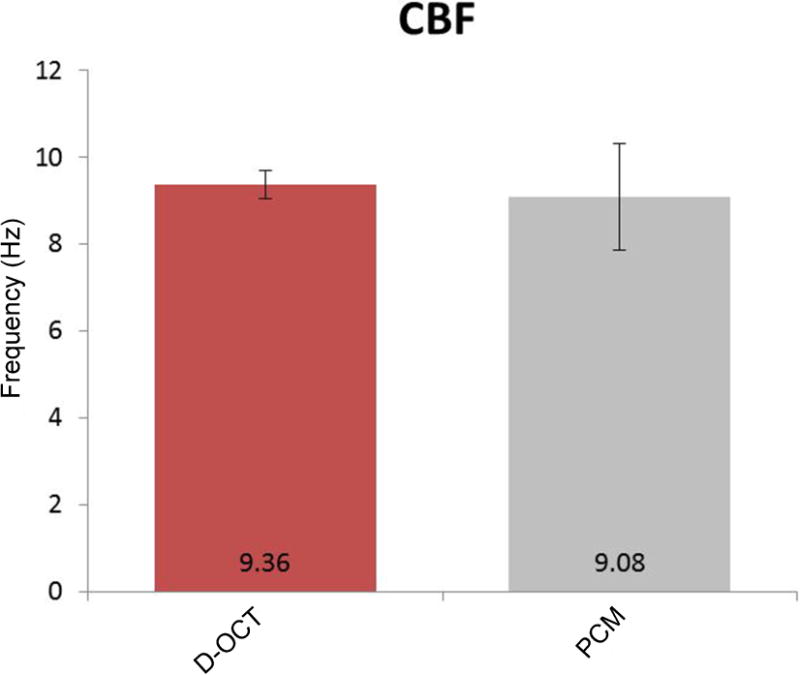
At physiologic temperature, CBF was measured at 9.36 ± 1.22 Hz using D-OCT and 9.08 ± 0.48 Hz using phase-contrast microscopy (n = 5). No significant differences were found between the two methods. Each error bar represents ±1 standard deviation. PCM = phase-contrast microscopy.
Acknowledgments
This work is based on research supported by the National Heart, Lung, And Blood Institute of the National Institutes of Health (NHLBI-NIH) under award numbers: R01HL-103764, R01HL-105215, R01HL-125084. The content is solely the responsibility of the authors and does not necessarily represent the official views of the NIH. The authors would also like to thank Ms. Tanya Burney and Mr. David Yoon for their assistance in harvesting tissue samples and Dr. Tatiana Krasieva for her assistance with phase contrast microscopy. Institutional support from the Beckman Laser Institute Endowment is also gratefully acknowledged.
Funding source: National Heart, Lung, and Blood Institute of the National Institutes of Health (NHLBI-NIH) under award numbers: R01HL-103764, R01HL-105215, R01HL-125084
Footnotes
Financial Disclosures: Dr. Zhongping Chen has a financial interest in OCT Medical Inc., which however, did not support this work. The authors wish to report no other financial disclosures.
References
- 1.Workman AD, Cohen NA. The effect of drugs and other compounds on the ciliary beat frequency of human respiratory epithelium. Am J Rhinol Allergy. 2014;28(6):454–464. doi: 10.2500/ajra.2014.28.4092. [DOI] [PubMed] [Google Scholar]
- 2.Regnis JA, Robinson M, Bailey DL, et al. Mucociliary clearance in patients with cystic fibrosis and in normal subjects. Am J Respir Crit Care Med. 1994;150(1):66–71. doi: 10.1164/ajrccm.150.1.8025774. [DOI] [PubMed] [Google Scholar]
- 3.Smaldone GC, Foster WM, O’Riordan TG, et al. Regional impairment of mucociliary clearance in chronic obstructive pulmonary disease. Chest. 1993;103(5):1390–1396. doi: 10.1378/chest.103.5.1390. [DOI] [PubMed] [Google Scholar]
- 4.Buchdahl RM, Reiser J, Ingram D, et al. Ciliary abnormalities in respiratory disease. Archives of disease in childhood. 1988;63(3):238–243. doi: 10.1136/adc.63.3.238. [DOI] [PMC free article] [PubMed] [Google Scholar]
- 5.Kaiser ML, Rubinstein M, Vokes DE, et al. Laryngeal epithelial thickness: a comparison between optical coherence tomography and histology. Clin Otolaryngol. 2009;34:460–466. doi: 10.1111/j.1749-4486.2009.02005.x. [DOI] [PMC free article] [PubMed] [Google Scholar]
- 6.Ridgway JM, Su J, Wright R, et al. Optical Coherence Tomography of the Newborn Airway. Annals of Otology, Rhinology & Laryngology. 2008;117:327–334. [PMC free article] [PubMed] [Google Scholar]
- 7.Ridgway JM, Ahuja G, Guo S, et al. Imaging of the Pediatric Airway Using Optical Coherence Tomography. Laryngoscope. 2007;117:2206–2212. doi: 10.1097/MLG.0b013e318145b306. [DOI] [PubMed] [Google Scholar]
- 8.Ridgway JM, Armstrong WB, Guos, et al. In Vivo Optical Coherence Tomography of the Human Oral Cavity and Oropharynx. Arch Otolaryngol Head Neck Surg. 2006;132:1074–1081. doi: 10.1001/archotol.132.10.1074. [DOI] [PubMed] [Google Scholar]
- 9.Mahmood U, Hanna HM, Han S, et al. Evaluation of Rabbit Tracheal Inflammation Using Optical Coherence Tomography. Chest. 2006;130:863–868. doi: 10.1378/chest.130.3.863. [DOI] [PubMed] [Google Scholar]
- 10.Mahmood U, Ridgway JM, Jackson R, et al. In Vivo Optical Coherence Tomography of the Nasal Mucosa. Am J Rhinol. 2006;20(2):155–159. [PubMed] [Google Scholar]
- 11.Burns JA, Kim KH, de Boer JF, et al. Polarization-sensitive optical coherence tomography imaging of benign and malignant laryngeal lesions: an in vivo study. Otolaryngol Head Neck Surg. 2011;145(1):91–99. doi: 10.1177/0194599811403078. [DOI] [PubMed] [Google Scholar]
- 12.Shakhov AV, Terentjeva AB, Kamensky VA, et al. Optical coherence tomography monitoring for laser surgery of laryngeal carcinoma. J Surg Oncol. 2001;77(4):253–258. doi: 10.1002/jso.1105. [DOI] [PubMed] [Google Scholar]
- 13.Lin JL, Yau AY, Boyd J, et al. Real-time subglottic stenosis imaging using optical coherence tomography in the rabbit. JAMA Otolaryngology Head Neck Surgery. 2013;139(5):502–509. doi: 10.1001/jamaoto.2013.2643. [DOI] [PMC free article] [PubMed] [Google Scholar]
- 14.Volgger V, Sharma GK, Jing JC, et al. Long-range Fourier domain optical coherence tomography of the pediatric subglottis. Int J Pediatr Otorhinolaryngol. 2015;79(2):119–126. doi: 10.1016/j.ijporl.2014.11.019. [DOI] [PMC free article] [PubMed] [Google Scholar]
- 15.Lazarow FB, Ahuja GS, Chin Loy A, et al. Intraoperative long range optical coherence tomography as a novel method of imaging the pediatric upper airway before and after adenotonsillectomy. Int J Pediatr Otorhinolaryngol. 2015;79(1):63–70. doi: 10.1016/j.ijporl.2014.11.009. [DOI] [PMC free article] [PubMed] [Google Scholar]
- 16.Oldenburg AL, Chhetri RK, Hill DB, et al. Monitoring airway mucus flow and ciliary activity with optical coherence tomography. Biomedical Optics Express. 2012;3(9):1978–92. doi: 10.1364/BOE.3.001978. [DOI] [PMC free article] [PubMed] [Google Scholar]
- 17.Liu L, Chu KK, Houser GH, et al. Method for quantitative study of airway functional microanatomy using micro-optical coherence tomography. PLoS One. 2013;8(1):e54473. doi: 10.1371/journal.pone.0054473. [DOI] [PMC free article] [PubMed] [Google Scholar]
- 18.Liu L, Shastry S, Byan-Parker S, et al. An autoregulatory mechanism governing mucociliary transport is sensitive to mucus load. Am J Respir Cell Mol Biol. 2014;51(4):485–493. doi: 10.1165/rcmb.2013-0499MA. [DOI] [PMC free article] [PubMed] [Google Scholar]
- 19.Huang BK, Gamm UA, Jonas S, et al. Quantitative optical coherence tomography imaging of intermediate flow defect phenotypes in ciliary physiology and pathophysiology. J Biomed Opt. 2015;20(3):030502. doi: 10.1117/1.JBO.20.3.030502. [DOI] [PMC free article] [PubMed] [Google Scholar]
- 20.Jonas S, Bhattacharya D, Khokha MK, et al. Microfluidic characterization of cilia-driven fluid flow using optical coherence tomography-based particle tracking velocimetry. Biomed Opt Express. 2011;2(7):2022–2234. doi: 10.1364/BOE.2.002022. [DOI] [PMC free article] [PubMed] [Google Scholar]
- 21.Kaliner MA, Osguthorpe JD, Fireman P, et al. Sinusitis: bench to bedside: current findings, future directions. J Allergy Clin Immunol. 1997;99:S829–848. [PubMed] [Google Scholar]
- 22.Sanderson MJ, Sleigh MA. Ciliary activity of cultured rabbit tracheal epithelium: beat pattern and metachrony. Journal of Cell Science. 1981;47:331–347. doi: 10.1242/jcs.47.1.331. [DOI] [PubMed] [Google Scholar]
- 23.Chen Z, Milner TE, Dave D, et al. Optical Doppler tomographic imaging of fluid flow velocity in highly scattering media. Opt Lett. 1997;22:64–66. doi: 10.1364/ol.22.000064. [DOI] [PubMed] [Google Scholar]
- 24.Zhao Y, Chen Z, Saxer C, Xiang S, de Boer JF, Nelson JS. Phase-resolved optical coherence tomography and optical Doppler tomography for imaging blood flow in human skin with fast scanning speed and high veocity sensitivity. Opt Lett. 2000;25:114–116. doi: 10.1364/ol.25.000114. [DOI] [PubMed] [Google Scholar]
- 25.Zhao YH, Brecke KM, Ren HW, Ding ZH, Nelson JS, Chen ZP. Three-dimensional reconstruction of in vivo blood vessels in human skin using phase-resolved optical Doppler tomography. Ieee J Sel Top Quant. 2001;7(6):931–5. [Google Scholar]
- 26.Ren H, Breke MK, Ding Z, et al. Imaging and quantifying transverse flow velocity with the Doppler bandwidth in a phase-resolved functional optical coherence tomography. Opt Lett. 2002;27:409–411. doi: 10.1364/ol.27.000409. [DOI] [PubMed] [Google Scholar]
- 27.Kennedy BF, Wojtkowski M, Szkulmowski M, et al. Improved measurement of vibration amplitude in dynamic optical coherence elastography. Biomedical Optics Express. 2012;3(12):3138–3152. doi: 10.1364/BOE.3.003138. [DOI] [PMC free article] [PubMed] [Google Scholar]
- 28.Miura M, Hong YJ, Yasuno Y, et al. Three-dimensional Vascular Imaging of Proliferative Diabetic Retinopathy by Doppler Optical Coherence Tomography. Am J Ophthalmol. 2014;159(3):528–538. doi: 10.1016/j.ajo.2014.12.002. [DOI] [PubMed] [Google Scholar]
- 29.Lee HY, Raphael PD, Park J, et al. Noninvasive in vivo imaging reveals differences between tectorial membrane and basilar membrane traveling waves in the mouse cochlea. Proc Natl Acad Sci U S A. 2015;112(10):3128–3133. doi: 10.1073/pnas.1500038112. [DOI] [PMC free article] [PubMed] [Google Scholar]
- 30.Jayaraman V, Jiang J, Potsaid B, et al. Design and performance of broadly tunable, narrow line-width, high repetition rate 1310nm VCSELs for swept source optical coherence tomography. Proc SPIE. 2012:82760D. [Google Scholar]
- 31.Liu G, Chen Z. Advances in Doppler OCT. Chin Opt Lett. 2013;11(1):011702. doi: 10.3788/col201311.011702. [DOI] [PMC free article] [PubMed] [Google Scholar]
- 32.Satir P, Sleigh MA. The physiology of cilia and muco-ciliary interactions. Annu Rev Physiol. 1990;52:137–155. doi: 10.1146/annurev.ph.52.030190.001033. [DOI] [PubMed] [Google Scholar]
- 33.Chilvers MA, O’Callaghan C. Analysis of ciliary beat pattern and beat frequency using digital high speed imaging: comparison with the photomultiplier and photodiode methods. Thorax. 2000;55:314–317. doi: 10.1136/thorax.55.4.314. [DOI] [PMC free article] [PubMed] [Google Scholar]
- 34.Yu LF, Chen ZP. Doppler variance imaging for three-dimensional retina and choroid angiography. J Biomed Opt. 2010;15(1):016029. doi: 10.1117/1.3302806. [DOI] [PMC free article] [PubMed] [Google Scholar]
- 35.DePoortere D, Kofonow JM, Chen B, et al. Murine Ciliotoxicity and Rabbit Sinus Mucosal Healing by Polyhydrated Ionogen. Otolaryngol Head Neck Surg. 2011;145(3):482–488. doi: 10.1177/0194599811399558. [DOI] [PubMed] [Google Scholar]
- 36.Bailey KL, Bonasera SJ, Wilderdyke M, et al. Aging causes a slowing in ciliary beat frequency, mediated by PKCε. Am J Physiol Lung Cell Mol Physiol. 2014;306(6):L584–589. doi: 10.1152/ajplung.00175.2013. [DOI] [PMC free article] [PubMed] [Google Scholar]
- 37.Christopher AB, Ochoa S, Krushansky E, et al. The effects of temperature and anesthetic agents on ciliary function in murine respiratory epithelia. Front Pediatr. 2014;2:111. doi: 10.3389/fped.2014.00111. [DOI] [PMC free article] [PubMed] [Google Scholar]
- 38.Zhang L, Han D, Sanderson MJ. Effect of isoproterenol on the regulation of rabbit airway ciliary beat frequency measured with high-speed digital and fluorescence microscopy. Ann Otol Rhinol Laryngol. 2005;114(5):399–403. doi: 10.1177/000348940511400512. [DOI] [PubMed] [Google Scholar]
- 39.Matsuura S, Shirakami G, Iida H, et al. The effect of sevoflurane on ciliary motility in rat cultured tracheal epithelial cells: a comparison with isoflurane and halothane. Anesth Analg. 2006;102(6):1703–1708. doi: 10.1213/01.ane.0000216001.36932.a3. [DOI] [PubMed] [Google Scholar]


