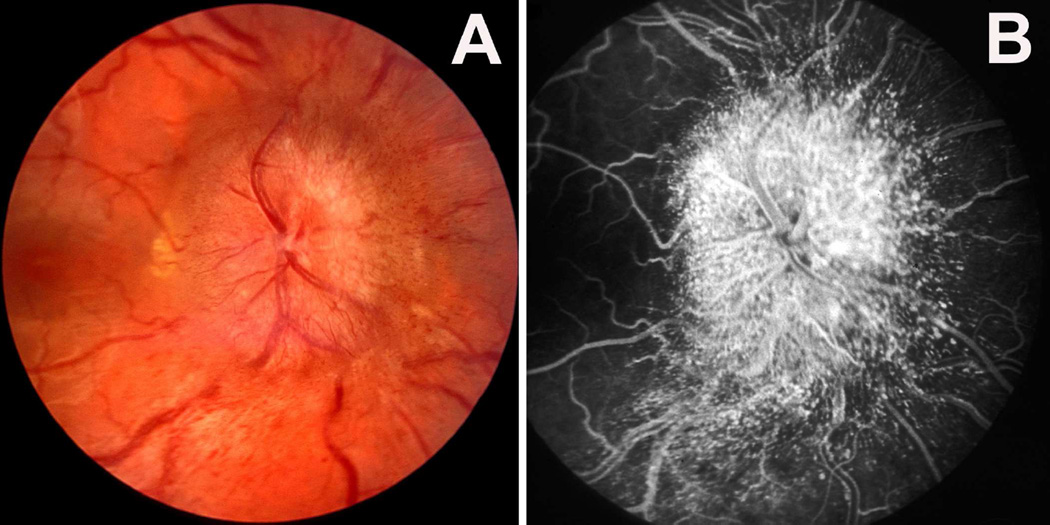
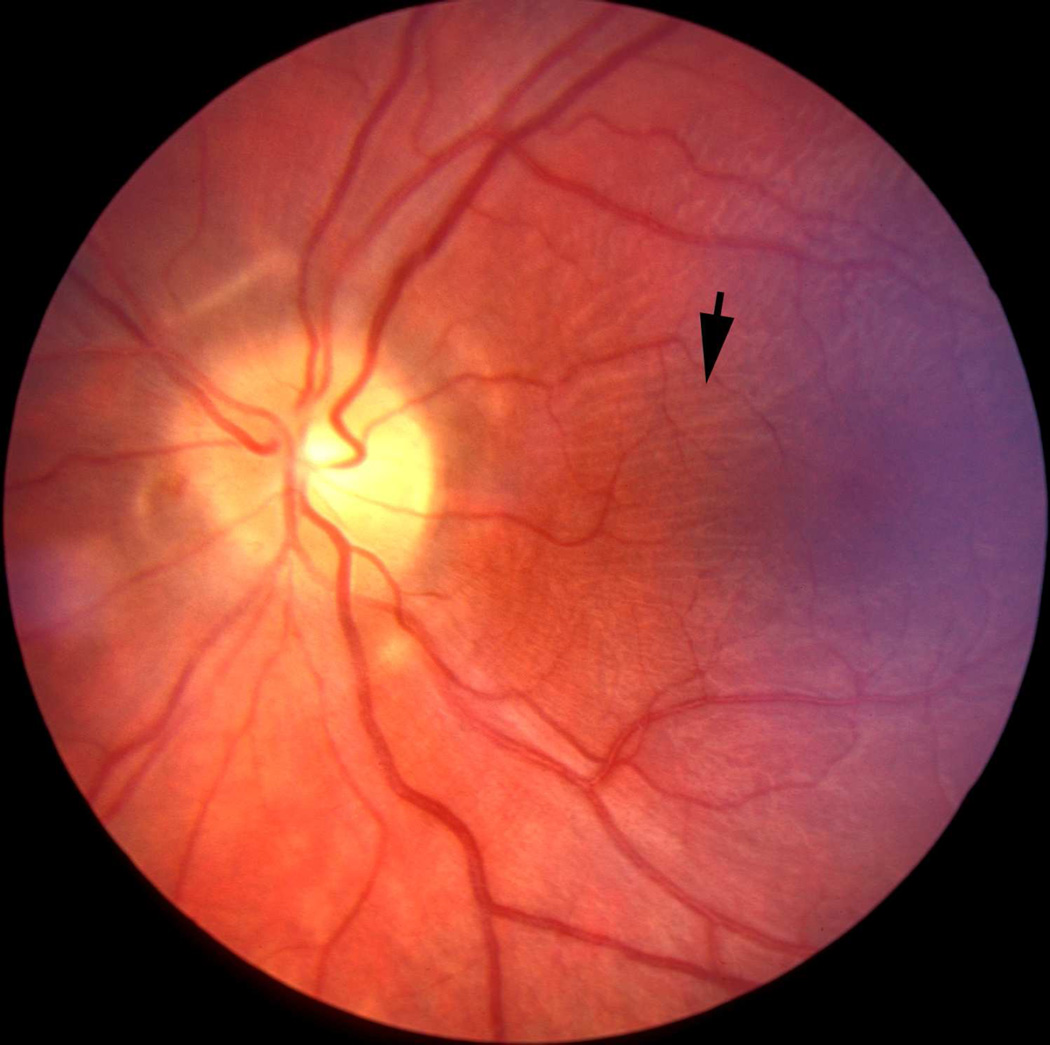
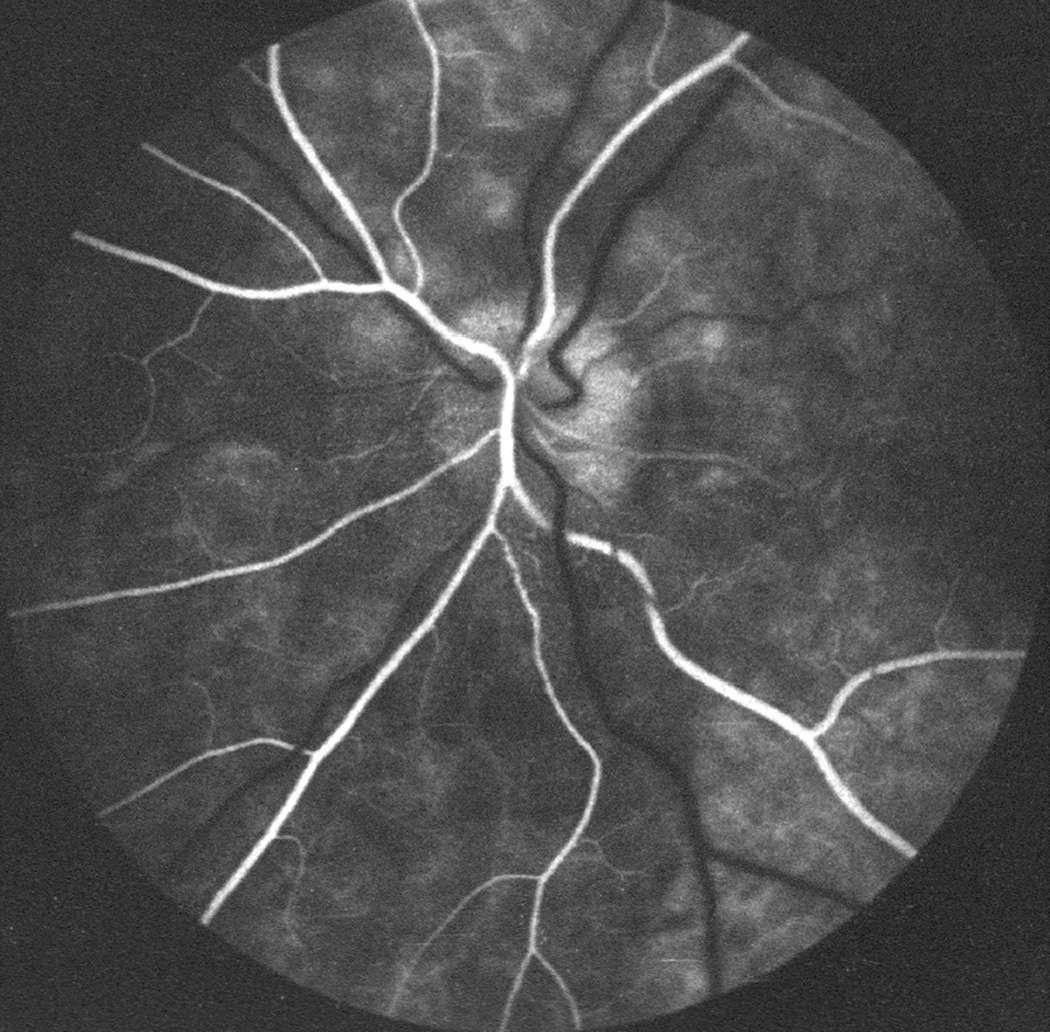
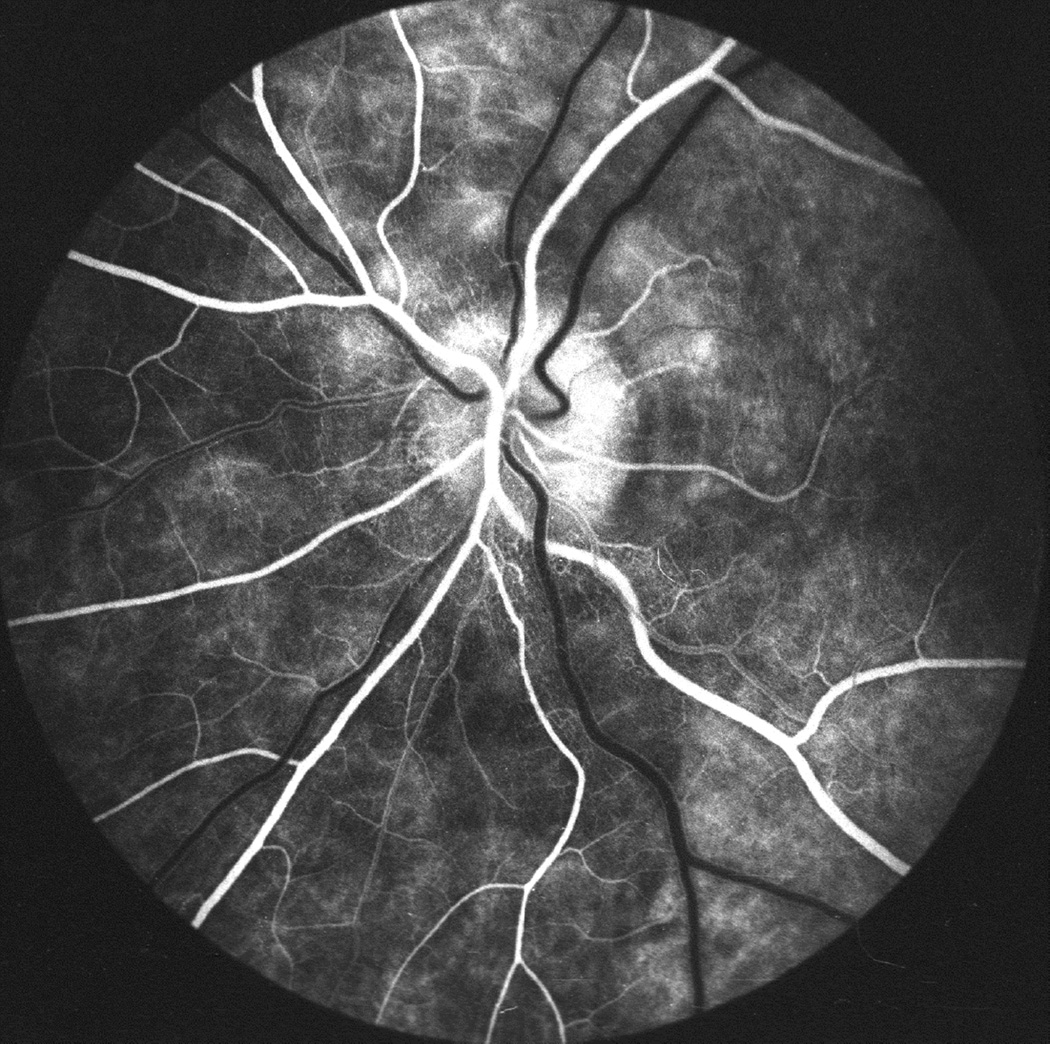
Abstract
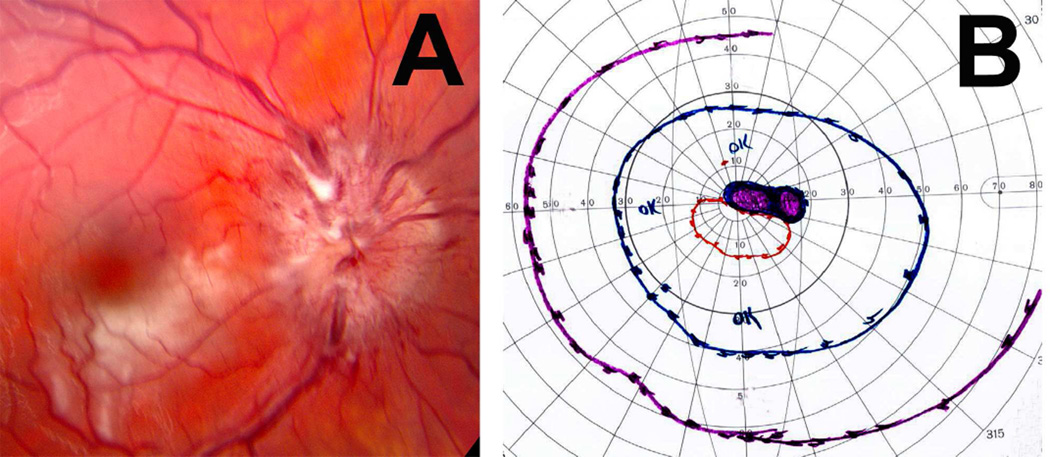
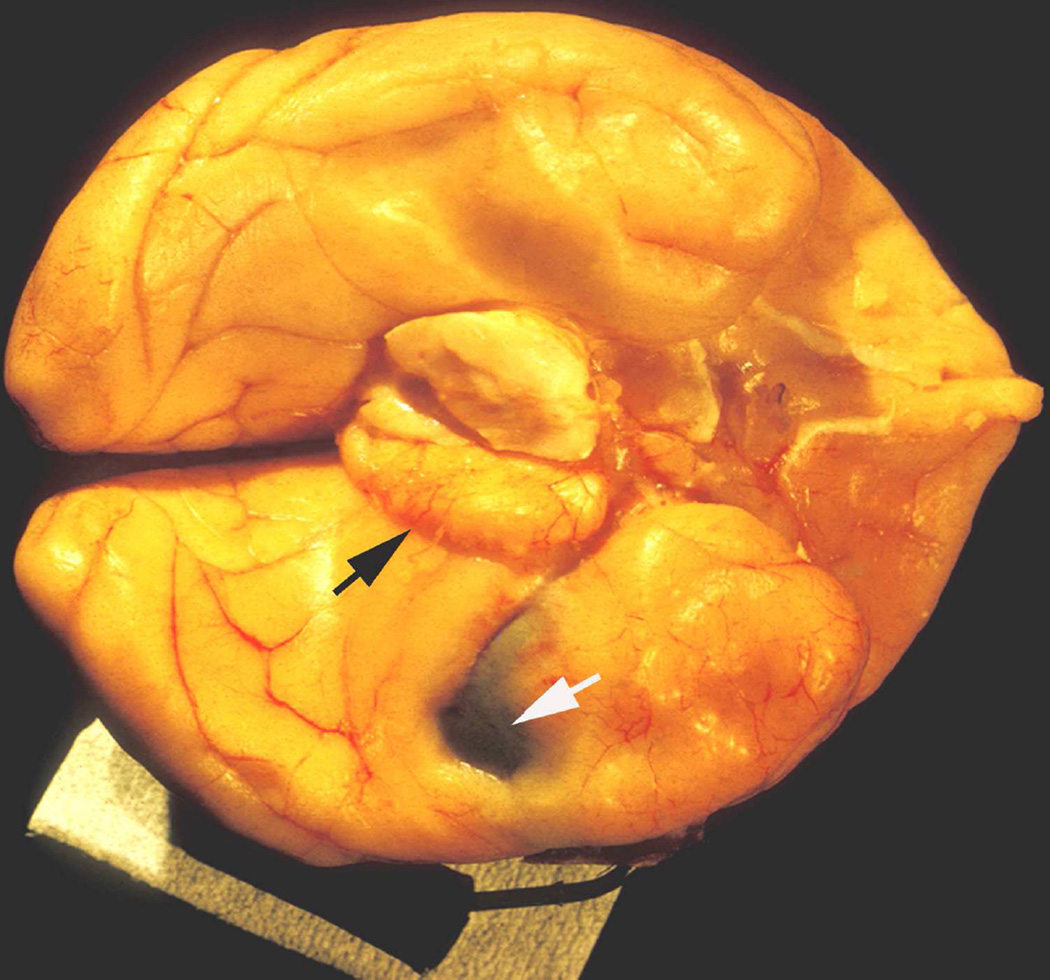
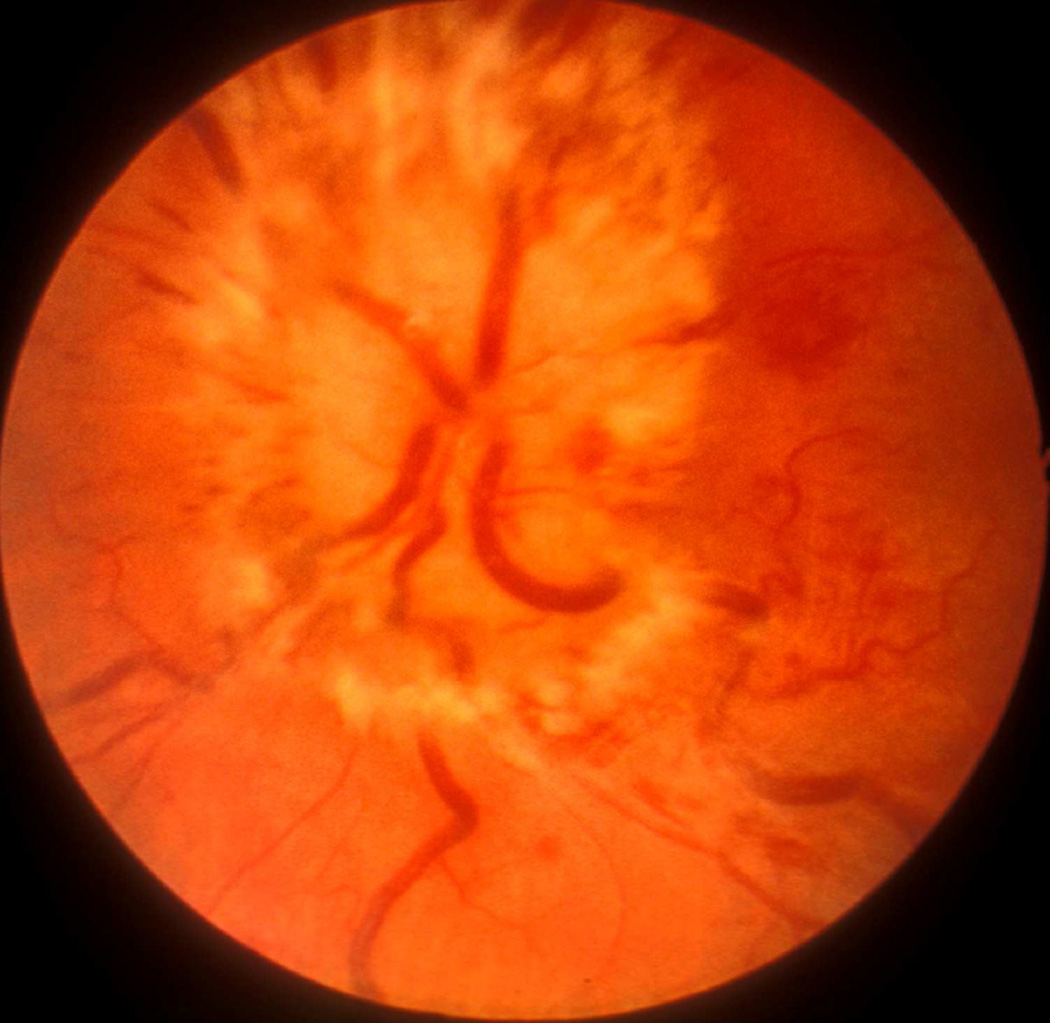
Optic disc edema in raised intracranial pressure was first described in 1853. Ever since, there has been a plethora of controversial hypotheses to explain its pathogenesis. I have explored the subject comprehensively by doing basic, experimental and clinical studies. My objective was to investigate the fundamentals of the subject, to test the validity of the previous theories, and finally, based on all these studies, to find a logical explanation for the pathogenesis. My studies included the following issues pertinent to the pathogenesis of optic disc edema in raised intracranial pressure: the anatomy and blood supply of the optic nerve, the roles of the sheath of the optic nerve, of the centripetal flow of fluids along the optic nerve, of compression of the central retinal vein, and of acute intracranial hypertension and its associated effects. I found that, contrary to some previous claims, an acute rise of intracranial pressure was not quickly followed by production of optic disc edema. Then, in rhesus monkeys, I produced experimentally chronic intracranial hypertension by slowly increasing in size space-occupying lesions, in different parts of the brain. Those produced raised cerebrospinal fluid pressure (CSFP) and optic disc edema, identical to those seen in patients with elevated CSFP. Having achieved that, I investigated various aspects of optic disc edema by ophthalmoscopy, stereoscopic color fundus photography and fluorescein fundus angiography, and light microscopic, electron microscopic, horseradish peroxidase and axoplasmic transport studies, and evaluated the effect of opening the sheath of the optic nerve on the optic disc edema. This latter study showed that opening the sheath resulted in resolution of optic disc edema on the side of the sheath fenestration, in spite of high intracranial CSFP, proving that a rise of CSFP in the sheath was the essential pre-requisite for the development of optic disc edema. I also investigated optic disc edema with raised CSFP in patients, by evaluating optic disc and fundus changes by stereoscopic fundus photography and fluorescein fundus angiography.
Based on the combined information from all the studies discussed above, it is clear that the pathogenesis of optic disc edema in raised intracranial pressure is a mechanical phenomenon. It is primarily due to a rise of CSFP in the optic nerve sheath, which produces axoplasmic flow stasis in the optic nerve fibers in the surface nerve fiber layer and prelaminar region of the optic nerve head. Axoplasmic flow stasis then results in swelling of the nerve fibers, and consequently of the optic disc. Swelling of the nerve fibers and of the optic disc secondarily compresses the fine, low-pressure venules in that region, resulting in venous stasis and fluid leakage; that leads to the accumulation of extracellular fluid. Contrary to the previous theories, the various vascular changes seen in optic disc edema are secondary and not primary. Thus, optic disc edema in raised CSFP is due to a combination of swollen nerve fibers and the accumulation of extracellular fluid.
My studies also provided information about the pathogeneses of visual disturbances in raised intracranial pressure.
1. Introduction
Optic disc edema in raised intracranial pressure was first described in 1853, independently, by Türck and by Coccius. Since then, numerous conflicting theories have been put forward by “masterminds” in ophthalmology and neurology to explain its pathogenesis. So there was no dearth of highly controversial hypotheses to explain it, but none of them was proven valid when I started to investigate the pathogenesis of optic disc edema in raised intracranial pressure in 1961. Since then I have explored the subject comprehensively by doing basic, experimental and clinical studies. My objective was to investigate the fundamentals of the subject, to test the validity of the previous theories, and finally, based on all these studies, to find a logical explanation for the pathogenesis. Following is a brief account of my studies and my conclusions.
2. Terminologies Used for Optic Disc Edema in Raised Intracranial Pressure in the Literature
Over the years, many terms have been used in the literature for optic disc edema in raised intracranial pressure; these have been influenced by the various postulated pathogeneses.
Von Graefe in 1866 called it “Stauungspapille”, because he thought that strangulation of the optic nerve at the scleral ring played an important role in its causation. Allbutt (1871, 1872) later described it as “choked disc” (the English equivalent of “Stauungspapille”). With the advent of the inflammatory theory, Gowers in 1879 called it “optic neuritis” – it is not uncommon to find this term still being used for any type of optic disc edema. In 1879 Parinaud suggested the term “optic disc edema”, in 1881 Jackson “swelling of the disc”, in 1908 Parsons “papilledema”, and in 1927 Traquair “plerocephalic edema”. To confuse the issue of terminology further, Elschnig (1894,1895), Uhthoff (1904), and Parsons (1908) suggested that swelling of the optic disc, should be called “optic neuritis” if less than 2 diopters, and “choked disc” or “papilledema” if more than that. That criterion seems irrational because it implies that every case of “choked disc” / “papilledema” is initially optic neuritis, when in fact the two conditions are basically different.
Briggs in 1676 called the optic disc a “papilla” under an erroneous impression. He stated that: “as the radii of a cone coming from different parts are meeting in an apex of the cone, similarly the described fibres (of the retina) do the same at the exit of the optic nerve and produced there a papilla”. It has long ago been well-established that the normal optic disc is not only a flat structure, but also usually has a central cup – the opposite of a papilla. So the term “papilledema” is a misnomer. It is unfortunate that “papilledema” is still commonly used and aggressively propagated. Strangely, some have argued that if optic disc edema is due to raised intracranial pressure, then it should be called “papilledema”, but if it is due to other causes, then it should be called “optic disc edema”. This seems illogical because there is no difference in the appearance of the optic disc in the two conditions. It is logical to use a common term of “optic disc edema” for all of them. In my studies I have used the term “optic disc edema”. Some have suggested the term "optic nerve head edema", but that is not an appropriate, because the term "optic disk edema" is an ophthalmic and stereoscopic term, and it also describes the region involved by edema in raised intracranial pressure. "Optic nerve head” on the other hand, comprises the surface nerve fiber layer, and prelaminar, lamina cribrosa and immediate retrolaminar regions; edema in raised intracranial pressure does not involve the lamina cribrosa and retrolaminar regions
3. Review of the Postulated Theories
Since Türck in 1853 first postulated his theory to explain the pathogenesis of edema of the optic disc in intracranial tumors, a tremendous amount of literature has accumulated on the subject. Most of the relevant literature is old and several of these theories are based more on armchair philosophy than on any systemic scientific study of the subject. Following is a list of various postulated theories.
3.1. Mechanical Theories
Türck suggested in 1853 that the retinal hemorrhages in cerebral tumors were due to stasis in the cavernous sinus caused by the raised intracranial pressure. Similarly von Graefe in 1860 stated that a brain tumor pressed on the cavernous sinus, choking the blood in the retinal veins and caused edema of the optic disc. Since then the following mechanical theories have been postulated.
3.1.1. Compression of intracranial venous sinuses
3.1.2. Compression of the central retinal vein and the role of raised blood pressure in the central retinal vein
3.1.3. Alterations in the blood pressure of the central artery of the retina
3.1.4. Congestion and stasis in capillaries of the Circle of Haller and Zinn
3.1.5. Blockage of the centripetal flow of fluids along the optic nerve
3.1.6. Direct compression of the optic nerve fibres
3.1.7. Edema of the optic disc associated with degeneration of the posterior spinal nerve roots
3.1.8. Forcing of the cerebrospinal fluid into the optic nerve
3.1.9. Forcing of the cerebrospinal fluid from the third ventricle into the optic nerve
3.1.10. Ocular hypotension responsible for edema of the optic disc
3.1.11. Diminished amplitude of cerebral pulsation causing optic disc edema
3.2. Non-Mechanical Theories
3.2.1. Optic disc edema as a manifestation of cerebral edema
3.2.2. Vasomotor theory
3.2.3. Inflammatory theory
3.2.4. Physicochemical theory
3.3. Combination of a large number of factors mentioned above
It is beyond the scope of this paper to discuss all of these theories, even briefly. I have discussed all of them at length elsewhere (Hayreh 1965a, 1968). If one wades through the huge literature on these theories, one is often reminded of the words of Langley (1899). “Those who have occasion to enter into the depths of what is oddly, if generously, called the literature of a scientific subject, alone know the difficulty of emerging with an unsoured disposition … …. Much that he is forced to read consists of a record of defective experiments, confused statements of results, wearisome description of detail, and unnecessarily protracted discussion of unnecessary hypotheses.” This truly applies to the pathogenesis of optic disc edema in raised intracranial pressure.
4. My Studies on the Pathogenesis of Optic Disc Edema in Raised Intracranial Pressure
In order to reach an in-depth understanding of the pathogenesis of optic disc edema in intracranial hypertension, I investigated it systematically by the following comprehensive studies: (i) First of all, it was crucial to understand the various basic issues involved in the development of optic disc edema in raised intracranial pressure. (ii) As discussed above, a host of theories about pathogenesis of optic disc edema in raised intracranial pressure had been put forward since 1853; therefore, I felt it was essential to test the validity of as many of them as possible. (iii) I investigated the effects of, first, acute intracranial hypertension, and, next, slowly progressive, chronic raised intracranial pressure by space occupying lesions. (iv) Having successfully produced optic disc edema by chronically elevated intracranial pressure, I evaluated the various aspects of optic disc edema in raised intracranial pressure by using different methods. (v) Finally, based on the information drawn from all these studies, I determined the pathogenesis of optic disc edema in raised intracranial pressure. Following is a brief account of all these studies, and my conclusions about pathogenesis of optic disc edema in raised intracranial pressure.
Since most of my studies were experimental, it was essential to use an experimental animal from which the findings would be directly applicable to the human. Keeping that in view, I first explored the relevant anatomy of the optic nerve and its blood supply, and vascular pattern of the entire orbit in rhesus monkeys. I had previously investigated the blood supply of the eye, optic nerve and the entire orbit in humans [Singh (Hayreh) and Dass 1960a,b; Hayreh and Dass 1962a,b; Hayreh 1962, 1963a,b,c)]. My studies in rhesus monkeys showed that their orbital and optic nerve blood supply (Hayreh 1964a) and structure of the optic nerve (Hayreh 1965a; Hayreh and Vrabec 1966) were identical to that in man. Therefore, the rhesus monkey was the ideal experimental animal for the various studies that I conducted for investigation of optic disc edema in raised intracranial hypertension.
4.1. The Sheath of the Optic Nerve
In 1806 Tenon described the sheath of the optic nerve and the sclera of the eyeball as being continuous with the dura. He also demonstrated the continuity of the enclosed spaces of the sheath with the cranial spaces; this has since been confirmed by a large number of workers in different animals. Most of the postulated theories on the pathogenesis of optic disc edema in raised intracranial pressure deal with the role of the sheath of the optic nerve. In view of that, as a part of my investigation of the pathogenesis of optic disc edema in raised intracranial pressure, I investigated the sheath of the optic nerve by comprehensive anatomical studies in 20 normal rhesus monkeys, 80 human cadavers, and in rabbits. The findings are discussed in detail elsewhere (Hayreh 1965a, 1984). I found that in rhesus monkeys and human the size of the dural sheath and the subarachnoid space varied markedly in different regions of the optic nerve, as is evident from the following.
4.1.1. Immediately behind the eyeball
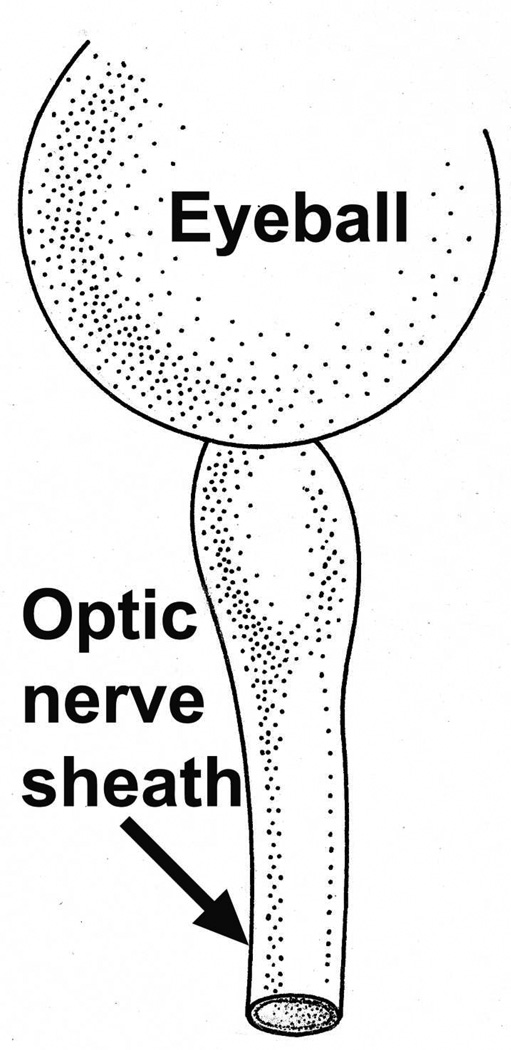
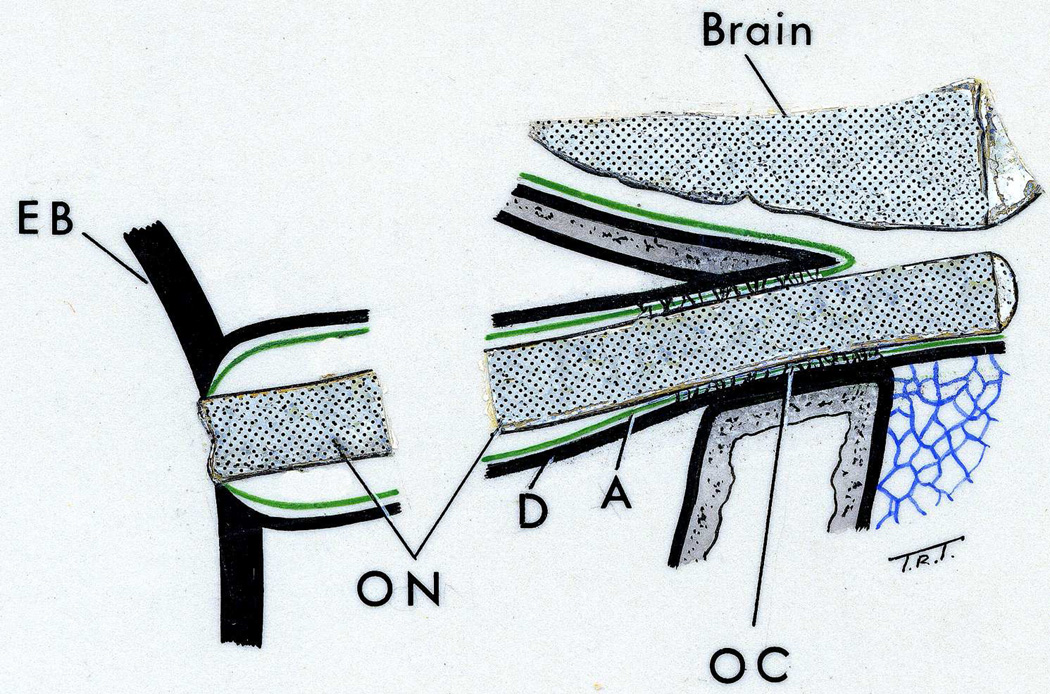
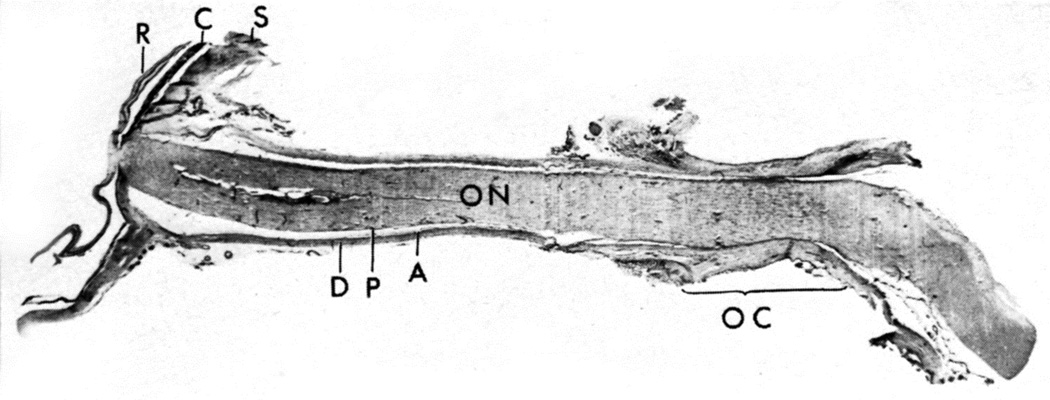
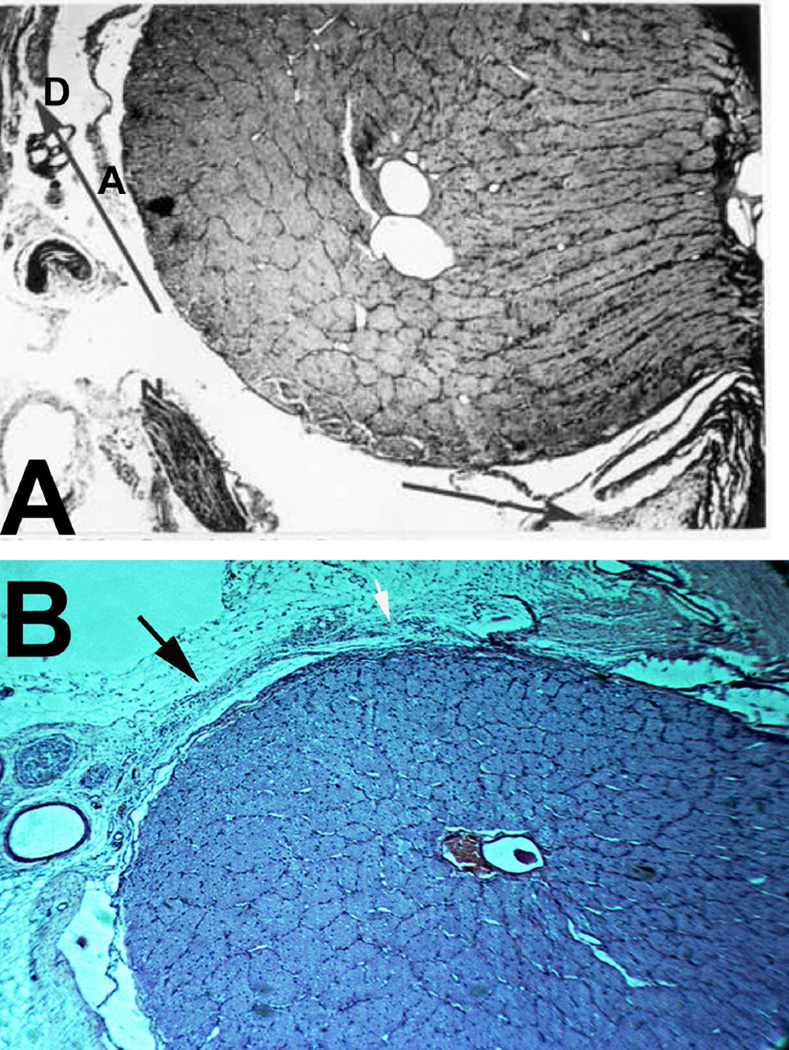
The sheath was biggest in size there, with a much bigger subarachnoid space between the optic nerve and the sheath than anywhere else in its course; consequently the sheath in this region, when distended by accumulation of the cerebrospinal fluid, has a bulbous appearance (Figs. 1–3). In more than 200 rhesus monkeys, to investigate various ocular vascular occlusive disorders experimentally, I exposed the optic nerve and its dural sheath by lateral orbitotomy for experimental occlusion of the various ocular blood vessels. In all of these normal animals, the sheath was always distended in this region, and on cutting the sheath open, the accumulated cerebrospinal fluid gushed out. All these animals had normal cerebrospinal fluid. This fact has important clinical significance. This normally distended part of the optic nerve sheath behind the eyeball has universally and erroneously been described as “a sign of raised cerebrospinal fluid pressure”. One has to remember that the dural layer of the optic nerve sheath is not an elastic tissue but a thick fibrous tissue, which cannot be distended at all even by an extremely high cerebrospinal fluid pressure. Therefore, from routine examination of the sheath by various methods, it is not possible to distinguish whether the distended sheath behind the eyeball is a normal finding or due to raised cerebrospinal fluid pressure.
Fig. 1.
Sheath of the optic nerve showing its bulbous part behind the eyeball. Reproduced from Hayreh (1965a).
Fig. 3.
Schematic diagram showing various regions of the sheath of the optic nerve (Abbreviations as in figure 2; EB = eyeball). (Reproduced from Hayreh SS. 1965a).
4.1.2. Posterior to the loose and bulbous part
The sheath was much smaller in size, with very narrow subarachnoid space, and the sheath was wrapped around the optic nerve (Figs. 1,2,3).
Fig. 2.
Longitudinal section of a normal human optic nerve showing the sheath in its different parts. Abbreviations: A= Arachnoid; C = Choroid; D = Dura, OC = Optic canal; ON = Optic nerve; P = Pia; R = Retina; S = Sclera. (Reproduced from Hayreh SS. 1965a)
4.1.3. In the region of the optic canal
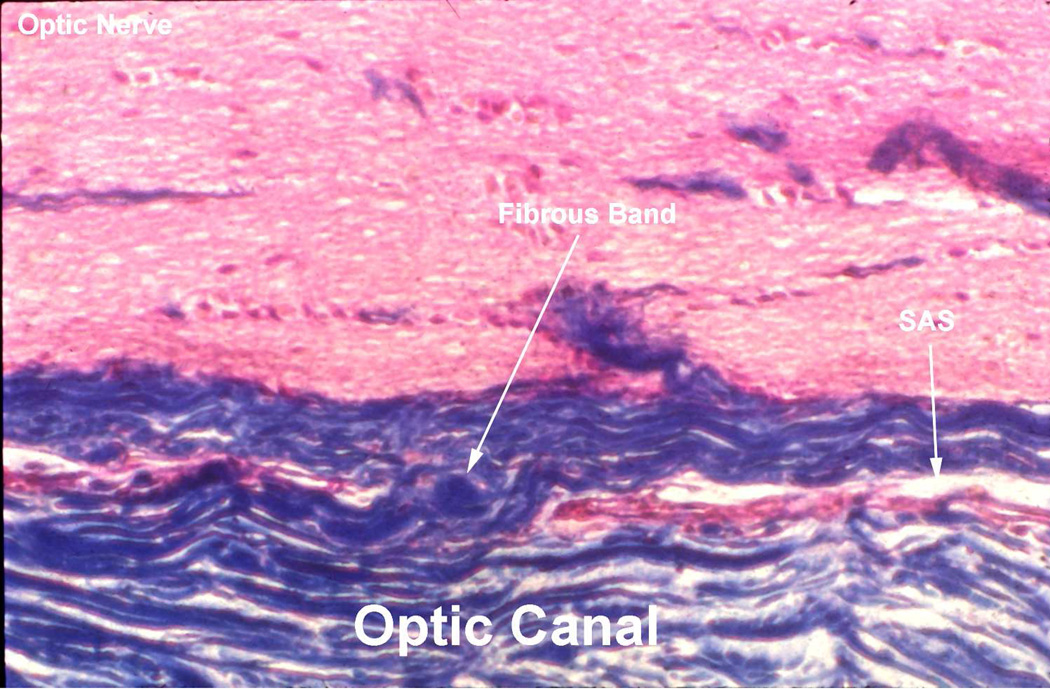
The space was narrowest here, with thick fibrous bands stretching from the dura mater (which forms the periosteum in this region) to the optic nerve - so that the space assumed the character of a trabecular meshwork formed by the closely knit fibrous septa in the canal, as well as the subarachnoid and subdural spaces, reduced to almost a capillary size in this region (Figs. 3,4). The adhesions between the optic nerve and the surrounding dura in the region of the optic canal were more marked in the human, although there were individual variations; rarely there were only a few adhesions. Communication between the subarachnoid spaces of the cranial cavity and of the sheath was almost always seen; however, the extent of communication in the optic canal showed wide variation from one specimen to another. The anatomy of the sheath of the optic nerve in the region of the optic canal has great clinical importance.
-
(i)
This plays a crucial role in the dynamics of conveying the cerebrospinal fluid pressure of the cranial cavity into the sheath of the optic nerve in cases of raised intracranial pressure. To reach the orbital part of the sheath, the cerebrospinal fluid has to percolate through the capillary, meshed trabecular network formed by the adhesions in the region of the optic canal. This has two implications. (a) Unilateral or bilateral absence of edema of the optic disc or variations in its degree with the same level of cerebrospinal fluid pressure may be due to a difference in the facility of its transmission from the cranial cavity forwards into the optic canal. It is possible that rarely, due to some pathology in the region, the canal may be completely closed, so that intracranial pressure cannot be transmitted into the optic nerve sheath; this would result in absence of disc edema on that side in spite of raised cerebrospinal fluid pressure. (b) When cerebrospinal fluid pressure starts to rise, it takes some time for the elevated pressure to reach the same level in the sheath as in the cranial cavity because of this hindrance in the optic canal. The reasons for optic disc edema not developing immediately in these cases are discussed below.
-
(ii)
Because thick fibrous tissue bands connect the optic nerve to the periosteum in the canal (Fig. 3,4), a fracture in the optic canal region can also tear the optic nerve.
Fig. 4.
Longitudinal section of the optic nerve in the rhesus monkey in the region of the optic canal, shows a capillary subarachnoid space (SAS) and fibrous band connecting the optic nerve with the surrounding sheath. (Reproduced from Hayreh SS. 1965a).
In contrast to the above findings in the rhesus monkeys and man, in rabbits, there were practically no adhesions in the optic canal and there was no looseness of the sheath behind the eyeball found in monkey and man; the sheath formed a more or less uniform tube around the optic nerve. Thus, the anatomy of the optic nerve sheath in rabbits is very different from that in man and monkey. This fact has to be borne in mind in any study in rabbits, related to the optic nerve sheath.
Due to the looseness of the sheath near the eyeball and the space available here, in intracranial hemorrhages, blood which enters the sheath from the cranial cavity tends to collect much more in this region behind the eyeball than in the posterior orbital part, and very little collects in the region of the optic canal because of the capillary size of the space in the canal. This large anterior collection of blood in the sheath of the optic nerve has sometimes erroneously been regarded as of local origin, secondary to the intracranial hemorrhage.
The important role played by optic nerve sheath fenestration in optic disc edema due to raised intracranial pressure is discussed below.
4.2. Centripetal Flow of Fluids along the Optic Nerve
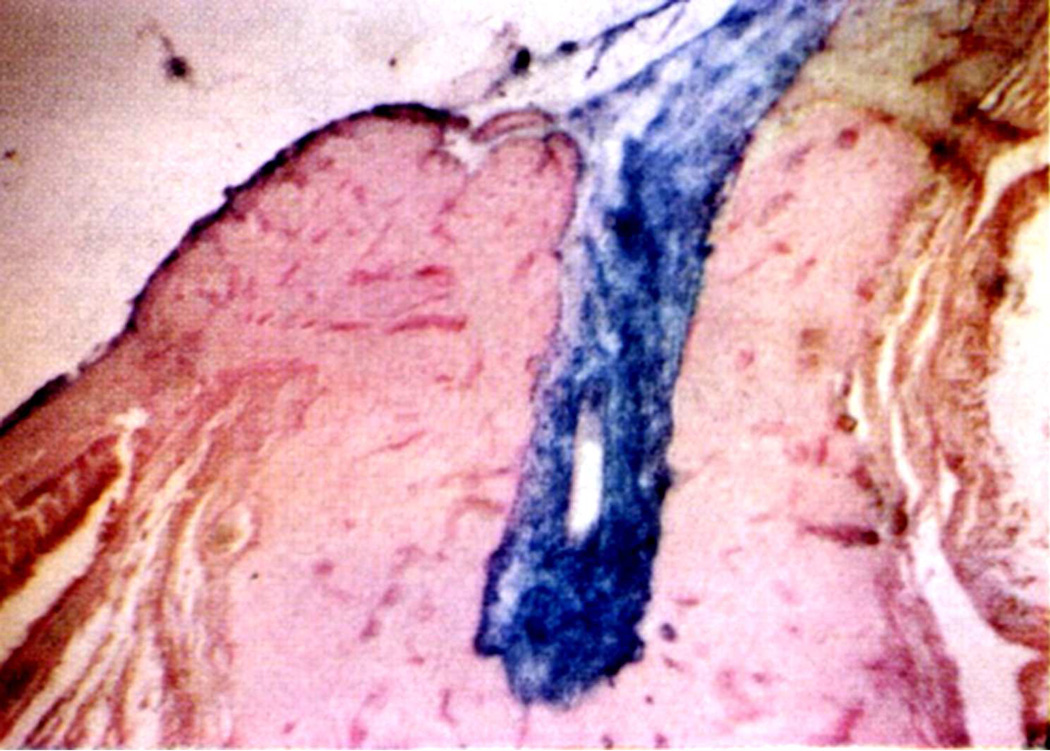
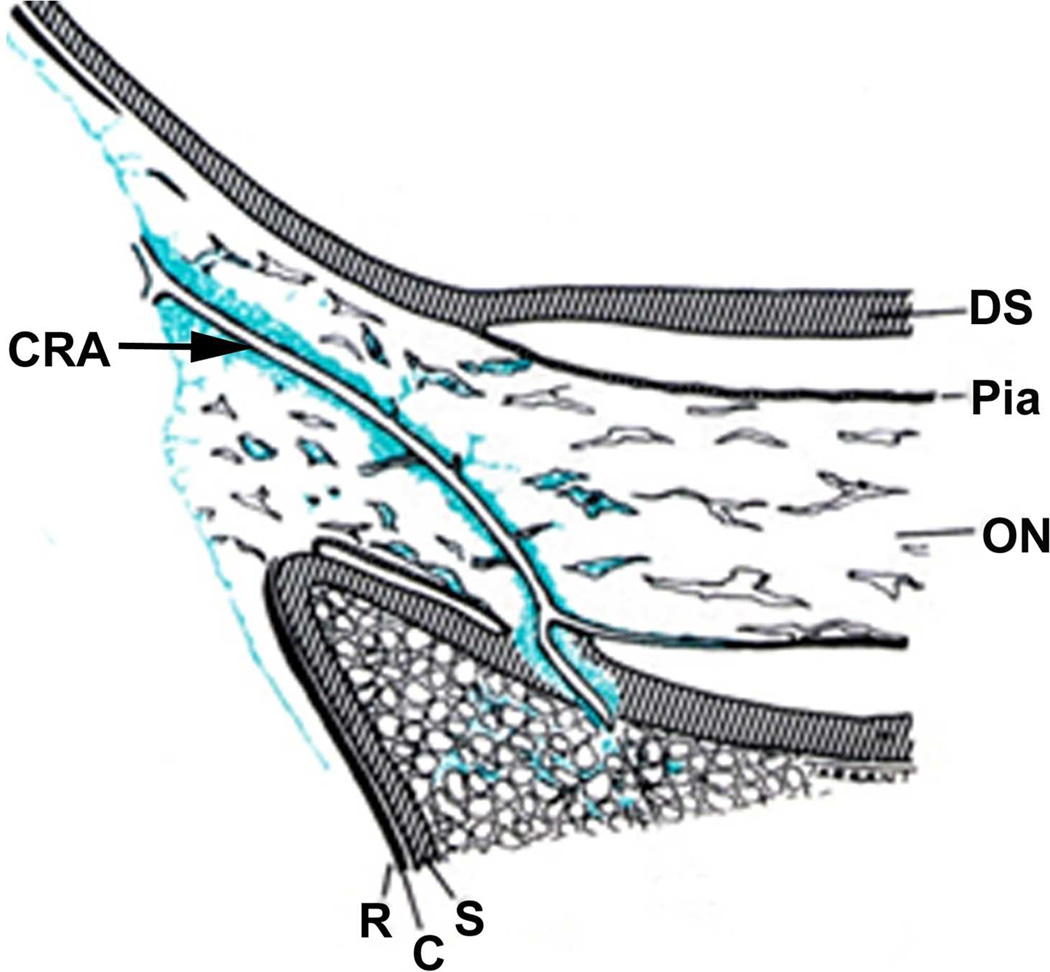
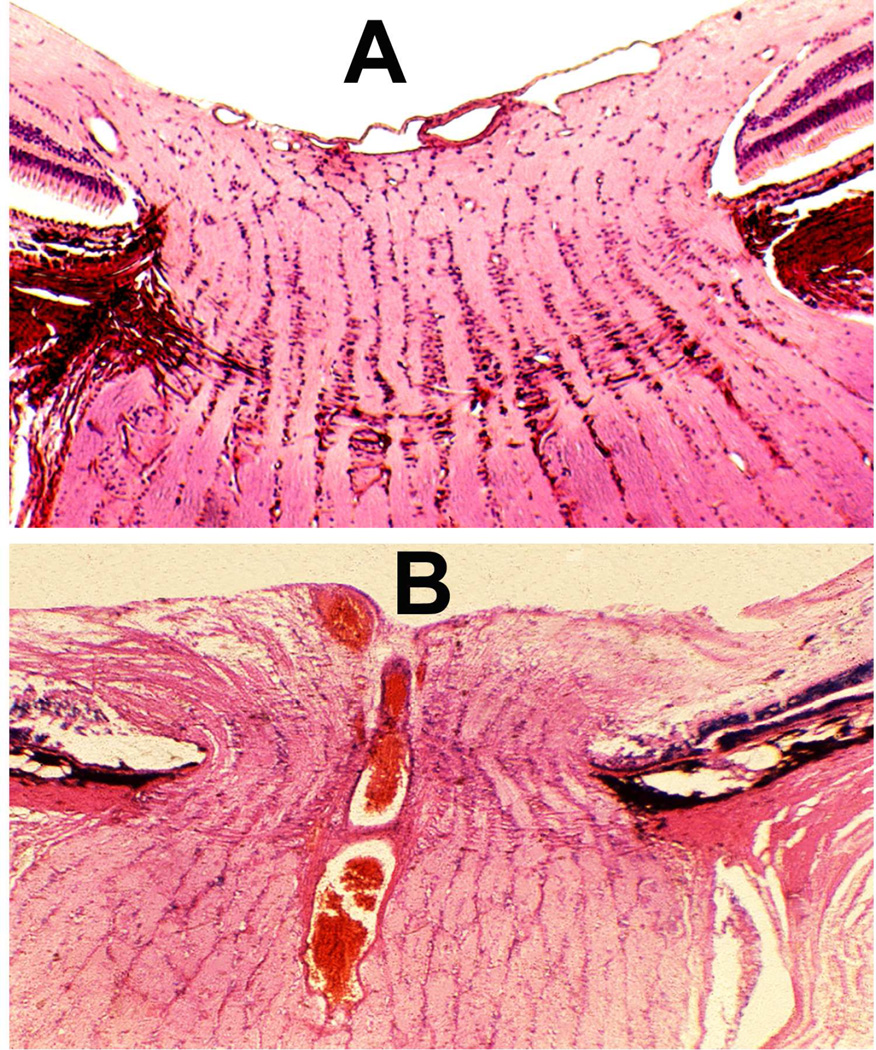
Kuhnt in 1879 first suggested that edema of the optic disc was due to stasis of the lymphatic stream in the intravaginal space rather than to the compression of blood vessels. Ulrich in 1884 first demonstrated in rabbits a flow of fluids from the vitreous into the optic nerve and then into the orbit; and this was later confirmed in the rabbit by other studies (Hayreh 1965a,1966). In view of that, I (Hayreh 1965a,1966) investigated the flow of fluid from the vitreous into the optic nerve head first, in the eyes of 47 rabbits, then of 4 rhesus monkeys and of 5 human eyes being enucleated for malignant melanoma. Colloidal iron was injected into the vitreous because it was easy to evaluate histologically by staining sections with Perl’s method, which stained the iron particles blue. The findings are discussed at length elsewhere (Hayreh 1966). In the rabbits, a significant flow of fluid was found to exist from the vitreous posteriorly into the optic nerve, along the loose perivascular tissue surrounding the central retinal artery within the optic nerve (Figs. 5A,B) and its extensions in the surrounding septa of the nerve along the small intra-neural branches of the artery, sometimes reaching right up to the border zone behind the eyeball and pia posterior to it, and then out into the orbit (Fig. 5B). The distribution of the colloidal iron in the optic nerve was a replica of the distribution of the central retinal artery and its branches.
Fig. 5.
(A) Longitudinal section of the anterior part of the optic nerve of a rabbit, showing distribution of colloidal iron (Blue) in the loose perivascular space around the central retinal artery in the nerve; 20 minutes after its injection in the vitreous.
(B) Schematic diagram, showing distribution of colloidol iron (blue) in optic nerve in therabbit.
Abbreviations: C=Choroid; CAR=Central artery of the retina; DS =Dural sheath; ON=Optic nerve; R=Retina; S=Sclera (Reproduced from Hayreh SS. 1966).
In contrast to the findings in the rabbit, in the rhesus monkeys and the man, no posterior drainage of the colloidal iron from the vitreous was seen. This difference between the findings in the rabbit and primates is due to two reasons. (a) Rabbits have no lamina cribrosa, which is present in primates. The lamina cribrosa prevented penetration of the colloidal iron into the optic nerve. (b) The loose perivascular tissue surrounding the central retinal artery (Fig. 5A) and its branches in the optic nerve septa seen in the rabbit does not exist in man and primates ([Singh (Hayreh) and Dass 1960], Hayreh 1964a).
It could be argued that colloidal iron has a large molecule and these findings may not be application to the human and primates. With this in view, I re-investigated this backward flow from the vitreous along the optic nerve in rhesus monkeys by injecting tritiated leucine into the vitreous (Hayreh 1978). This study revealed a heavy accumulation of the tracer in the glial cells in the anterior part of the prelaminar region up to Bruch's membrane, less accumulation in the posterior part of the prelaminar region, much less in the lamina cribrosa, and none in the retrolaminar optic nerve.
In light of these findings, we know: (a) the results of studies of the ocular fluids in the rabbit (the commonest experimental animal) are not applicable to primates and human beings, and (b) no posterior drainage of any fluid from the vitreous into the optic nerve takes place in primates; therefore, any theory postulating that edema of the human optic disc in intracranial hypertension is due to an obstruction to such a flow obviously has no basis.
4.3. Role of Compression of the Central Retinal Vein in Optic Disc Edema in Raised Intracranial Pressure
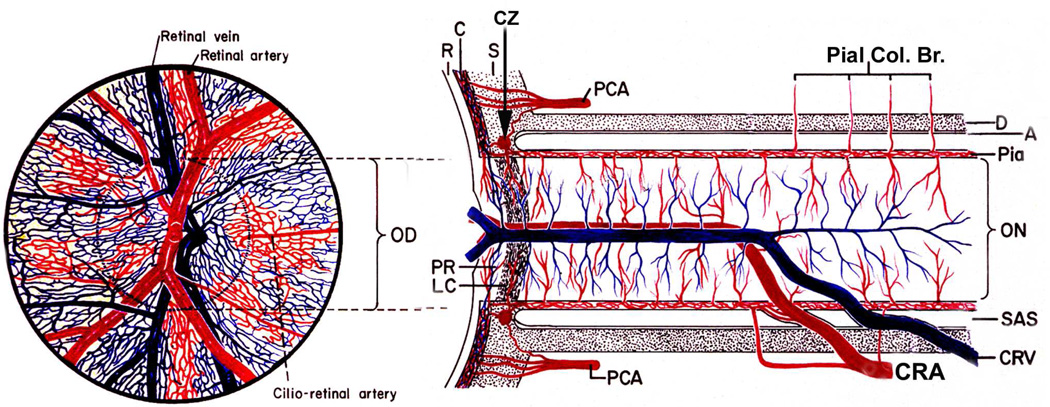
Türck (1853) and von Graefe (1860) originally postulated that raised intracranial pressure pressed on the cavernous sinus, choking the blood in the retinal veins and caused edema of the optic disc. Deyl in 1898 first postulated that optic disc edema in raised intracranial pressure was due to compression of the central retinal vein where it left the optic nerve and entered the intravaginal space in the optic nerve’s dural sheath (Fig. 6). This view became highly prevalent, and was based on the fact that eyes with optic disc edema due to raised intracranial pressure always have engorged retinal veins and retinal hemorrhages, in addition to optic disc edema. This was almost the accepted theory when I started my studies on the pathogenesis of optic edema in raised intracranial pressure; therefore, I felt that it was important to investigate the validity of this theory experimentally in rhesus monkeys (Hayreh 1965a,b).
Fig. 6.
Schematic representation of blood supply of the optic nerve and retina. Left half shows retinal appearance. (Modified from Hayreh SS. Anatomy and physiology of the optic nerve head. Trans Am Acad Ophthalmol Otolaryngol 1974;78:OP240-54.).
Abbreviations: A = arachnoid; C = choroid; CRA = central retinal artery; Pial Col. Br. = Collateralbranches to pia mater; CRV = central retinal vein; CZ = circle of Zinn and Haller; D = dura; LC =lamina cribrosa; OD = optic disc; ON = optic nerve; PCA = posterior ciliary artery; PR =prelaminar region; R = retina; S = sclera; SAS = subarachnoid space.
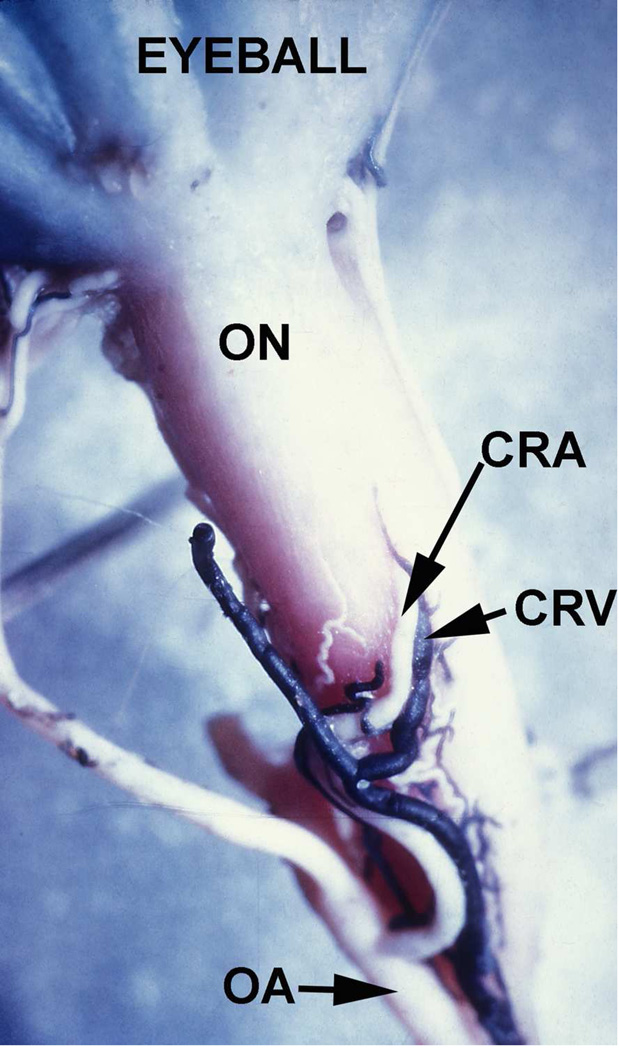
I decided to artificially occlude the central retinal vein in normal rhesus monkeys near the site where it was thought to be compressed by the raised cerebrospinal pressure in the sheath, i.e. at its exit from the sheath of the optic nerve (Fig. 7). With this in view, the central retinal vein was occluded by the application of a cautery in 6 rhesus monkeys at its site of exit from the sheath of the optic nerve. This resulted in immediate engorgement, turgidity and tortuosity of the retinal veins, with no edema of the disc or retinal hemorrhages. The subsequent course for these 6 animals was twofold:
Fig. 7.
Inferior surface of the intraorbital part of the optic nerve (ON), showing the central retinal artery (CRA) and vein (CRV) and their site of penetration into the sheath of the optic nerve in a rhesus monkey. (Reproduced from Hayreh SS 1965b.)
Abbreviations: CRA = Central retinal artery; CRV = Central retinal vein; OA = Ophthalmic artery; ON = Optic nerve.
4.3.1. Group 1
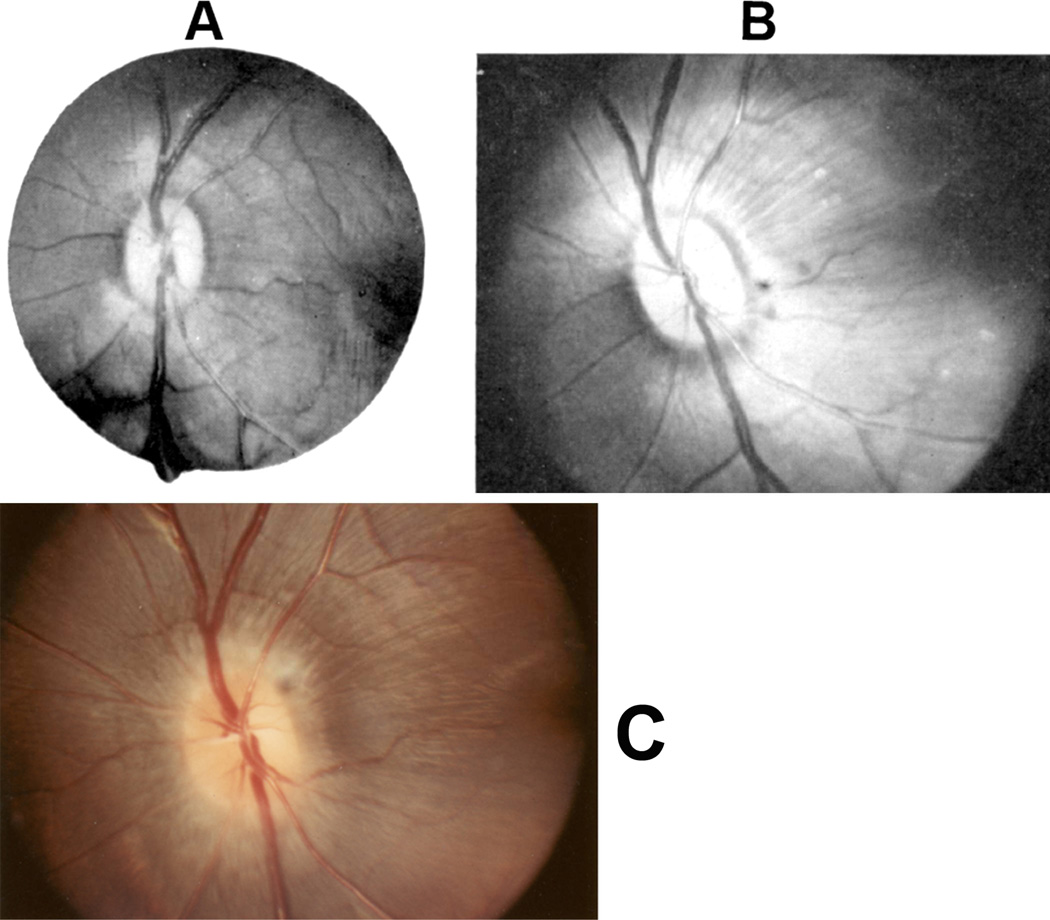
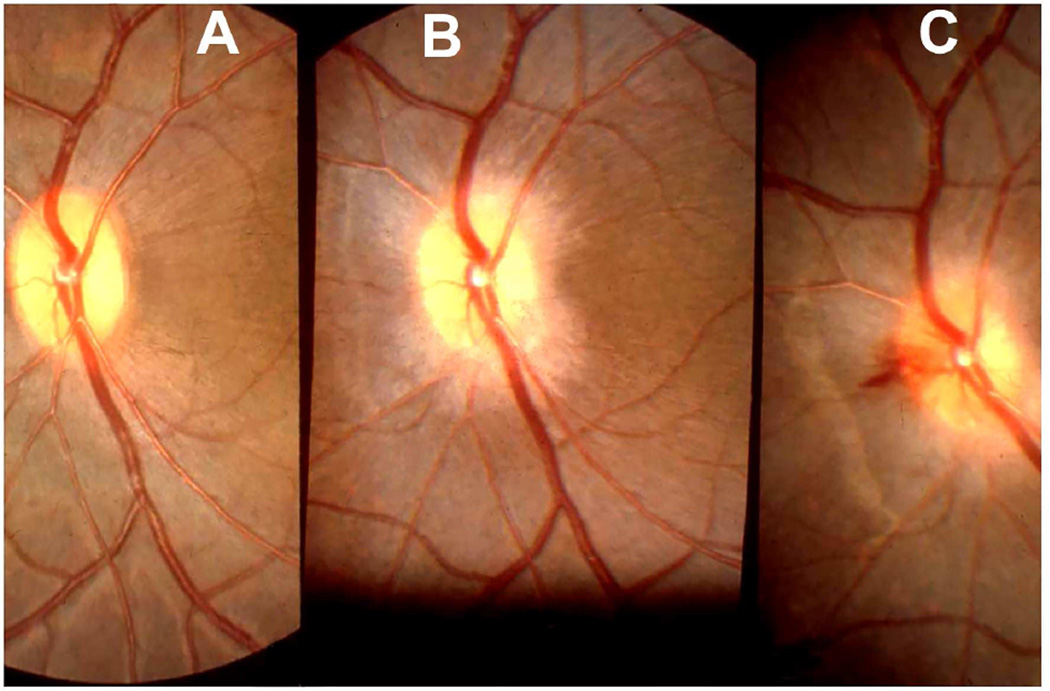
In three animals out of these six, no significant fundus changes were seen other than transient engorged, turgid and tortuous retinal veins (Fig. 8-A).
Fig. 8.
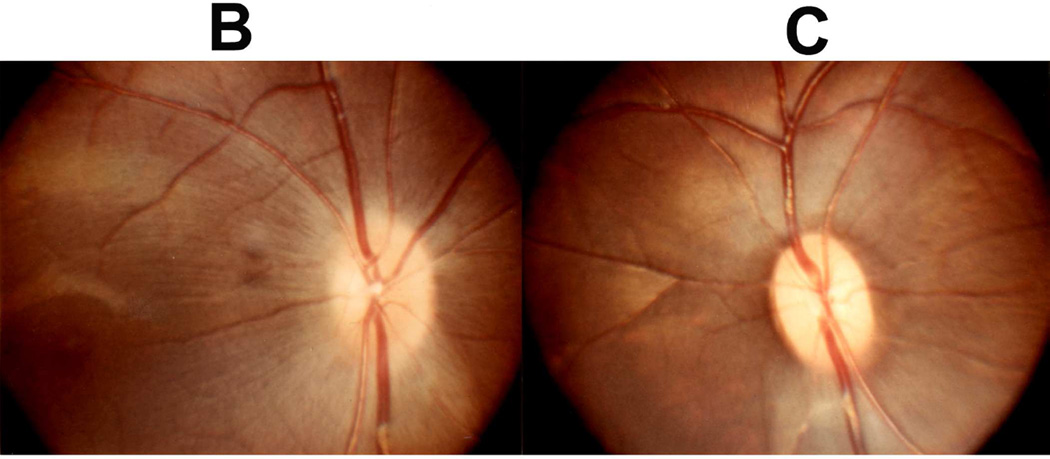
Fundus photographs (A) immediately after the venous occlusion, and (B) fourteen days later. (C) Shows later on development of optic disc edema when intracranial pressure was raised by inflating a balloon in the temporal region. (Reproduced from Hayreh SS 1965a,b.)
4.3.2. Group 2
In the remaining three animals, however, hyperemia of the optic disc with blurring of its margins was seen on the second or third post-occlusion day, but the changes in the optic disc were in no way similar to those seen in intracranial hypertension in man or rhesus monkeys (See below). The fundus changes started to regress on the 7th, 12th and 14th days in the three animals. In 16–36 days, the fundus was perfectly normal (Fig. 8B).
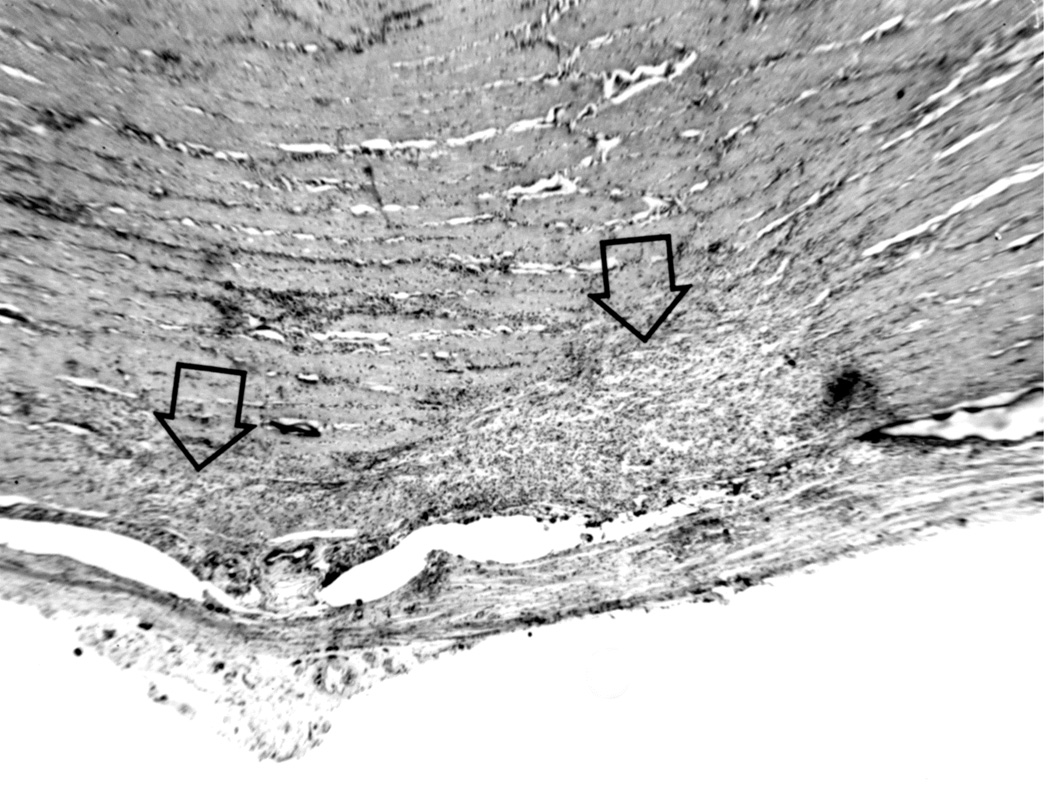
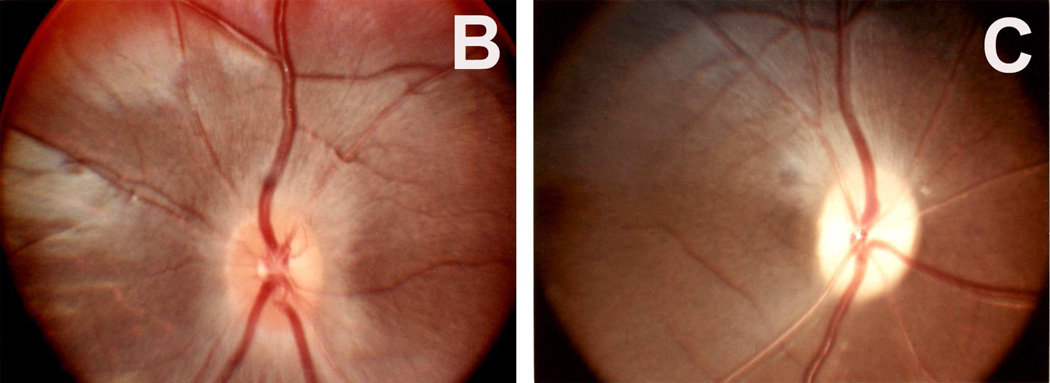
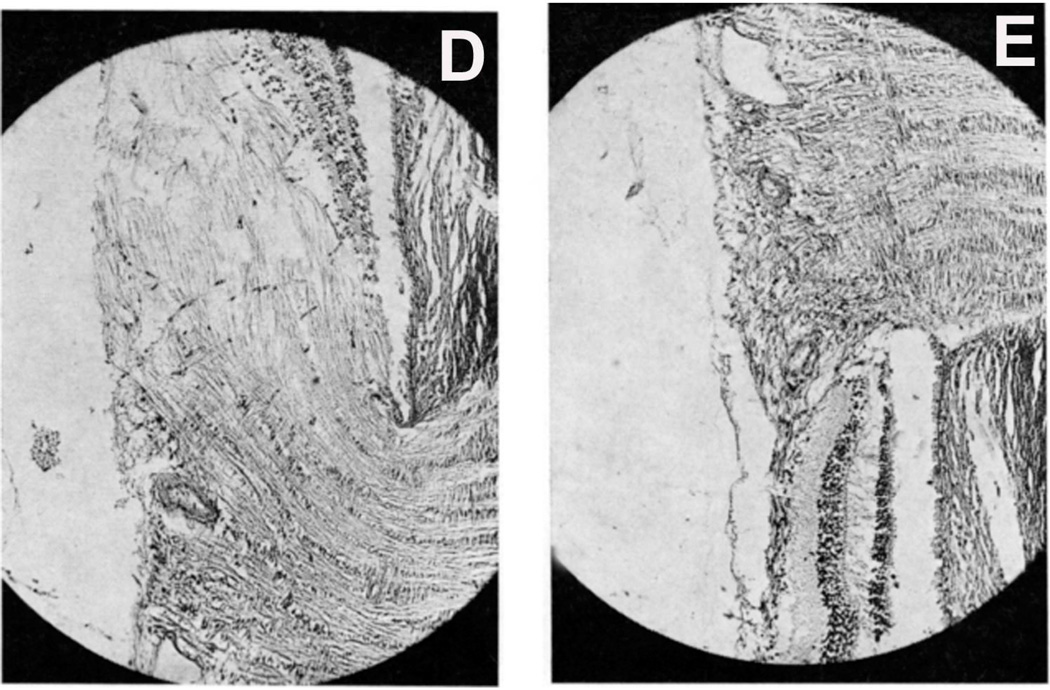
Histopathological examination confirmed the blockage in the central retinal vein outside the optic nerve in all animals. Prominent communications between the central retinal vein and the other pial veins were seen, which ultimately helped to drain away the blood from the central retinal vein in these eyes with the occlusion. Histological findings in the optic nerve explained the difference in the optic disc appearances in the two groups. In the Group 1, the optic nerve was perfectly normal. In the Group 2, however, the disc changes actually resulted from an accidental cautery burn in the optic nerve at the site of occlusion inferiorly (Fig. 9A), rather than from occlusion of the central retinal vein. Thus, the optic disc findings in Group 2 were caused by retrobulbar optic neuritis stemming from the burn, and not by the occlusion of the vein.
Fig. 9.
(A) Longitudinal section of the right optic nerve shows the atrophic patches in the lower part of the optic nerve (arrows) around the site of entry of the central retinal vessels, caused by cautery burn.
(B,C) Optic discs with raised CSF pressure show optic disc edema in the entire left optic disc (B), but only in the upper half of the right disc, and none in the lower atrophic half (C). (D,E) A section through the upper part of the right optic disc shows edema (D), but lower part of the optic disc in the same section shows optic atrophy (E). (A-E Reproduced from Hayreh SS. l968)
I investigated further whether, in the eyes which did not develop optic disc edema following central retinal vein occlusion, raised intracranial pressure would produce the classical optic disc edema and fundus changes. This was done in two monkeys (one from Group 1 and another one from Group 2 by inserting an intracranial balloon in the temporal region and gradually inflating it, to simulate a slowly growing intracranial space-occupying lesion, by the method described below. In this way it acted as a completely controlled experiment. In the Group 1 animal, where no significant fundus changes had developed on occlusion of the central retinal vein, other than engorged retinal veins, introduction of the balloon and its subsequent inflation resulted in marked edema of the optic disc on both sides (Fig. 8-C). This was very interesting because occlusion of the central retinal vein had failed to produce optic disc edema, whereas raise intracranial pressure in the same eye did produce marked optic disc edema and other fundus changes. The Group 2 animal initially, on occlusion of the vein, developed hyperemia with slight blurring of left disc margin caused by an accidental burn to the optic nerve inferiorly. When the left disc returned to normal, the lower half of the disc became atrophic due to a patch of atrophic degeneration in the nerve caused by the burn (Fig. 9A), while the upper half was normal. On raising intracranial pressure by gradually inflating intracranial balloon, unlike the changes seen after the central retinal vein occlusion, marked optic disc edema developed all over in the fellow normal right eye (Fig. 9B); however, it developed only in the upper normal part of the left optic disc, while the lower atrophic part did not develop any edema (Fig. 9C); this was also confirmed by histological section of the optic nerve (Figs. 9D,E). The reason why the atrophic part of the optic disc did not develop edema is discussed below. The development of marked edema of the optic disc with intracranial balloons and raised cerebrospinal fluid pressure, when in the same eye occlusion of the central retinal vein (with venous pressure raised much higher than would have happened by its simple compression) failed to produce any optic disc edema, is convincing evidence that edema of the disc is not due to compression of the central retinal vein.
The findings in these animals proved that compression of the central retinal vein in the intra-vaginal space by the raised pressure is neither wholly responsible for, nor an important factor in causing edema of the optic disc.
4.4. Acute Intracranial Hypertension
Acute intracranial hypertension is known to develop in clinical conditions such as head injuries and intracranial hemorrhages. To investigate what changes it produces in the optic disc and other vascular beds, I did the following two studies by producing acute intracranial hypertension in rhesus monkeys. In these studies intracranial pressure was acutely raised by injection of normal saline through a needle introduced into the cerebello-medullary cistern. The intracranial pressure was raised at the rate of 5 mmHg every 5 minutes, or at slightly longer intervals, to 40–50 mmHg.
4.4.1. Its Effect on the Optic Disc
This study was conducted in 35 rhesus monkeys. The level up to which the intracranial pressure was raised and how long it was maintained at the highest level depended upon how the animal tolerated it. The total duration of the raised pressure was usually from one to two hours. The majority of the animals collapsed due to the effects of the raised intracranial pressure at the end of the experiment. In some animals that did not collapse, the pressure was suddenly raised to 100–150 mmHg; this invariably caused the animal to die. The findings are discussed at length elsewhere (Hayreh 1965a, 1968). The fundus examination showed no optic disc edema or retina hemorrhages in any of the animals in this study. Hedges (1969), similarly found no optic disc edema in experimental acute rise of intracranial pressure. This completely contradicts the incredible claim by Cushing and Bordley (1909) that, in dogs, optic disc swelling developed within a few minutes by acute rise of intracranial pressure to 30 mmHg by injection of normal saline into the cranial cavity; they further stated: “Pressure by finger on exposed dura, a few minutes of pressure sufficed to produce a swelling of the disc of 2 D.” This claim of swelling of the optic disc within a few minutes of acutely raising the intracranial pressure is illogical.
4.4.2. Its Effect on Ophthalmic and Systemic Blood Pressures
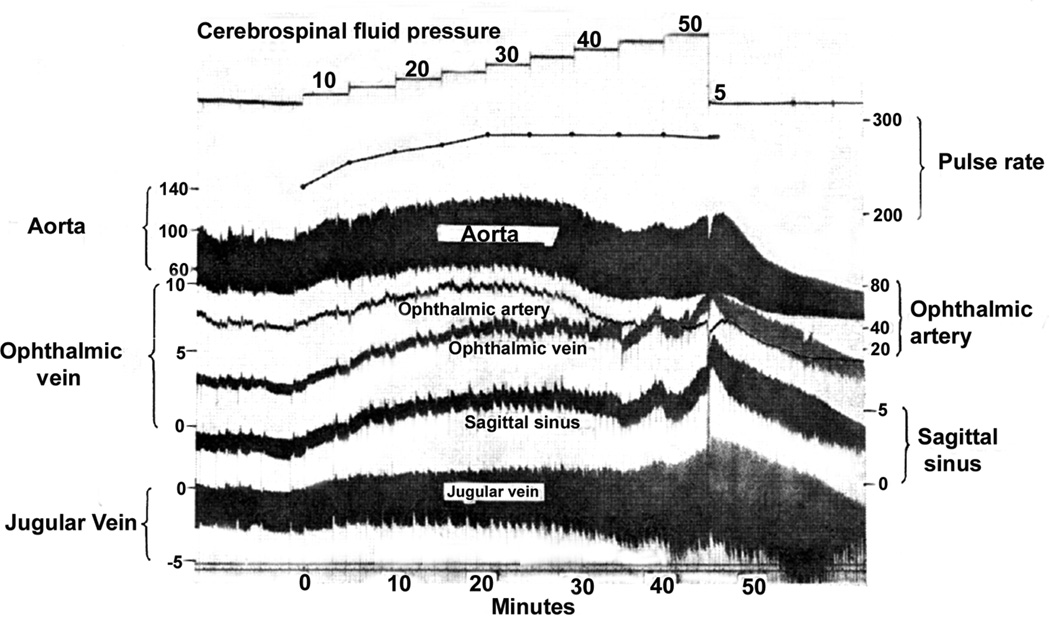
Türck (1853) and von Graefe (1860) originally postulated that raised intracranial pressure pressed on the cavernous sinus, choking the blood in the retinal veins and causing edema of the optic disc. In view of that, I investigated the effect of acute elevation of intracranial pressure on the ophthalmic and systemic blood pressures in 27 rhesus monkeys, by cannulating the ophthalmic artery and vein, superior sagittal sinus at the vertex, the right jugular vein in the neck, and abdominal aorta through the femoral artery; I recorded all the pressures simultaneously, as well as the heart rate (Hayreh and Edwards 1971a,b), first at normal intracranial pressure, then by acute elevation of the intracranial pressure in steps of 5 mm Hg every five minutes to about 40–50 mmHg.
The Effect of Raised Intracranial Pressure on Ophthalmic Artery and Vein
This study is discussed at length elsewhere (Hayreh and Edwards 1971a). Figure 10 is an example of the findings in one animal. Briefly, the ophthalmic and systemic arterial pressures showed a close correlation. Both rose with a rise in intracranial pressure up to 30–40 mmHg, but further increases in intracranial pressure usually produced arterial decompensation. A significant correlation was seen between intracranial pressure and the ophthalmic venous pressure: the higher the former, the higher the latter. The time taken by the intracranial pressure to reach its highest level did not significantly influence the ophthalmic venous pressure. The ophthalmic venous pressure and superior sagittal sinus pressure showed a significant correlation with each other and with the rise in the intracranial pressure - the higher the superior sagittal sinus pressure, the higher the ophthalmic venous pressure; this indicates that the rise in ophthalmic venous pressure was secondary to the rise in pressure in the intracranial venous sinuses. There was no significant correlation between the ophthalmic venous and arterial pressures (either systolic or diastolic). This indicates that the ophthalmic arterial pressure does not influence the ophthalmic venous pressure. Hedges et al. (1964) in rhesus monkeys showed a similar rise in ophthalmic venous pressure in acute intracranial pressure elevation. Thus, these studies confirm the views of Türck (1853) and von Graefe (1860) that raised intracranial pressure raises the ophthalmic venous pressure by pressing the intracranial venous sinuses; however, their view that that was responsible for the development of optic disc edema following raised intracranial pressure was not valid, because, as shown above, a rise in pressure in the central retinal vein had no cause-and-effect relationship with optic disc edema in raised intracranial pressure. The fundus examination at the end of the experiment revealed no abnormality.
Fig. 10.
Experimental records of the various pressure responses in a rhesus monkey when the cerebrospinal fluid was acutely raised to different levels. (All pressures in mmHg).) (Reproduced from Hayreh and Edwards 1971a)
The Effect of Raised Intracranial Pressure on Systemic Blood Pressures
This study is discussed at length elsewhere (Hayreh and Edwards 1971b). Figure 10 is an example of the findings in one animal. During the initial phase of the rise of the intracranial pressure to about 15 mmHg, normal animals showed a significant fall in the systolic arterial blood pressure. With a further elevation of the intracranial pressure, the blood pressure rose till the intracranial pressure reached 30 to 40 mmHg. If the pressure was raised higher than that, a large number of the animals showed a significant fall in the blood pressure. This study indicated that vascular decompensation occurred in the majority of animals when the intracranial pressure went higher than 30 to 40 mm Hg; there was a significant rise in the pulse rate, superior sagittal sinus pressure, and internal jugular vein pressure. The jugular vein pressure was related to the superior sagittal sinus pressure, indicating that the former most probably reflected the pressure changes in the intracranial venous sinuses. A sudden lowering of the intracranial pressure to zero from the highest level in 23 animals caused 13 to die in less than half an hour and four in about an hour, while six animals withstood this elevation of the intracranial pressure well, with a good recovery. This indicates that, once the vascular decompensation has set in, the prognosis is generally poor even after the intracranial pressure is lowered to normal. The drop of the intracranial pressure to zero produced no significant change in the pulse rate but a significant fall in the blood pressure. The fundus examination at the end of the experiment revealed no abnormality.
5. Chronic Intracranial Hypertension
The primary objective of my studies on the pathogenesis of optic disc edema in raised intracranial was to investigate it in chronic raised intracranial pressure, as seen in patients with intracranial space-occupying lesions and with chronic raised intracranial pressure from other causes, for example idiopathic intracranial hypertension.
In the literature, optic disc edema in Guillain-Barre syndrome has been attributed most probably to elevated protein in the cerebrospinal fluid. With this in view, first, in 7 rhesus monkeys, I tried to raise the intracranial pressure by raising the protein level in the cerebrospinal fluid, by injecting either the monkey's own serum or fibrinogen, or the latter combined with thrombin, into the cerebrospinal fluid (CSF) by cisternal puncture. At every injection of the proteins, the CSF pressure was recorded, CSF protein level was estimated and the fundus examined. There was neither a rise in CSF pressure nor development of optic disc edema nor any other evident fundus change in any of these animals. Therefore, this was not an effective method to investigate the pathogenesis of optic disc edema in raised intracranial pressure.
5.1. Method to Produce Chronic Intracranial Hypertension by Space-Occupying Lesion
This study was conducted first in 26 rabbits and after that in 67 rhesus monkeys.
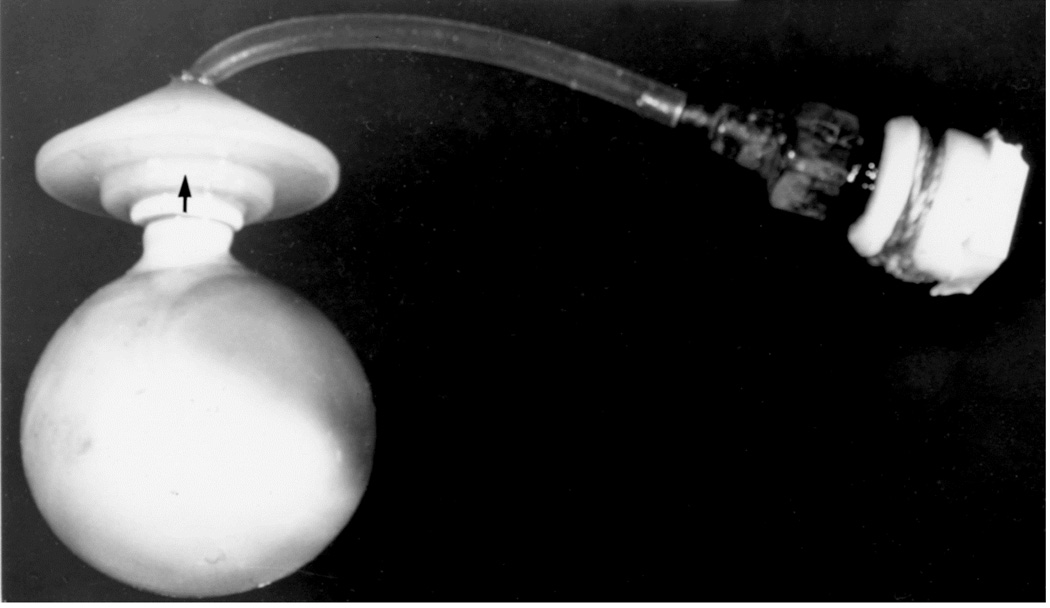
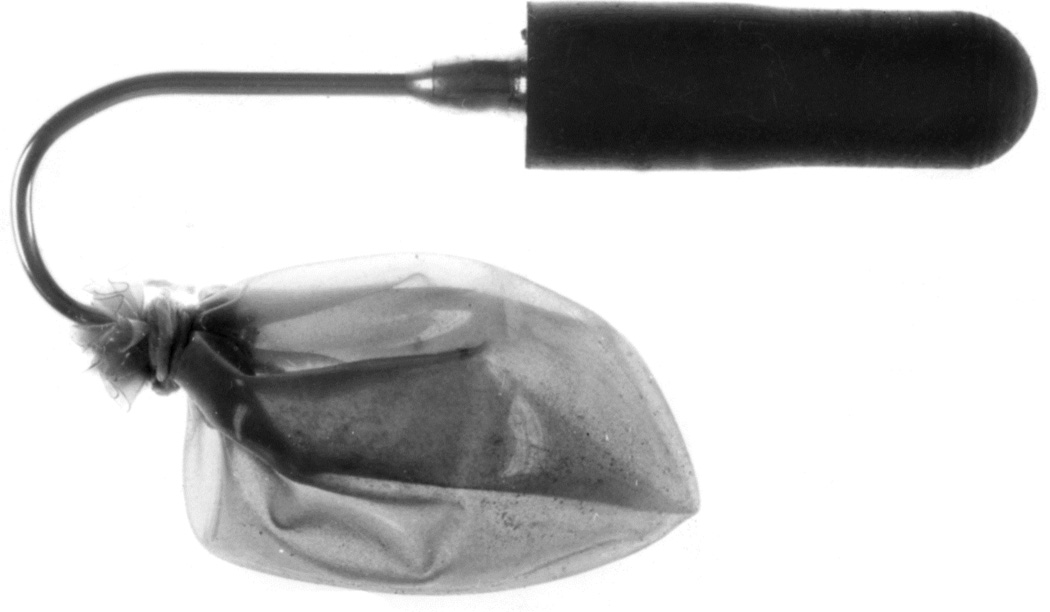
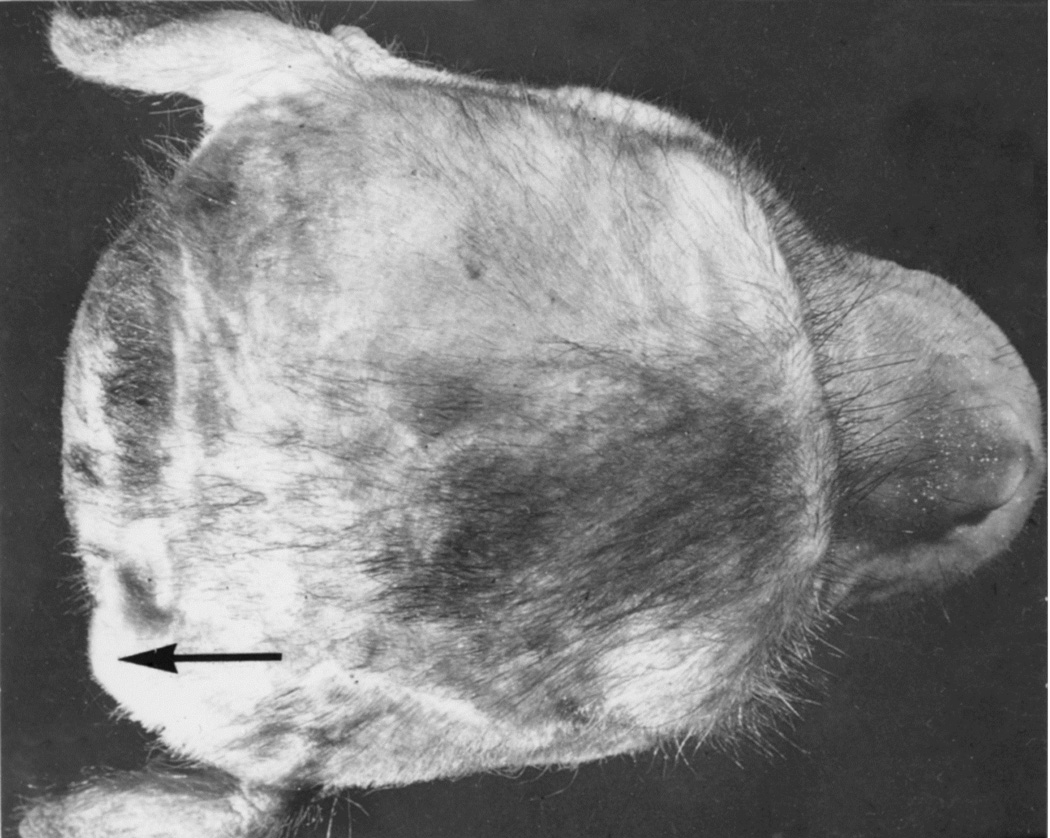
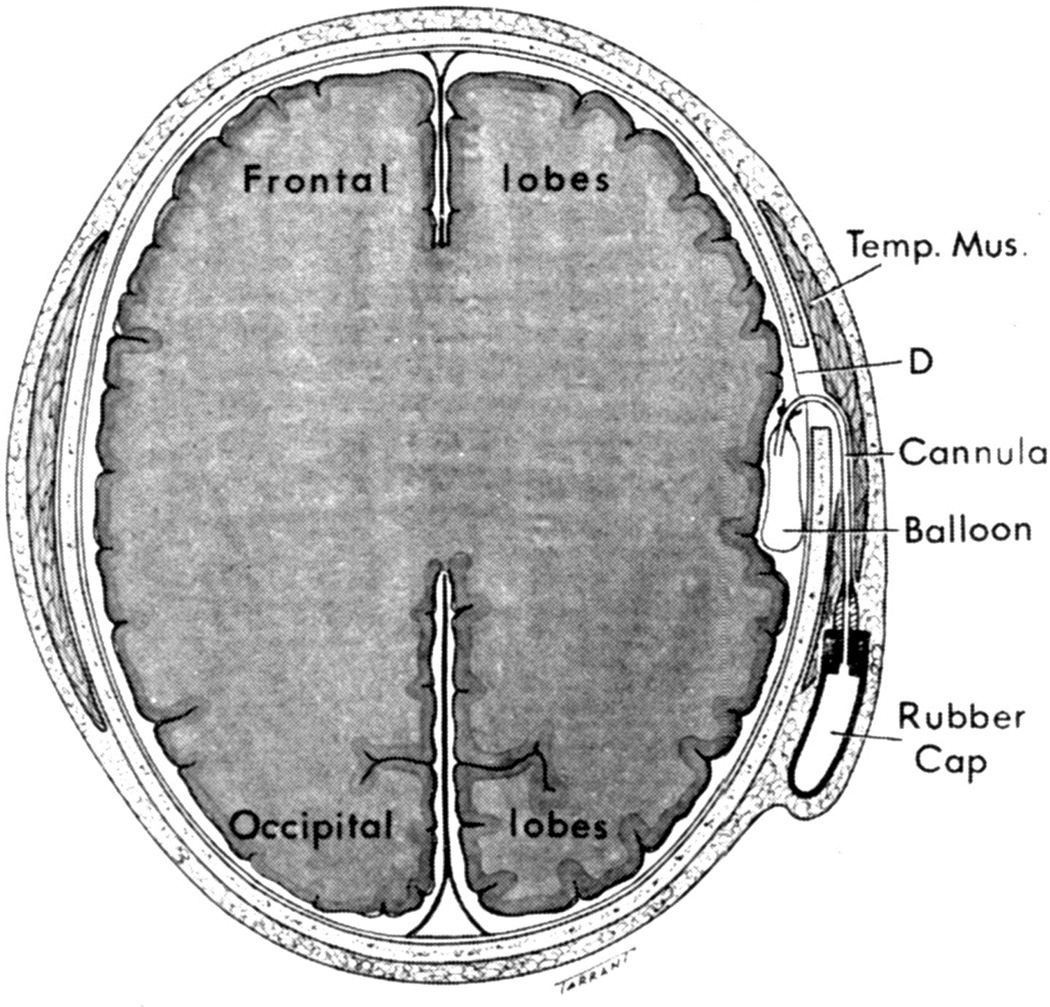
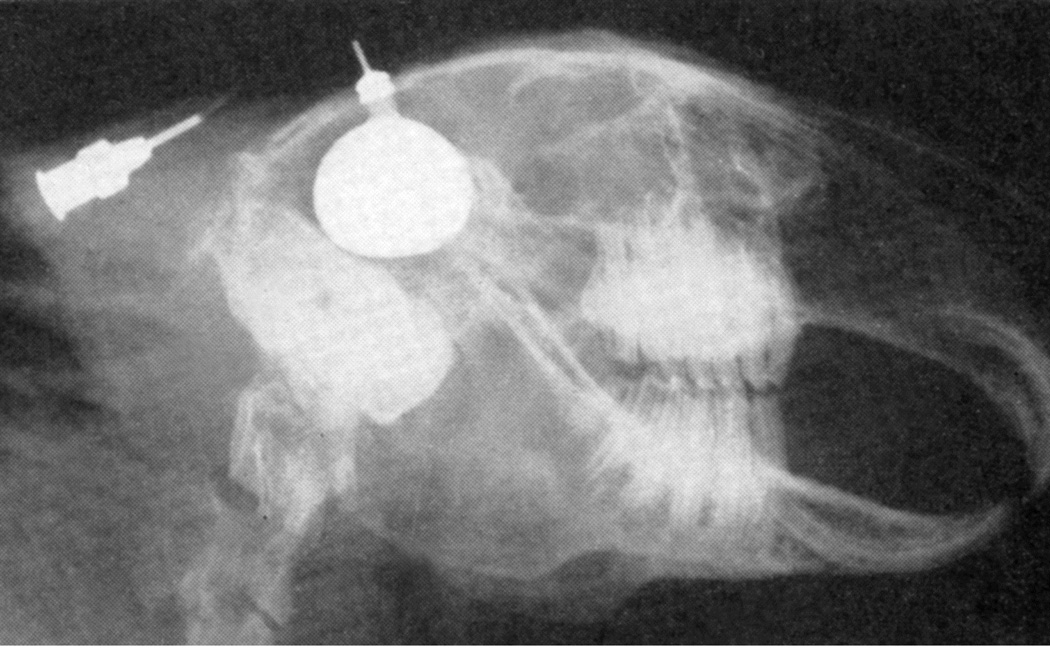
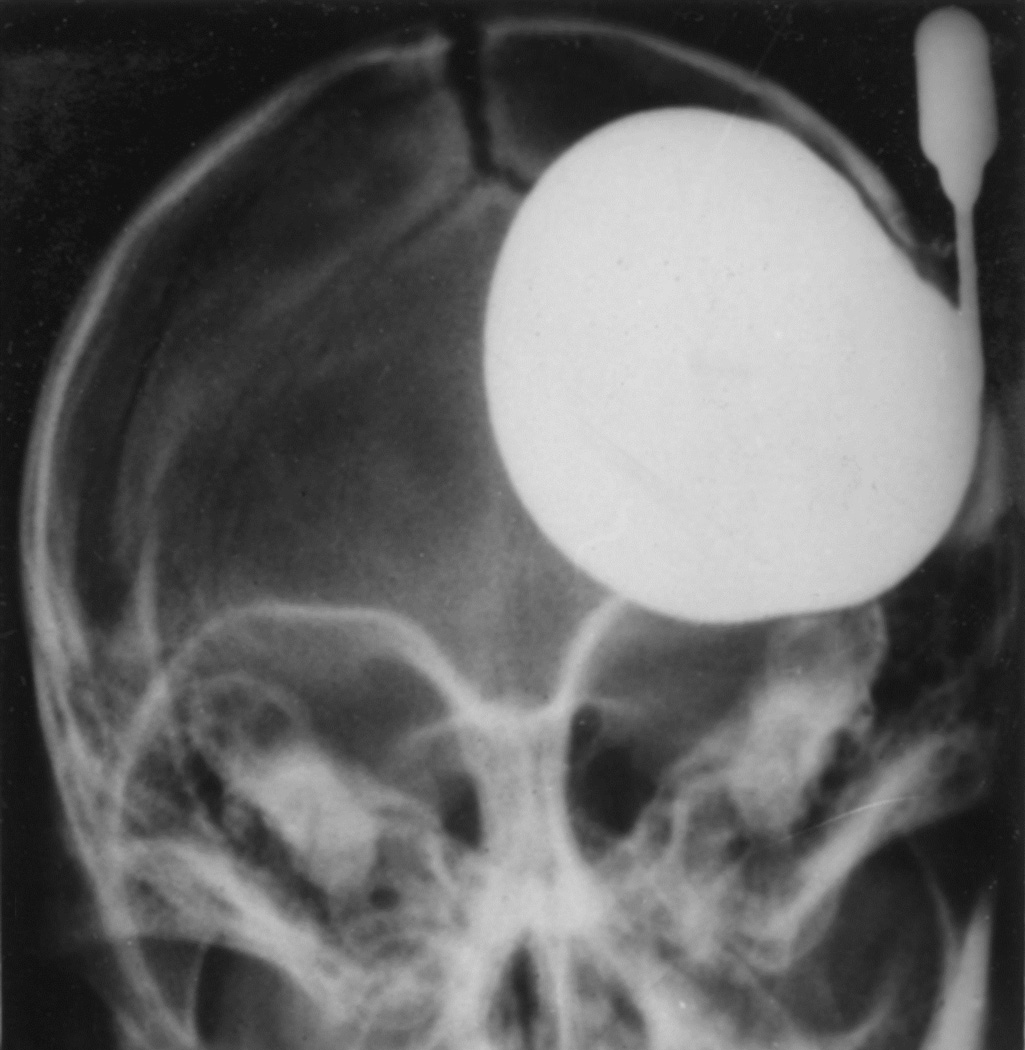
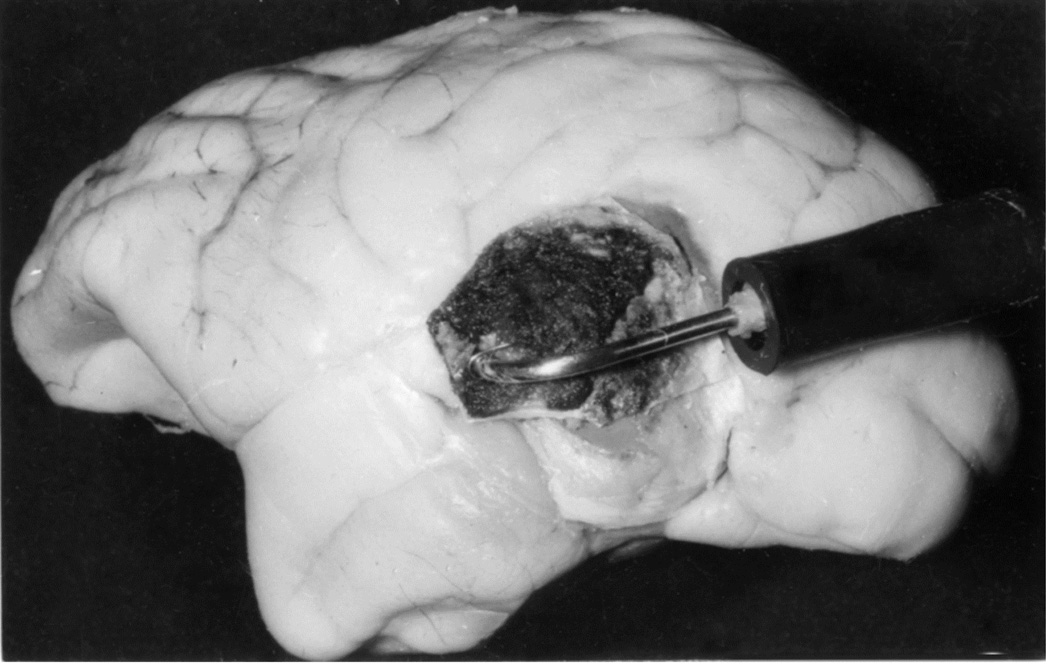
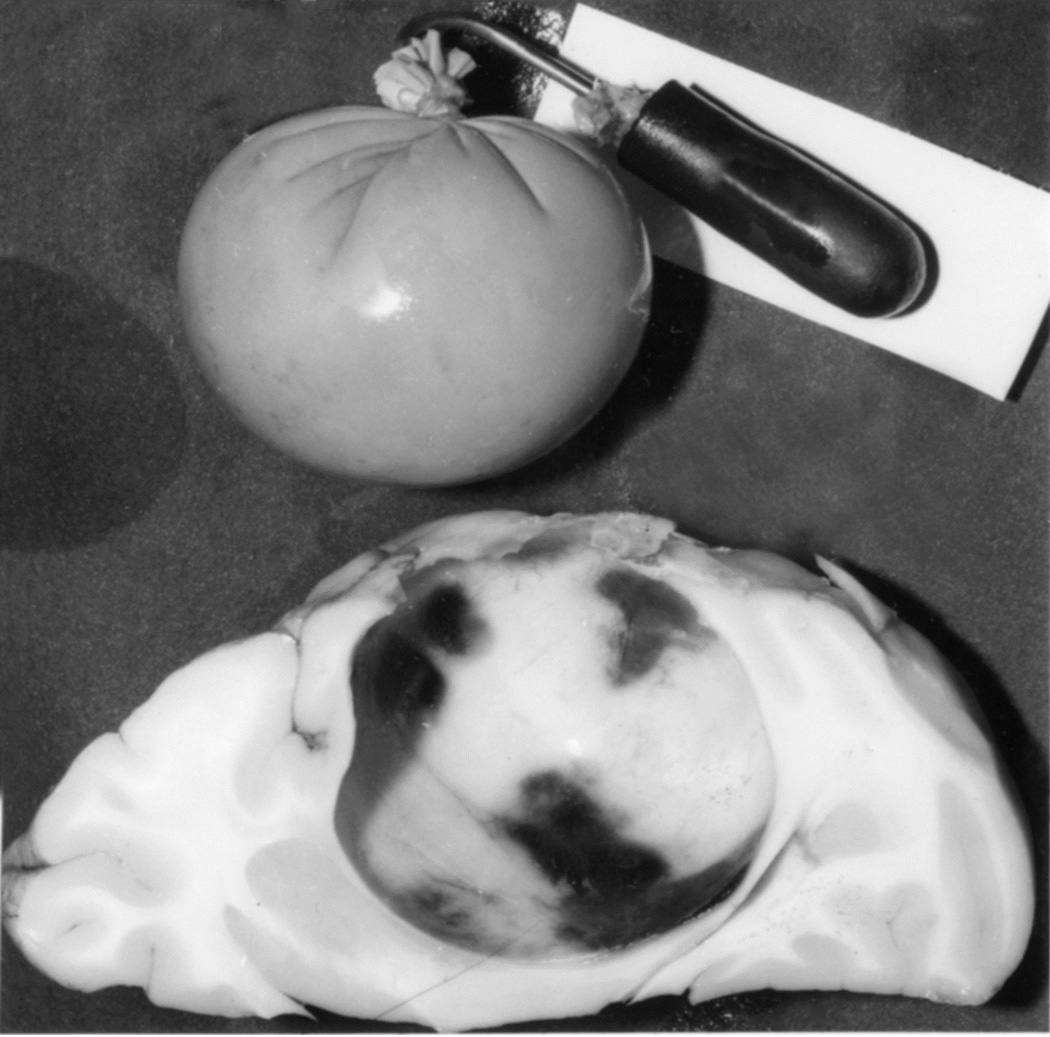
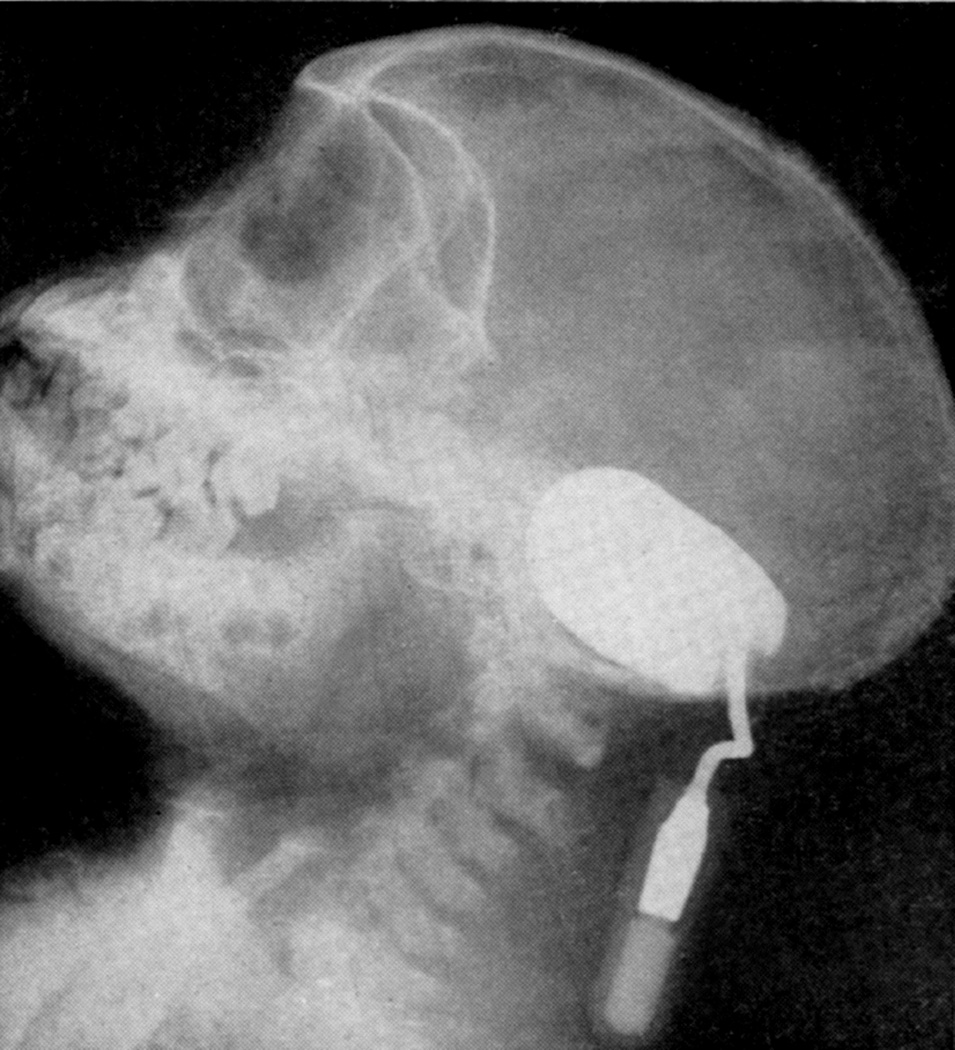
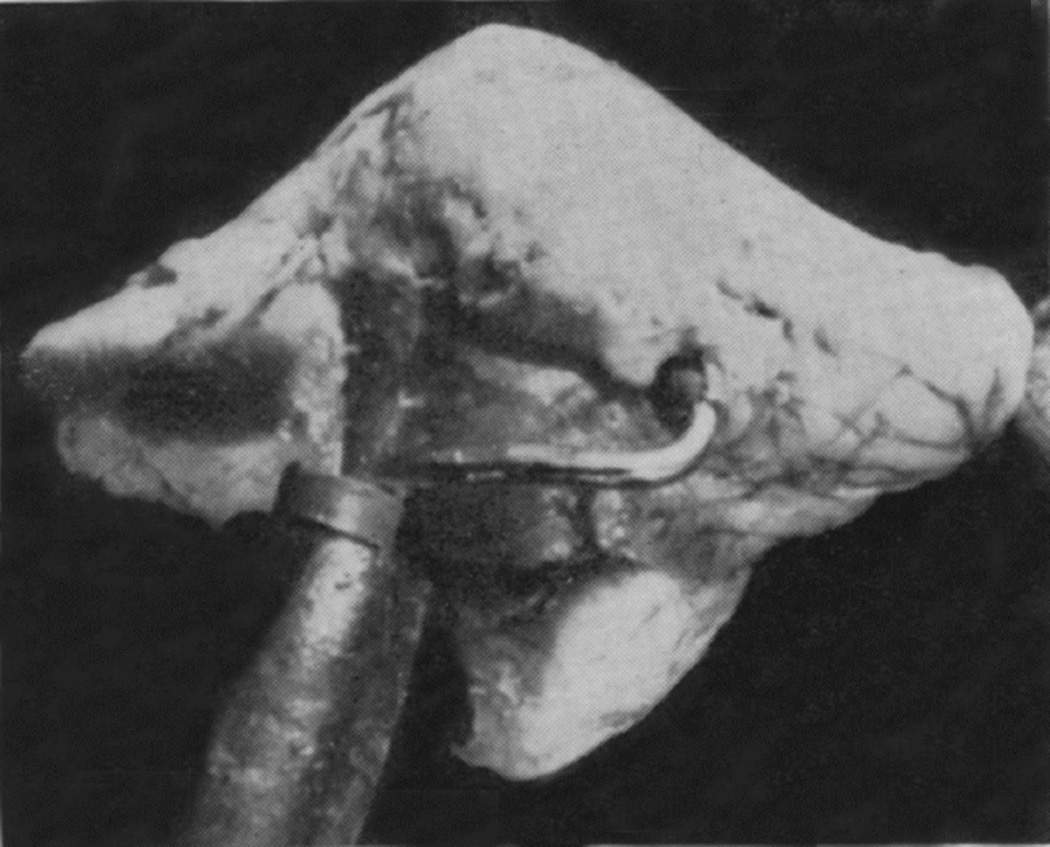
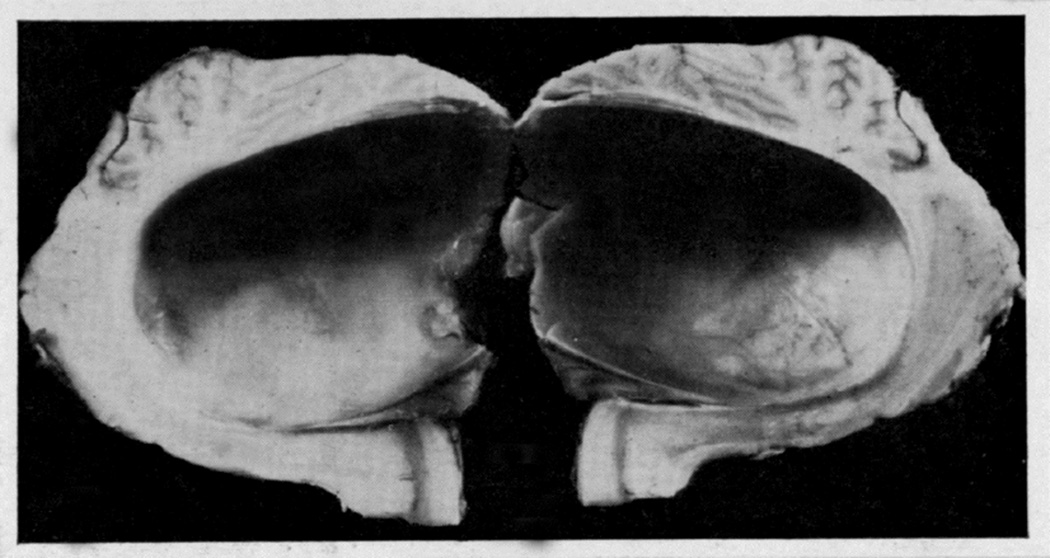
When I started my studies in 1961, no satisfactory method simulating a slowly growing intracranial space-occupying lesion in patients had been devised, producing chronic, sustained raised intracranial pressure. The method that I first devised is described elsewhere in detail (Hayreh 1964b). The assemblies that I developed are shown in figures 11 and 12. Figure 11 shows the one used in rabbits and figure 12 in the monkeys. The one used in the monkey (Fig. 12) consisted of a very fine collapsed balloon tied on one end of a curved cannula, and a thick rubber cap on its other end through which fluid could be injected repeatedly to inflate the intracranial balloon slowly over time, simulating a growing intracranial space-occupying lesion. The whole assembly was leak-proof. Under complete surgical asepsis, the collapsed balloon was inserted in the subarachnoid space by an incision in the scalp, making a small trephine hole in the skull, and then making a cut in the dura mater and arachnoid mater to enter the subarachnoid space. During this procedure cerebrospinal fluid flowed freely. The other end of the assembly with the rubber cap was inserted in a tunnel made under the scalp, so that it could be located under the scalp for repeated fluid injections (Fig. 13 arrow). A small amount of fluorescein solution was injected into the rubber cap at the time of insertion; that helped to make sure by aspiration before injection of fluid that the needle was in the cannula. The skull wound was closed. The wound was allowed to heal. Figure 14 is a schematic diagram showing the balloon and cannula in situ in monkeys. Then the balloon was progressively inflated by the addition of small quantities of a radio-opaque fluid at regular intervals through the subcutaneous rubber cap of the cannula, which could easily be felt under the skin; it was like giving an intravenous injection into a thick subcutaneous vein with a very fine needle. With this balloon and cannula in situ, the animal could be kept alive for months or longer without the slightest inconvenience to either the animal or the experimenter. Around the cannula the dura and the superficial brain tissue were completely sealed and dense adhesion developed between the brain and the dura at this site, allowing absolutely no leak of the cerebrospinal fluid from the cranial cavity. The balloon could not be seen externally; it was evaluated by radiological examination of the skull (Figs 15,16a,17a). When inflated, the balloon entered the brain substance and slowly invaded the brain (Figs. 16b,c, 17b,c), exactly simulating a rapidly growing intracranial space-occupying lesion. The site of the balloon and its rate of growth could be controlled at will.
Fig. 11.
The balloon assembly used in rabbits. (Reproduced from Hayreh SS. l968)
Fig. 12.
The balloon with cannula and rubber cap used in rhesus monkeys. (Reproduced from Hayreh SS. 1964b)
Fig. 13.
Tip of the cannula (arrow) under the scalp in rhesus monkey with a balloon in the temporal lobe region, as seen from the top. (Reproduce from Hayreh SS. 1965a)
Fig. 14.
Schematic diagram showing the balloon and cannula in situ after its introduction. D = Dura. (Reproduced from Hayreh SS. 1964b)
Fig. 15.
Radiograph of the head of a rabbit with distended intracranial balloon. (Reproduced from Hayreh SS. 1965a)
Fig. 16.
(A) Radiograph (Towne’s views) of an intracerebral balloon on the 80th day of the introduction of the balloon. Note diastasis of skull sutures as a result of the raised intracranial pressure. (Reproduced from Hayreh SS. l968)
(B) The cannula and balloon in situ in the brain. (Reproduced from Hayreh SS. 1965a)
(C) A horizontal section through a cerebral hemisphere showing the intra-cerebral cavity and the size of the balloon removed from that.
Fig. 17.
(A) Radiograph (lateral view) of a midline posterior cranial fossa distended balloon.
(B) Cerebellum in the same animal, showing the cannula entering the substance of the cerebellum. The balloon is embedded in the substance of the cerebellum.
(C) Midline sagittal section of the above cerebellum, showing the cavity of the balloon. (A-C Reproduced from Hayreh SS. 1964b)
The study was done in two phases in the rhesus monkeys. The first phase was done in the early 1960s, and there were 35 rhesus monkeys in this study. The objectives of this phase were to firmly establish the technique to produce reliably raised intracranial pressure simulating intracranial space occupying lesions, to test the effect of an intracranial balloon in different parts of the brain, to explore the validity of various postulated theories on the pathogenesis of optic disc edema in raised intracranial pressure, and other relevant studies. The second phase was done when more sophisticated methods of investigation for optic disc edema in raised intracranial pressure had emerged, including stereoscopic fundus photography, fluorescein fundus angiography, electron microscopy, horseradish peroxidase technique, and axoplasmic flow studies; the objective of these studies was to explore further the pathogenesis of optic disc edema in intracranial hypertension; there were 32 animals in this phase of the study.
5.2. Intra-Cranial Space-Occupying Lesions in Rabbits
This was a part of the first phase study. The rabbits survived up to a maximum of 107 days from the day of introduction of the balloon. The balloon on distension invaded the cerebral hemisphere and got encysted within its substance (Fig. 15). My studies showed that rabbit was not suitable for the study of chronic intracranial hypertension in man because: (i) Rabbits do not have a lamina cribrosa and their optic disc is normally cupped. (ii) The optic nerve anatomy of rabbit is very different from that of primates and humans. (iii) There is no central retinal vein in rabbits. (iv) As discussed above, my study showed that the centripetal flow of fluids along the optic nerve in the rabbit is not applicable to primates and human beings. (v) Rabbits did not develop optic disc edema on inflating the intracranial balloon.
All the rest of the studies were done in rhesus monkeys.
5.3. Intra-Cranial Space-Occupying Lesions in Rhesus Monkeys
5.3.1. Sites of the Intracranial Balloon in Rhesus Monkeys
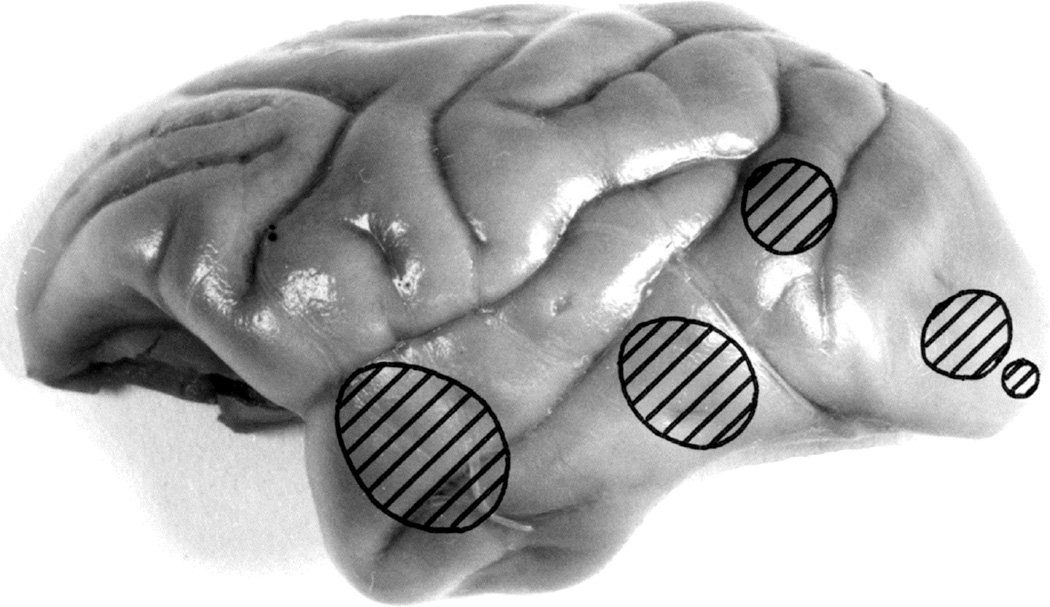
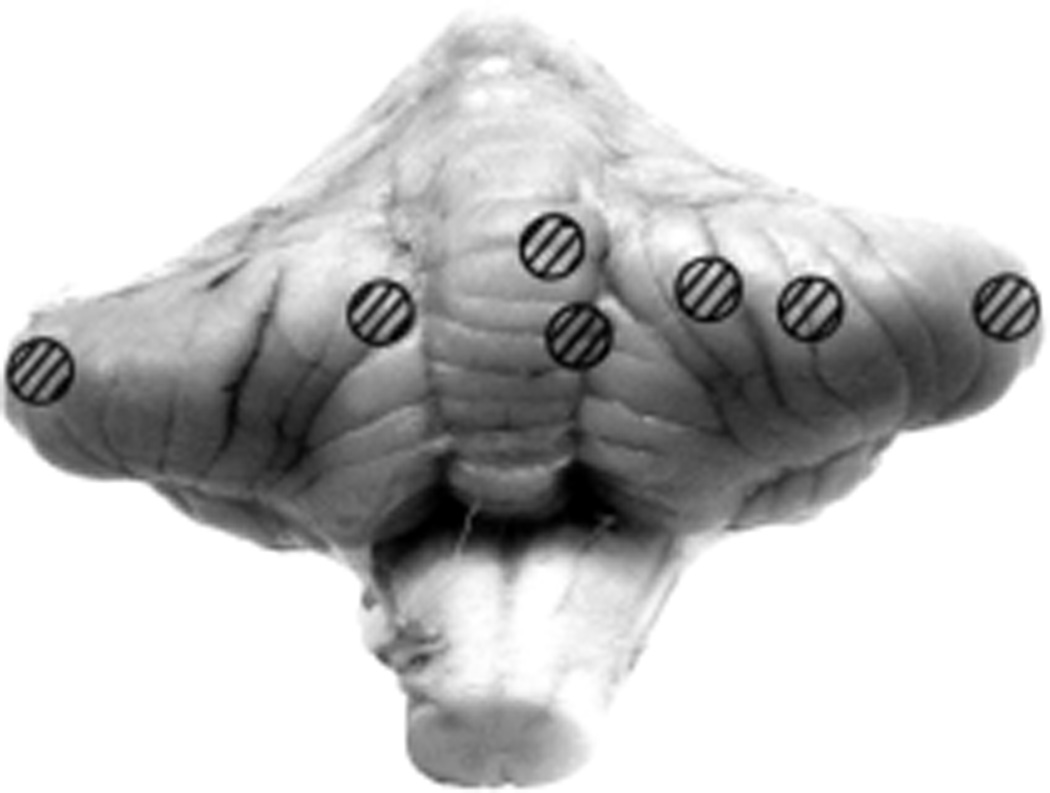
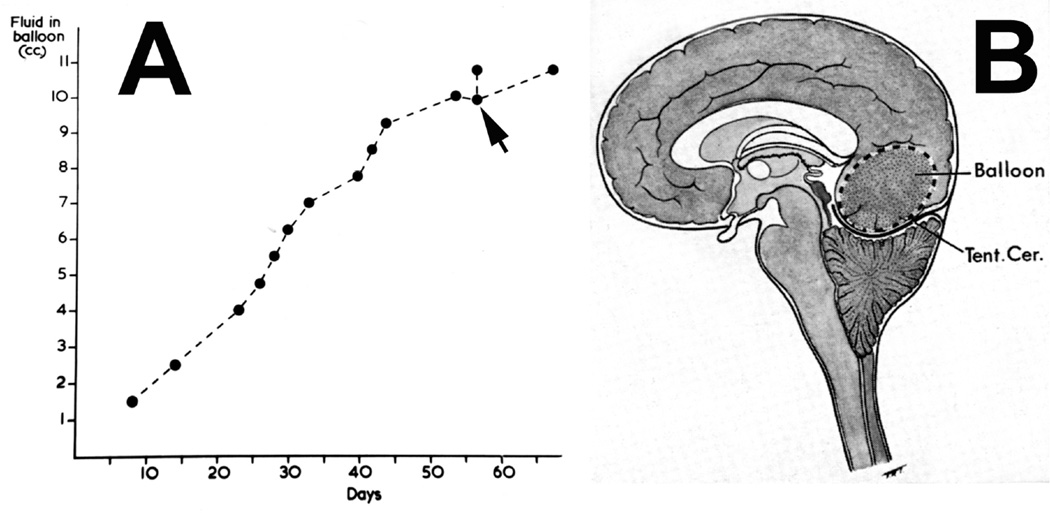
In the first phase study of 35 monkeys, Figure 18 shows the various sites of entry of the balloons into the cerebral hemisphere, and figure 19 the various sites of entry of the balloon into posterior cranial fossa (cerebellum). The findings are discussed in detail elsewhere (Hayreh 1964b,1965a, 1968). In the second group of 32 monkeys, the balloon was always inserted in the temporal region only. The maximum size attained by the balloon depended mainly upon its rate of inflation and its site. The maximum size the balloon attained in the posterior cranial fossa was 6.5 ml and in the supratentorial balloons up to 16.25 ml. During the terminal stages of inflation of the balloon, the addition of as little as ½-1 ml in the balloon quite often resulted in an immediate cessation of respiration, as the animal suddenly went into a deep coma, but on withdrawal of even ¼-½ ml of the fluid from the balloon, frequently the animal immediately started to breathe, and became quite normal with no ill-effects (Fig. 20). This showed that a critical balance existed in the cranial cavity and in the vital medullary centres which determined life or death.
Fig. 18.
Various sites of entry of the balloons into the cerebral hemisphere, as seen from the superolateral aspect. (Reproduced from Hayreh SS. 1964b)
Fig. 19.
Various sites of entry of the balloons into the cerebellum, as seen from the posterior aspect. (Reproduced from Hayreh SS. 1964b)
Fig. 20.
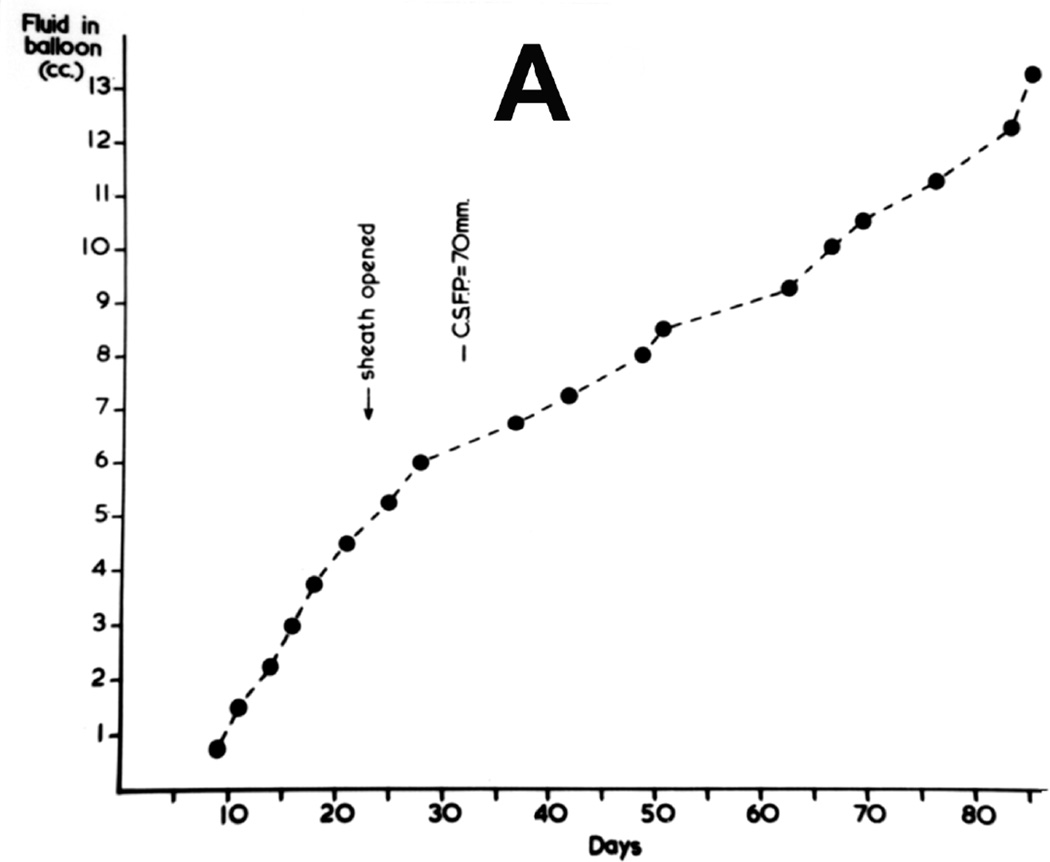
(A) Graphic representation of rate of inflation of the intracranial balloon in the occipital region. When the balloon was inflated on second last time (arrow), the animal immediate stopped breathing and went into coma; because on withdrawal of the fluid the animal immediately started to breathe, and became quite normal with no ill-effects. (Reproduced from Hayreh SS. 1965a)
(B) Schematic diagram showing pushing down of cerebellum into foramen magnum by a distended occipital lobe balloon. Abbreviation: Tent. Cer. = Tentorium cerebelli.
5.3.2. Cerebrospinal Fluid Pressure
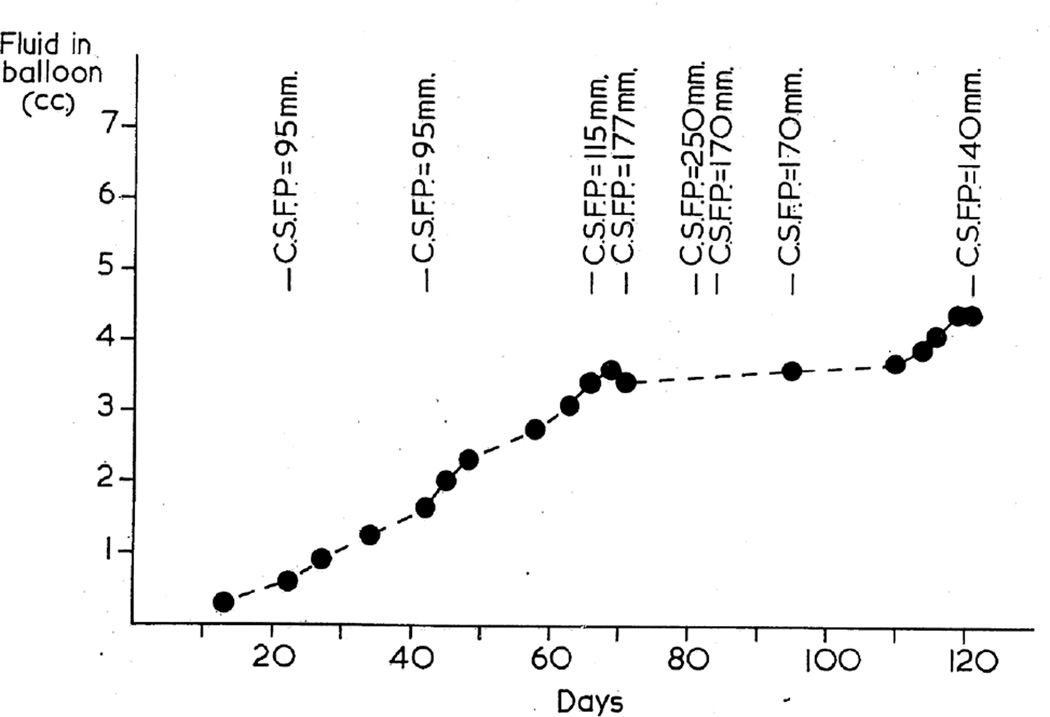
In the first phase study, this was repeatedly measured in most of the animals in the lying position. When the balloon was in the posterior cranial fossa, the pressure was generally measured by lumbar puncture, while with the supratentorial balloon it was done by cisternal puncture. The CSF pressure was high a few days after the introduction of the balloon into the cranial cavity but before it was inflated, probably due to post-operative cerebral edema, caused by the operative trauma. Figures 20 and 21 show progressive rates of inflation of the balloon in occipital (Fig. 20) and posterior cranial fossa (Fig. 21) regions, with the distension of the balloons; figures 20, 21 show gradual rise of the CSF pressure with progressive distension of the balloon. It seems that constant growth of the balloon was essential for the rise of the CSF pressure and its maintenance at a higher level; there was some indication that when the balloon was inflated rapidly, the CSF pressure rose higher than when the inflation was slow, but no definite relationship existed between the rate of inflation of the balloon and the CSF pressure. The CSF pressure was comparatively higher when the balloon was in the supratentorial region than in the posterior cranial fossa; this was most probably due to a more rapid growth of the balloon in these cases. The findings are discussed at length elsewhere (Hayreh 1965a, 1968).
Fig. 21.
Graphic representation of rate of inflation of the balloon in posterior cranial fossa shows levels of the CSF pressure. (Reproduced from Hayreh SS. 1965a)
5.3.3. Optic Disc and Fundus Changes
A detailed study of the pattern of development and evolution of optic disc edema in raised intracranial pressure is an essential pre-requite for a study dealing with its pathogenesis. Optic disc and fundus changes in my experimental studies on chronic raised intracranial pressure are discussed at length elsewhere. (Hayreh 1964b, 1965a, 1968, 1977a,b; Hayreh and Hayreh 1977a,b; Tso and Hayreh 1977a,b). As discussed above, the experimental study was done in two phases for logistic reasons and for facilities available for performance of more detailed and sophisticated investigations. In the first phase, there were 35 rhesus monkeys (Hayreh 1964b, 1965a), and in the second 32 animals (Hayreh 1977a,b; Hayreh and Hayreh 1977a,b; Tso and Hayreh 1977a,b). During the first phase of the study, the optic disc and fundus findings were primarily evaluated by routine ophthalmoscopy, and fundus photographs were taken only in a few animals and not serially because of limited fundus photography facilities available at that time. In the second phase, stereoscopic fundus photography and fluorescein fundus angiography were used serially to evaluate optic disc and fundus changes more critically than was possible during the first phase because those techniques did not exist then. While ophthalmoscopic findings proved to be very helpful, stereoscopic fundus photography and fluorescein fundus angiographic studies added new dimensions and provided far more critical information. The following brief account is based on a combination of information from both phases.
The normal fundus of a rhesus monkey usually has an appearance similar to the fundi of pigmented people. The disc is reddish-white in color with well-defined margins. The physiological cup in the optic disc is usually well seen; some optic discs have Bergmeister papilla. The temporal sector of the disc is often paler than the rest. The rest of the fundus has a dark color.
A. Evolution of Optic Disc Edema in Raised Intracranial Pressure
The subject of the evolution and resolution of optic disc edema in raised intracranial pressure is of tremendous importance, first from the point of view of early detection of optic disc edema in patients suspected to have raised intracranial pressure; and second, because it gives us information about the pathogenesis of optic disc edema in raised intracranial pressure, a highly controversial and fascinating subject. When I started the studies, knowledge about the evolution of optic disc edema in raised intracranial pressure and other issues involved was extremely scanty, and based only on routine ophthalmoscopy in routine clinics.
Because of the difference in the designs of the two studies and facilities available, there were some differences in their findings.
B. Findings of the First Phase Study
In this study, fundus changes were evaluated on ophthalmoscopy only. These are discussed at length elsewhere (Hayreh 1964b,1965a, 1968). Following is a brief summary. The optic disc edema changes can be categorized into two groups.
(i) Post-operative Optic Disc Edema
This was due to raised intracranial pressure caused by the post-operative brain edema from surgical trauma. Out of the total of 34 animals with the balloon, the optic disc changes appeared 2–16 days in 23 animals (in 19 of them in 2–7 days) after the introduction of the balloon in supra-tentorial region, but before its inflation. With the balloons in the temporal lobe region, the optic disc changes appeared within 2–10 days after the introduction of the balloon and were usually more marked than those in the posterior cranial fossa. When the balloons were in the occipital pole region, the optic disc changes appeared only after the balloons were inflated. Similarly, in the posterior cranial fossa balloons, the optic disc changes appeared within 5–8 days of the introduction of the balloon in the midline and in 4–16 days in those situated more laterally.
(ii) Optic Disc Edema on Inflating the Balloon
In the supratentorial balloons, the optic disc changes were more marked in most of the animals than those with the posterior cranial fossa balloons. The CSF pressure was also comparatively higher in the former group than in the latter, most probably due to a more rapid growth of the balloon in these cases. When the balloon was inflated at a faster rate, the changes were usually more marked and progressed faster. This pattern of the fundus changes with the balloons at different sites covers an overall pattern in the different regions; however, there were individual variations in each category.
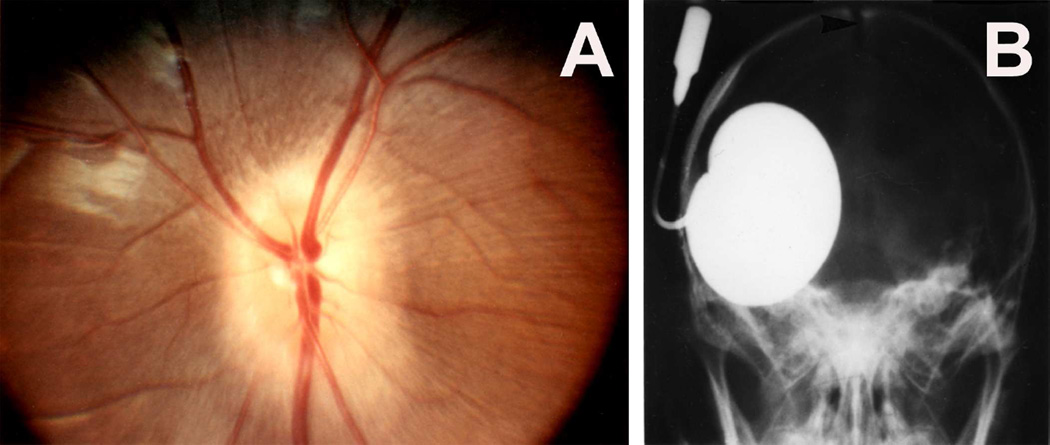
Ophthalmoscopic evaluation of fundus changes with raised CSF pressure showed that the earliest optic disc change to appear was hyperemia - first in the nasal part and later in the temporal region. Blurring of the disc margins, because of optic disc edema, appeared later; in the majority, it was first seen in its lower and upper margins, followed by the nasal margin, while the temporal margin was found to be involved last of all. The degree of blurring depended upon the severity of disc edema, so that in marked edema all the margins were indistinct (Figs. 22,23). The retina in the peripapillary region was noted to show whitish striations, and the sequence of the appearance of the striation was similar to the blurring of the disc margins. Disc/retinal hemorrhages were uncommon and seen when the optic disc changes were marked (Fig. 22C). There was some dilation of the retinal veins. No other fundus changes were noticed. A decrease in size of the balloon caused a rapid regression of the disc edema, and when the size of the balloon was kept stationary for some length of time, the optic disc edema started to regress, but re-inflation resulted in the progression of changes. This indicated that constant growth of the balloon was required to maintain elevated CSF pressure and optic disc edema.
Fig. 22.
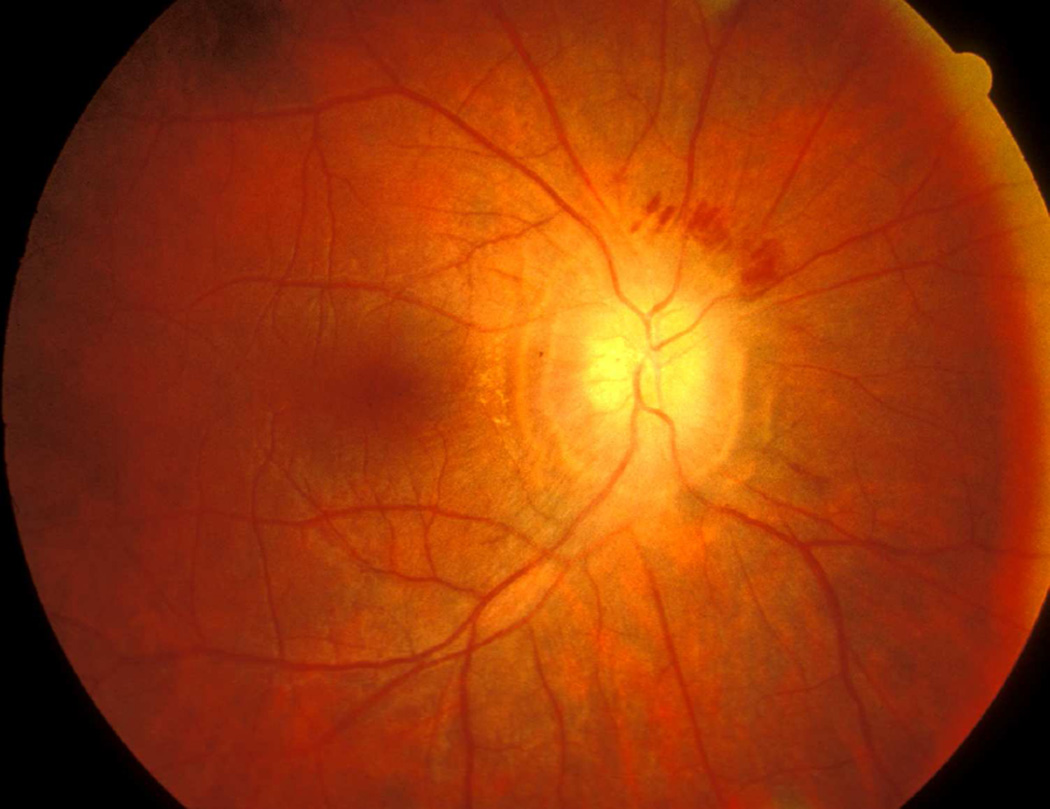
Fundus photographs of an eye of a rhesus monkey with temporal lobe balloon. (A) Normal optic disc before insertion of the balloon. (B,C) Fundus photographs with inflation of the balloon – (B) shows moderate optic disc edema, and (C) marked optic disc edema with a disc and peripapillary hemorrhage.
Fig. 23.
Fundus photograph (A) and radiograph (B) of a monkey with the distended balloon in the temporal region. (A) Shows marked optic disc edema.
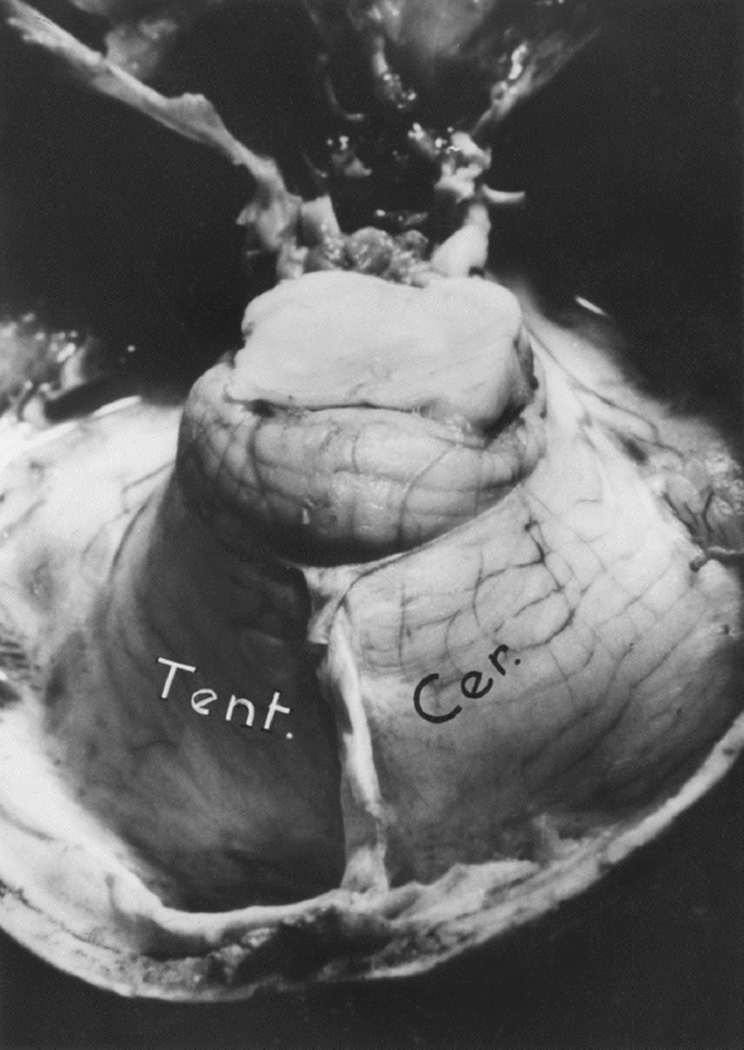
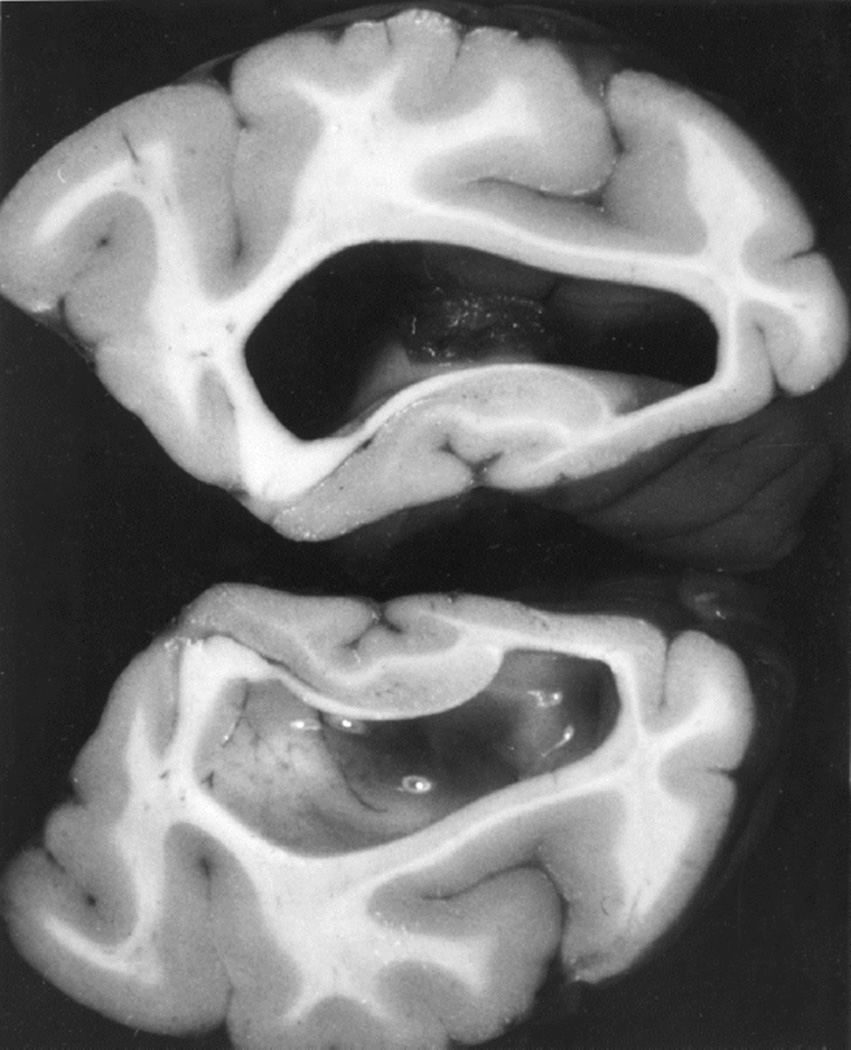
In the posterior cranial fossa balloons, when the animals died due to the distension of the balloons, the optic disc changes at death had some relationship to the degree of cerebellar herniations (through the foramen magnum below and the tentorial notch above) and the hydrocephalic changes. In the animals with the cerebellum herniating through the foramen magnum or tentorial notch (Fig. 24), the fundus was either normal or there were only slight changes. The findings strongly suggest that these two herniations, particularly the cerebellar herniation through the tentorial notch, could cause regression of the fundus changes. This seems to be due to closure of the notch, thus preventing the CSF from flowing from the infratentorial space to the supratentorial space. This is further aggravated by the herniation into the foramen magnum, which traps the CSF in the ventricular system by blocking the outlet. These factors lead to marked internal hydrocephalus (Fig. 25), without any corresponding rise in the CSF pressure in the supratentorial subarachnoid space.
Fig. 24.
This shows herniation of the cerebellum through the tentorial notch with the balloon in the posterior cranial fossa. Abbreviation: Tent. Cer. = Tentorium cerebelli.
Fig. 25.
Distended lateral ventricle with the balloon in the posterior cranial fossa in Figure 24.
C. Findings of the Second Phase Study
These are discussed at length elsewhere (Hayreh and Hayreh 1977a,b). Following is a brief account. In this study, unlike the first phase study, in all animals the balloon was inserted only in the temporal region, and the fundus was evaluated by stereoscopic color fundus photography and fluorescein fundus angiography.
Stereoscopic color fundus photography
This clearly demonstrated that the first finding of raised intracranial pressure was swelling of the optic disc. The swelling did not involve the entire disc simultaneously and to an equal degree. It appeared first at the lower pole, then the upper pole, then the nasal part, and last the temporal part of the disc; and the severity of the swelling generally followed suit. This order of appearance of edema was highly significant (P <0.005). Earliest evidence of post-operative optic disc edema was present in 28% to 30% within 24 hours, about in half in 2 days, and about 90% within a week.
Blurring of the disc margins is always considered to be a very important early sign of optic disc edema in ordinary ophthalmoscopic examination. However, stereoscopic examination showed that the blurring of the disc margin became evident only after there had been an appreciable amount of optic disc edema. The blurring usually became evident after the optic nerve fibers at the disc margin developed striation, as seen on ophthalmoscopic and stereoscopic examination. The striation of nerve fibers, although not an invariable finding, is seen frequently. This represents swollen optic nerve fibers in the peripapillary region due to axoplasmic flow stasis (see below).
Hyperemia of the optic disc was found to be the first sign of optic disc edema on ophthalmoscopic evaluation in my first phase study, but stereoscopic study showed that it was not an early sign but appeared comparatively later than the swelling of the disc and blurring of its margins. Other vascular changes, e.g., capillary dilation, microaneurysms, and hemorrhages, were also late changes. Retinal venous engorgement was seen. The presence of retinal venous pulsation on the optic disc could be seen in well-marked optic disc edema.
Thus, there was a slight discrepancy between the ophthalmoscopic and stereoscopic findings. Walsh and Hoyt (1969) stressed that “elevation of the optic disc is not an early sign of papilledema.” Their opinion was based on available ophthalmoscopic evaluation of the optic disc only, as was in my first phase study above, which also showed that optic disc edema was not the first sign. However, my second phase study based on stereoscopic examination, as mentioned above, revealed that the optic disc swelling was in fact the first sign. The basis for this discrepancy between ordinary ophthalmoscopic examination and stereoscopic examination of the disc is due to the transparent nature of the normal and mildly swollen nerve fibers in the disc. Earlier clinical studies based on routine ophthalmoscopy did not detect early changes.
Electron microscopic examination and axoplasmic flow studies in these eyes (see below) have clearly demonstrated that swelling of the nerve fibers is the first change in the optic disc edema due to raised intracranial pressure, without any evident increase of extracellular space in the prelaminar region; the latter contradicts the findings of Schutta and Hedges (1971). Wirtschafter et al. (1975) speculated that optic disc edema was due to swelling of the nerve fibers and enlargement of the extracellular space in the prelaminar region.
In both of my studies, the atrophic part of the optic disc did not develop edema in raised intracranial pressure (Fig. 9C–E). This has also been amply proved by clinical observation. As discussed below, in raised CSF pressure, axoplasmic flow stasis results in swollen axons and consequently disc swelling. Therefore, if there are no nerve fibers to swell, that part of the optic disc does not show edema, in spite of raised intracranial pressure. Thus, stereoscopic and other studies in the second phase study showed that the earliest change in the optic disc in raised intracranial pressure is swelling of the nerve fibers, and if these fibers are absent, the disc does not develop swelling.
These observations indicate the following sequence of events in the evolution of optic disc edema in raised intracranial pressure: The initial change is the swelling of the nerve fibers (due to axoplasmic flow stasis – see below), and this is responsible for early optic disc edema. The reason why swelling first appears at the lower pole, then at the upper pole, then the nasal part, and last at the temporal part of the disc depends upon the number and/or size of nerve fibers situated in different parts of the nerve head, as discussed below.
5.3.4. Role of Fluorescein Angiography in Optic Disc Edema
A review of the literature reveals that vascular changes in the optic disc and distension of the retinal veins have been considered to be the first changes in patients with raised intracranial pressure; and this was attributed to the very popular theory that compression of the central retinal vein, where it crosses the sub- arachnoid space around the optic nerve (Fig. 6), is responsible for development of optic disc edema in raised intracranial pressure (see above). To investigate that, I performed fluorescein angiography serially in the second phase study. As discussed above, this showed that swelling of the optic disc was the first sign of optic disc edema; other early signs were striation of nerve fibers on the optic disc margins and peripapillary retina, and blurring of the disc margins. Hyperemia of the disc and capillary dilation, hemorrhages, and other retinal vascular changes usually appeared later than that. Fluorescein angiography did not show changes till edema was of a mild to moderate degree. This study, contrary to prevailing clinical impressions, showed that color stereoscopic fundus photography was a much more sensitive test for detection of early optic disc edema than fluorescein fundus angiography. In fact, this is not surprising if we consider the evolution of optic disc edema. Swelling of optic nerve fibers is the earliest change to produce optic disc edema, while vascular changes develop secondarily, comparatively later on. Stereoscopic photography detects swelling of the disc, while fluorescein fundus angiography detects vascular changes.
A. Fluorescein Fundus Angiography Pattern at Different Stages of Optic Disc Edema in Experimental study
1. In Early Optic Disc Edema
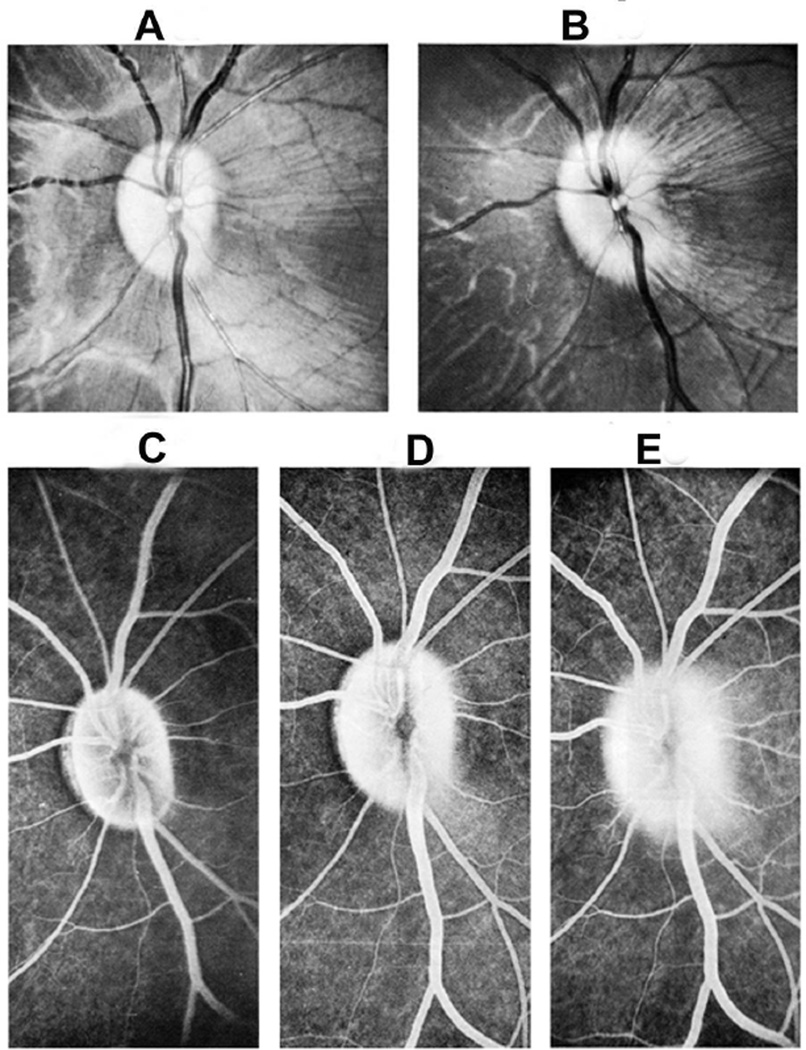
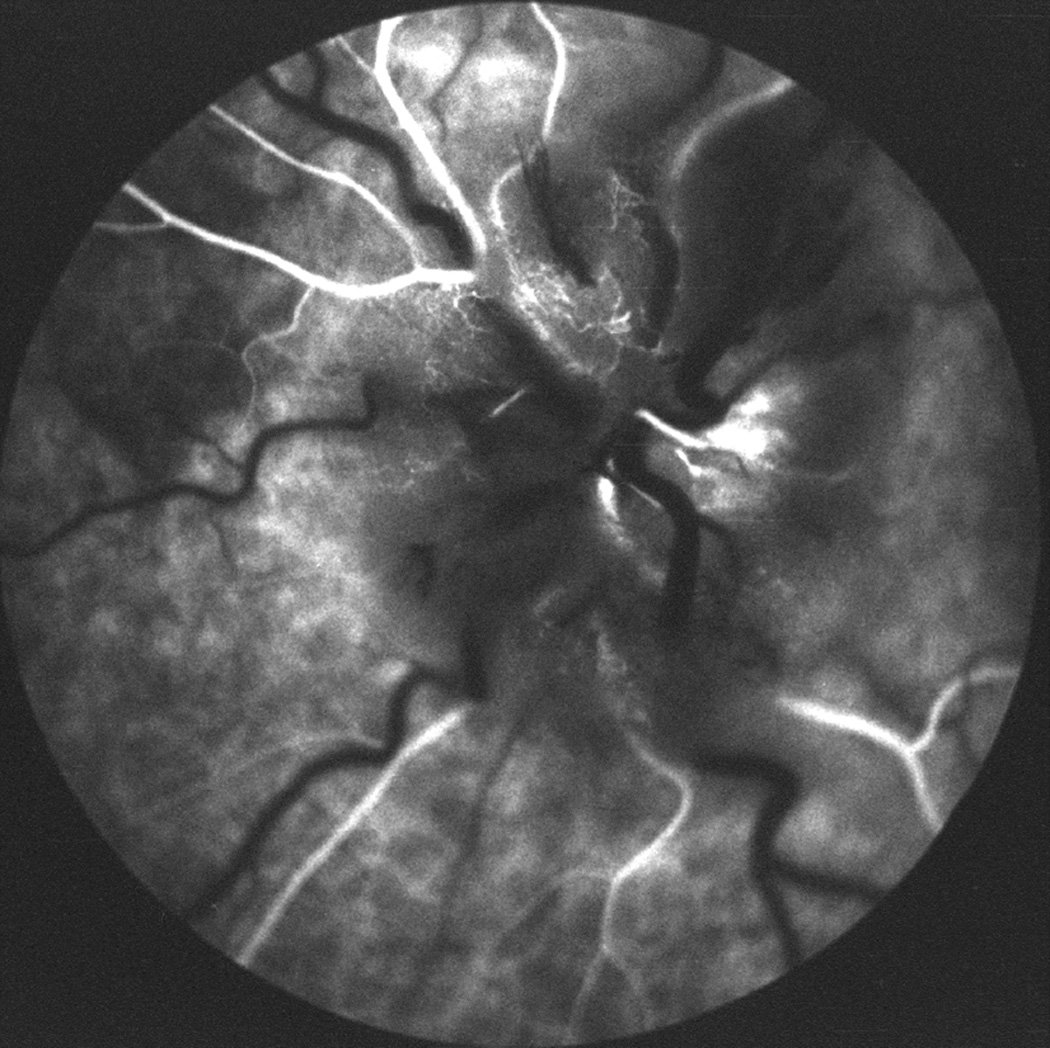
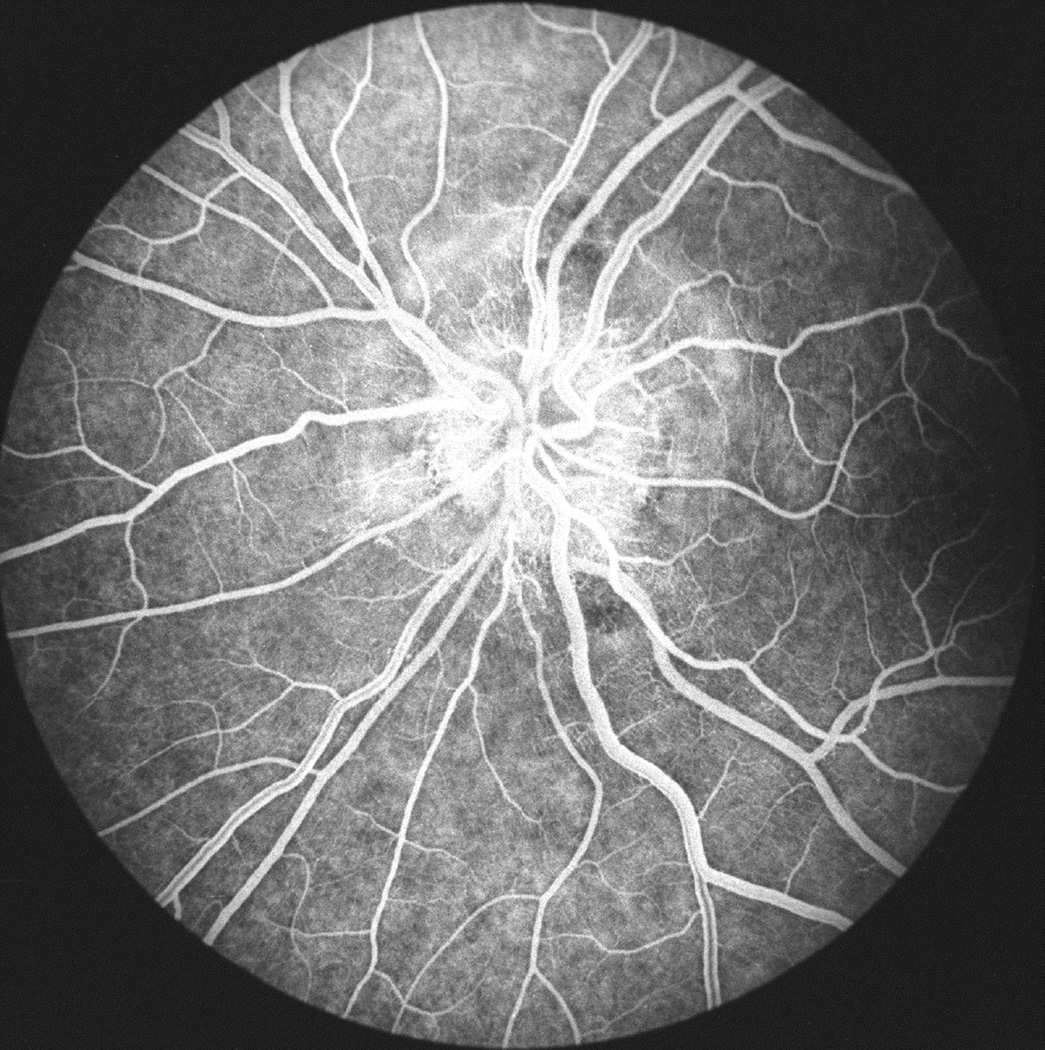
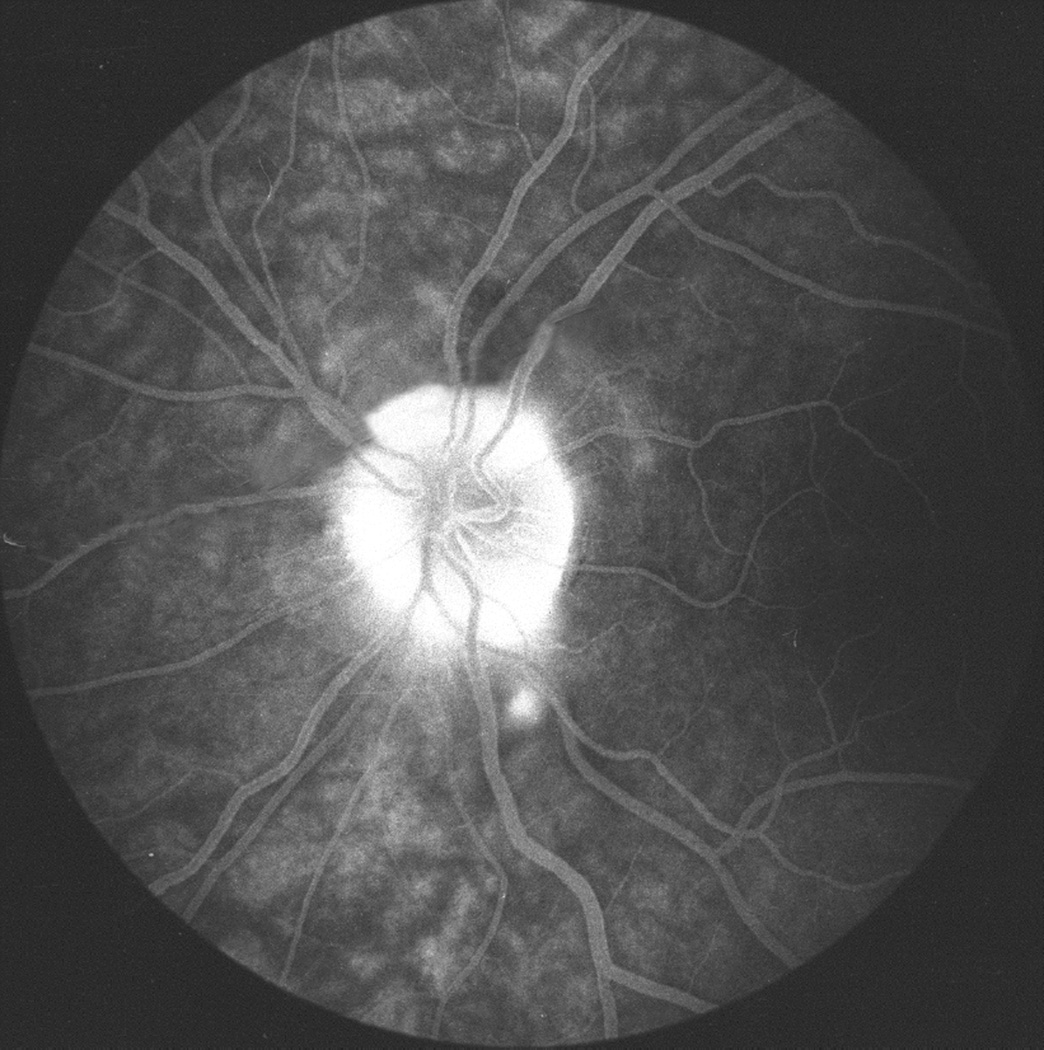
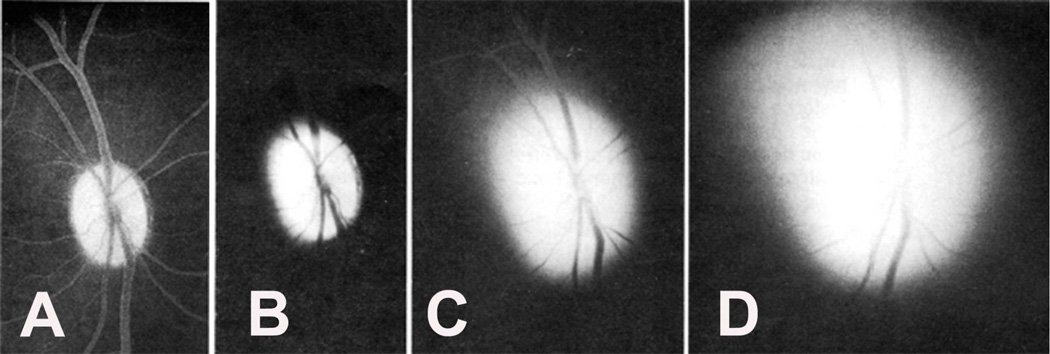
In these eyes no evident abnormality was detected during the transit of the dye; however, the late phase (15 to 20 minutes after injection of fluorescein) revealed blurring of the disc margins on angiography, almost always starting at the lower part of the disc, corresponding to the stereoscopic evidence of optic disc edema (Figs.26A,D). When the incidence of detection of optic disc edema on fluorescein angiography was compared with that on stereoscopic color photography, it was evident that stereoscopic photography revealed a much higher incidence of early optic disc edema than angiography. These data indicated that optic disc edema had to be of a mild to moderate degree before fluorescein angiography demonstrated abnormalities.
Fig. 26.
Fundus photographs (A,B), and late fluorescein angiograms (15 minutes after injection of dye) of left fundus in a rhesus monkey: (A and D) one day and (B and E) seven days after introduction of right temporal fossa balloon. (C) Normal late angiogram before introduction of the balloon. Note progressive increase in severity of ophthalmoscopic and angiographic changes on various occasions. (Reproduced from Hayreh and Hayreh. 1977b)
2. Later Stages of Optic Disc Edema
- During the Transit of the Dye: Following were the findings:
-
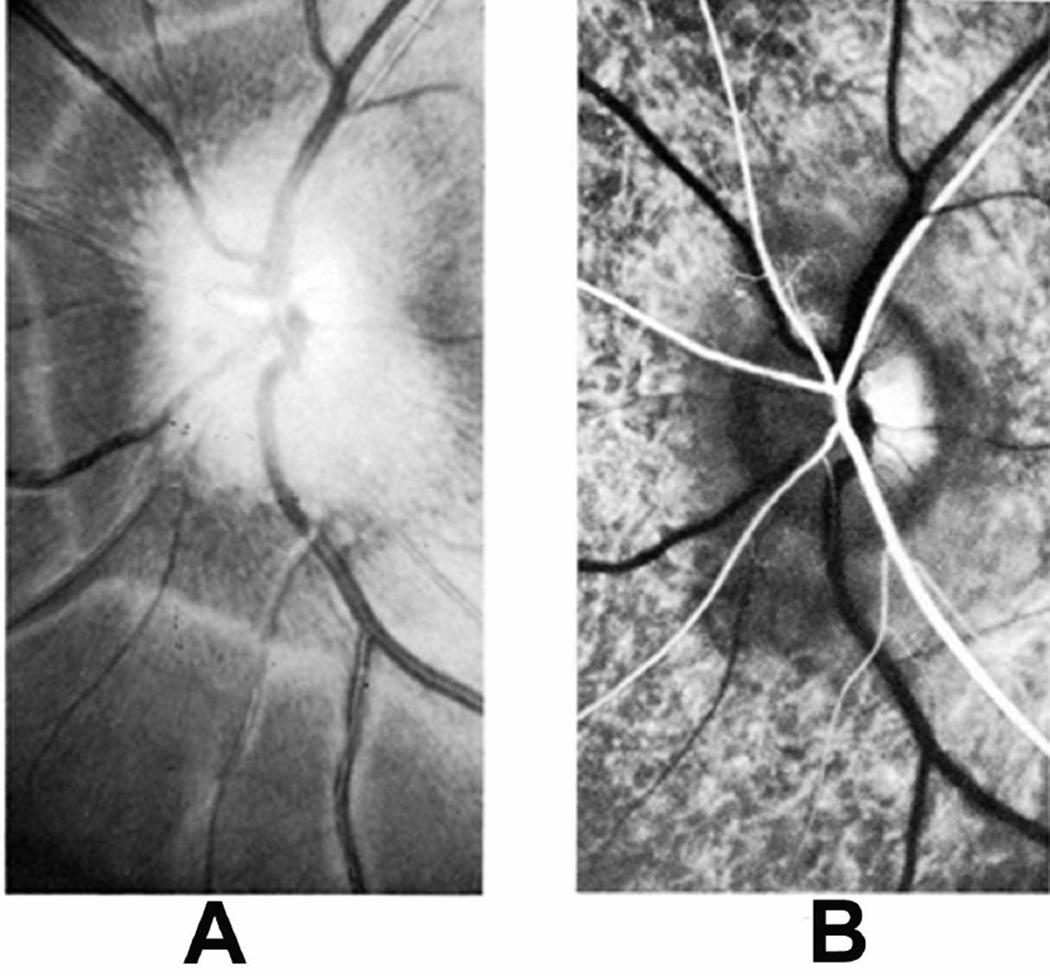
(i)Masking of choroidal fluorescence in the peripapillary zone and deep disc fluorescence was usually seen when optic disc edema was moderately marked or severe (Figs. 27E,28B). The masking effect was prominent during the early part of the transit of the dye, always during the arterial phase and sometimes during the early arteriovenous phase but not after that. It was considered to be due to a masking effect produced by the swelling and striation of the nerve fibers on the disc and in the peripapillary zone.
- (ii)
-
(iii)Blurred disc margins on angiography were most noticeable during the later part of the arteriovenous phase in eyes with moderate to severe optic disc edema (Fig. 27F).
-
(i)
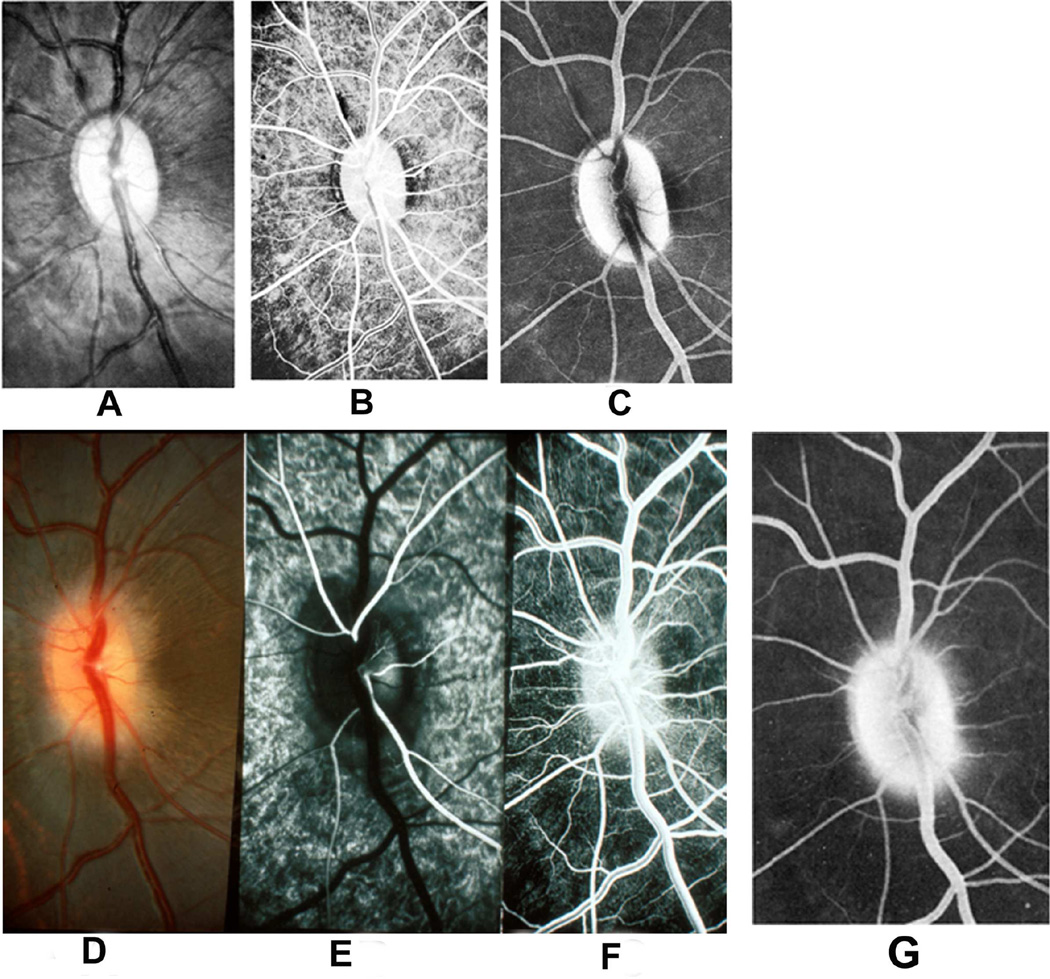
During the Late Phase of Fluorescein Angiography: About 15–20 minutes after the injection of the dye, compared to normal margins (Figs. 27C), all eyes showed blurring of the disc margins that varied from a mild to marked degree (Figs. 26E,27G, 29C). The inferior margin was consistently blurred in all eyes. The superior margin was involved slightly less frequently, but blurred in the majority. Other margins of the disc were also blurred but less often. Involvement of the various margins depended on the severity of optic disc edema.
Fig. 27.
Photographs and fluorescein angiograms of left fundus of a rhesus monkey before (A-C), and five days after introduction of left temporal fossa balloon (D-G). Compare ophthalmoscopic and angiographic changes in the eye from its normal (A-C) to edematous (D-G) states. Figures C and G are late angiograms taken 15 minute after injection of dye. (Reproduced from Hayreh and Hayreh. 1977b)
Fig. 28.
(A) Fundus photograph of a monkey 22 days after introduction of a left temporal fossa balloon, shows marked optic disc edema. Note presence of peripapillary reflex all around the disc.
(B) Fluorescein fundus angiogram of this eye 25 days after introduction of balloon shows masking of optic disc and peripapillary choroidal fluorescence by optic disc edema during retinal arterial phase. (Reproduced from Hayreh and Hayreh 1977b)
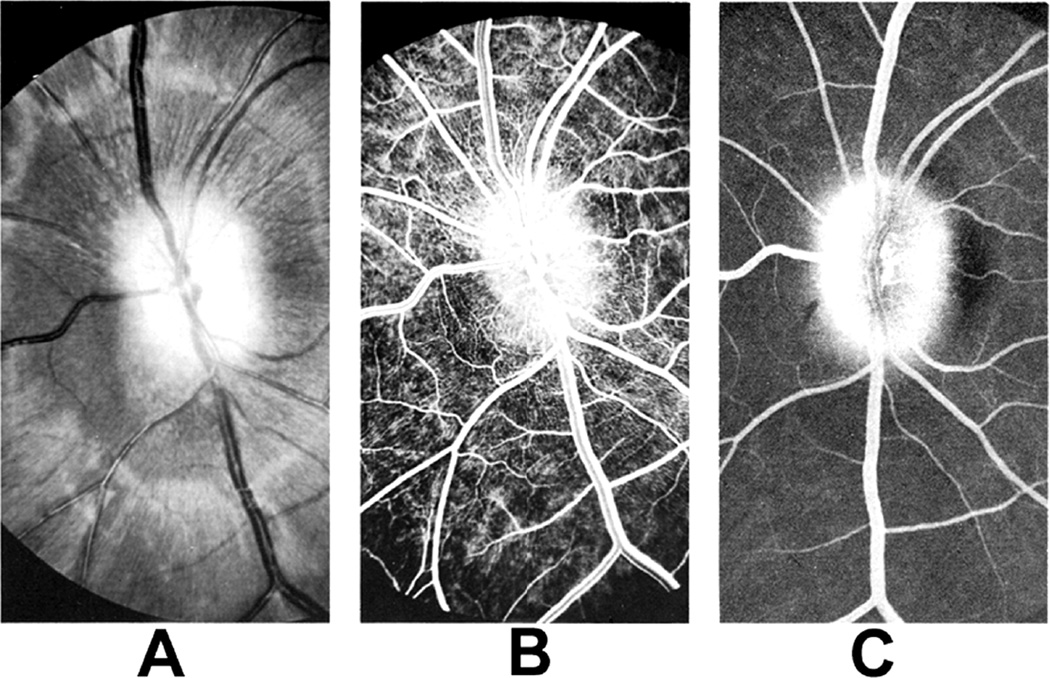
Fig. 29.
Funds photograph and fluorescein angiograms of left fundus of a rhesus monkey 3½ months after introduction of a right temporal fossa balloon and with 11 ml fluid in it.
(A) This shows a wide peripapillary reflex with optic disc edema.
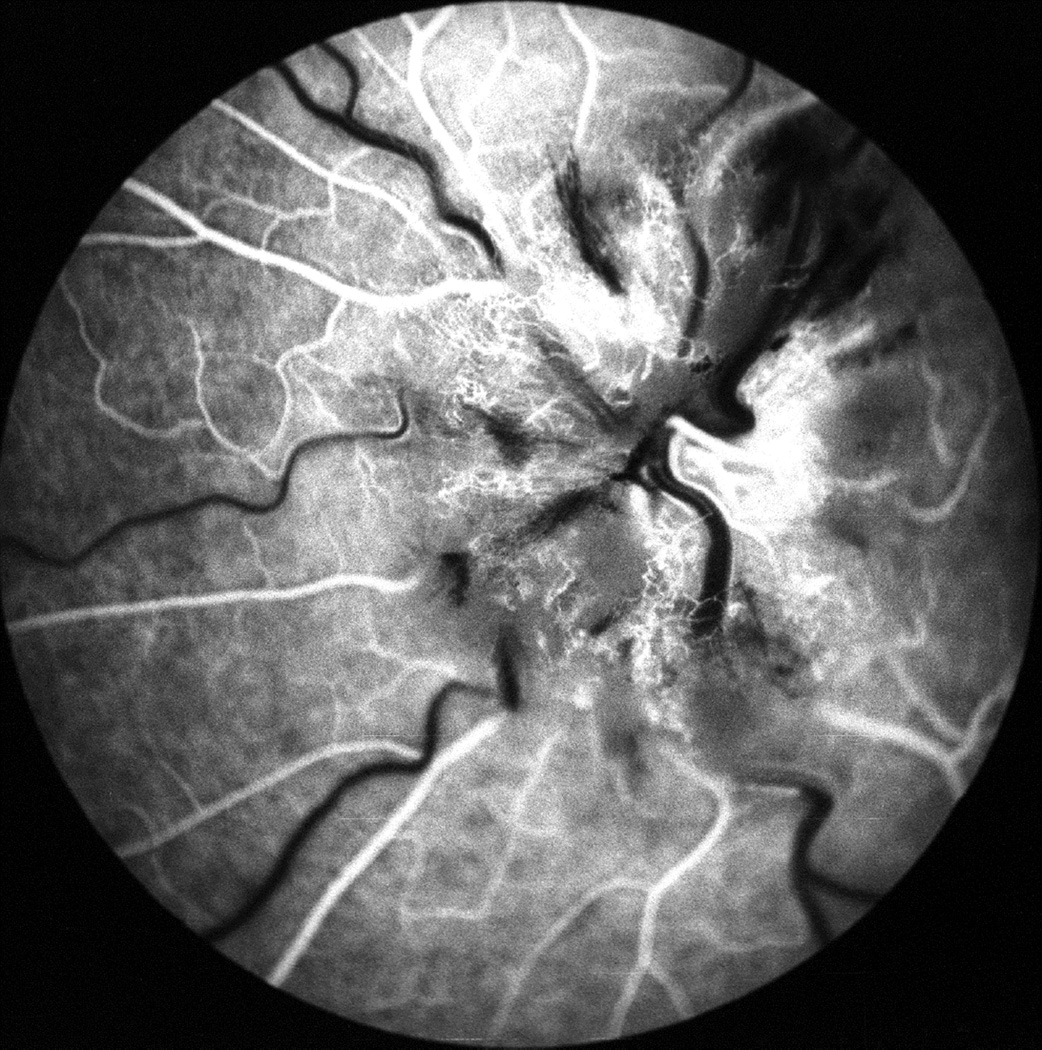
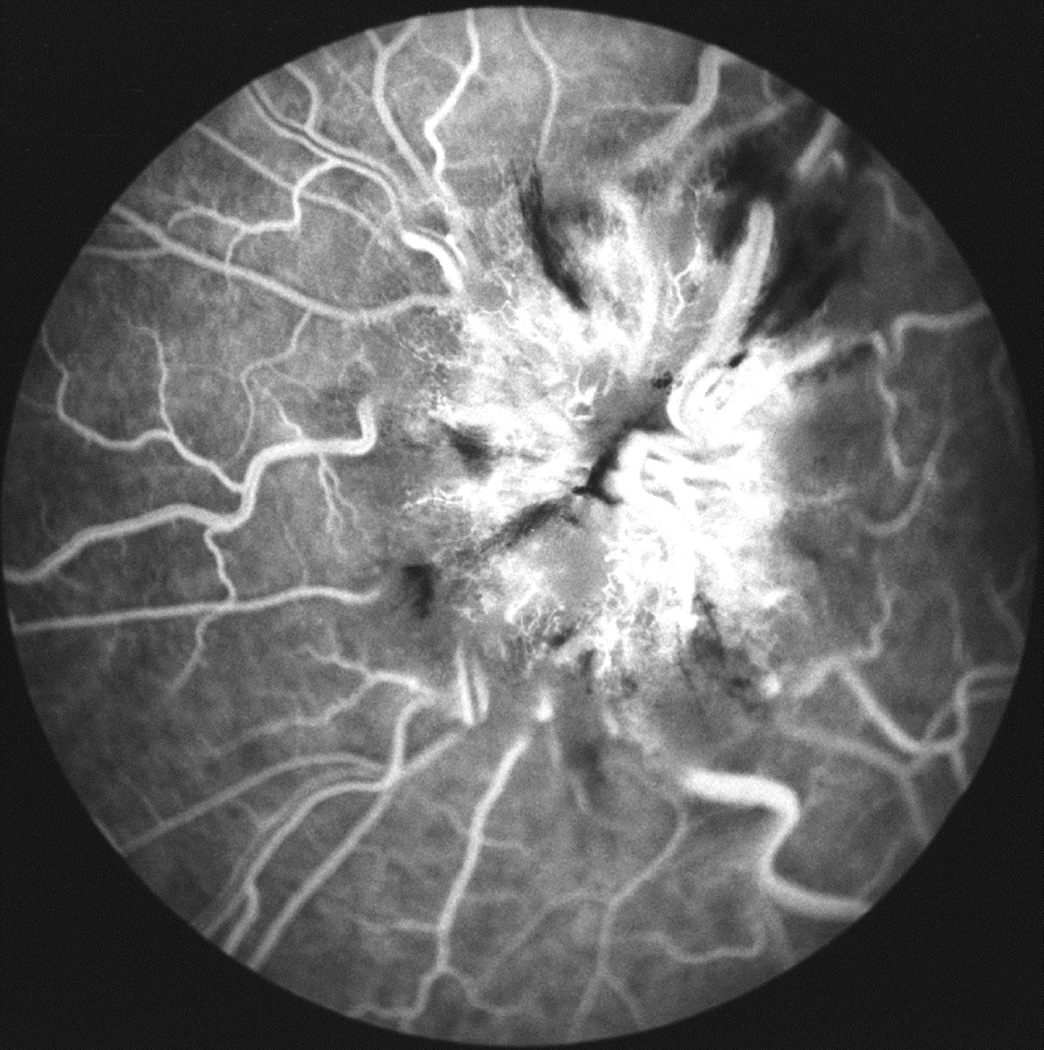
(B) This shows dilated capillaries over disc and peripapillary retina, with blurred disc margins during retinal arteriovenous phase.
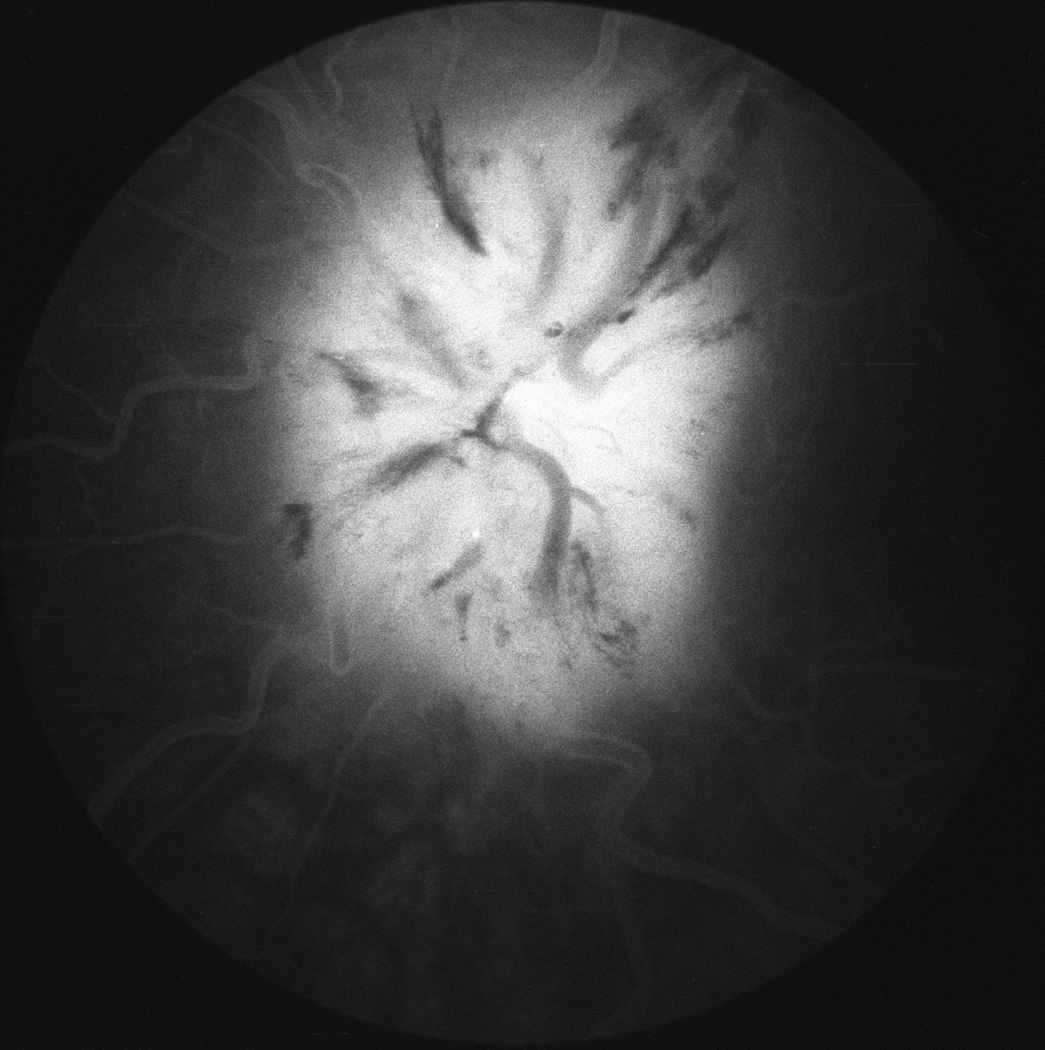
(C) This shows late fluorescein leak in disc 15 minutes after injection of dye. (Reproduced from Hayreh and Hayreh. 1977b)
This study showed that stereoscopic photography detects swelling of the disc first, while fluorescein fundus angiography detects vascular changes later on.
B. Capillary Dilation, Hemorrhages, and Other Retinal Vascular Changes
Stereoscopic fundus photography and fluoresceins angiography showed the following changes:
1. Capillary Dilation, Microaneurysms, and Hemorrhages
Fluorescein fundus angiography revealed capillary dilation and microaneurysms much more frequently than was seen ophthalmoscopically (Figs 27F, 29B). These vascular changes were not seen during very early stages of optic disc edema.
2. Retinal Venous Dilation
No evident change was seen in the retinal veins in mild and moderate degrees of disc edema in either of my studies. This is in sharp contrast to the classical textbook description: Walsh and Hoyt (1969) stated: "Overfilling of the veins is, in our opinion, the most important single evidence of early papilledema"; this opinion has been widely shared. Retinal venous engorgement was a comparatively late phenomenon compared to the onset of optic disc swelling; this is because the swelling of the optic disc has to be severe enough to compress the central retinal vein to produce venous dilation. In view of these studies, I believe that engorgement of the retinal veins should not be included in the criteria to be employed for detection of incipient disc edema. Moreover, the concept of distension of the retinal veins was based on the erroneous concept that that was the primary cause of optic disc edema.
3. Retinal Venous Pulsation
The absence of venous pulsation at the optic disc, as a sign of early optic disc edema, has been very much stressed in textbooks. It has also been said that if a venous pulsation cannot be elicited by gentle pressure on the eyeball, the diagnosis of optic disc edema due to raised intracranial pressure is strongly suggested (Lynn 1959; Walsh and Hoyt 1969). In contrast, some authors did not consider absence of venous pulsation on the optic disc a reliable criterion for the diagnosis of increased intracranial pressure (Williamson-Noble 1952; Huber 1961; Ramsey 1976).
In normal persons spontaneous retinal venous pulsation is seen in at least one eye in 90% of the population (Lorentzen 1970; Ramsey 1976). In my experimental study, some eyes with well-developed optic disc edema still showed definite venous pulsation on the optic disc, and its incidence did not seem to be in any way different from that in the normal eyes. Unfortunately, this sign has been very much abused in clinical practice.
Thus, my experimental controlled studies contradict many prevailing clinical impressions, the vast majority of which are unsupported by any systematic prospective or controlled studies.
Conclusion
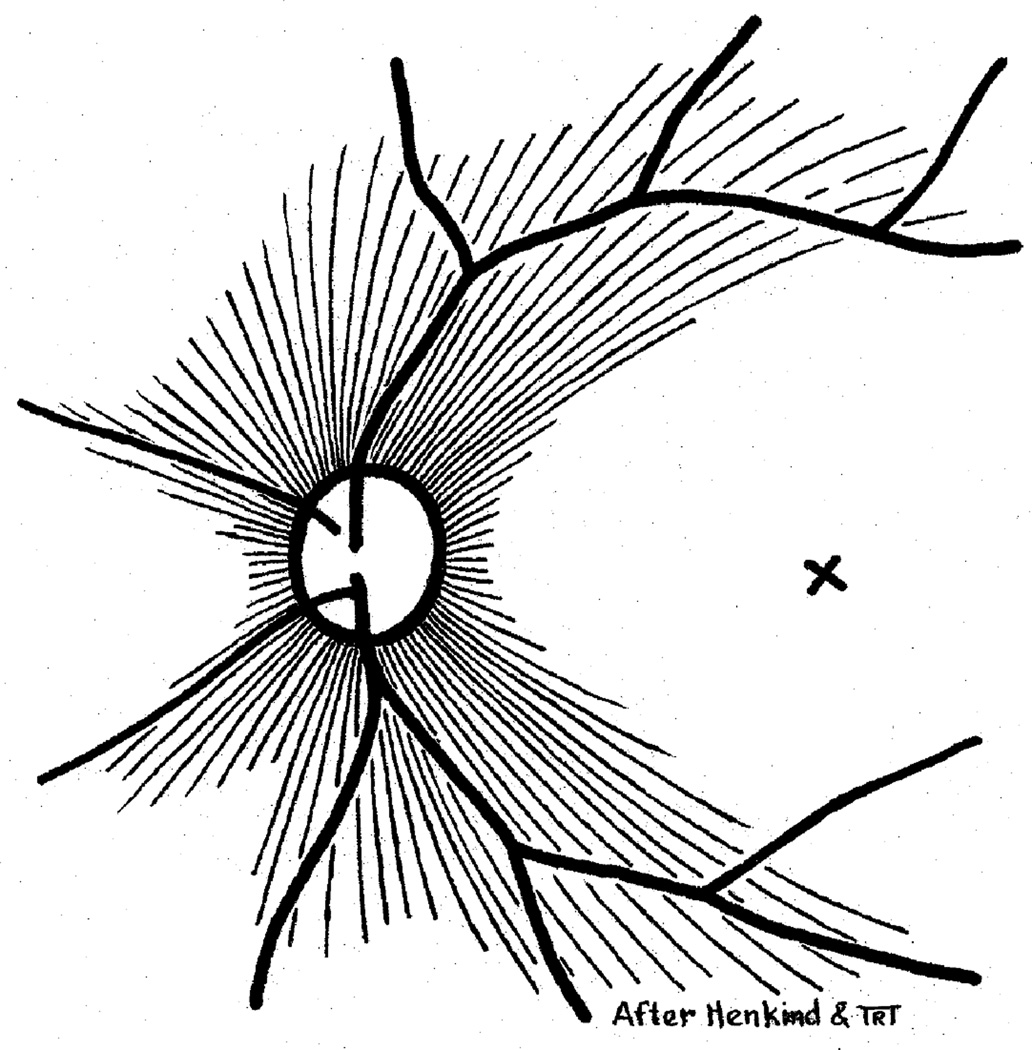
My experimental studies showed that the retinal vascular changes seen in optic disc edema are secondary to the optic disc swelling. Most of the vessels on the surface of the disc are venous, very thin-walled and fine; most of them are terminal portions of the long radial peripapillary capillaries (Fig. 30), and they drain into veins on the optic disc (Fig. 6) (see below). Swelling of the optic nerve fibers in the disc compresses the small vessels at this site and produces stasis in the territory drained by them, thus leading to hyperemia, and dilation of capillaries and formation of microaneurysms in the distribution of the radial peripapillary capillaries. Edema of the disc, when marked, would also compress the main retinal veins and produce distension. Thus, vascular changes do not precede optic disc edema but are in fact secondary to it and represent a fairly late phenomenon.
Fig. 30.
Schematic representation of radial peripapillary retinal capillaries. X = Site of foveola (Reproduced from Henkind P. 1967)
5.3.5. The Time Interval between the Rise of Intracranial Pressure and Development of Optic Disc Edema
This is of great interest. A marked diversity is seen between various anecdotal reports in the literature. At one extreme was a description by Cushing and Bordley (1909) and Parker (1916), who claimed that they could see the development of optic disc swelling by direct pressure on the brain of dogs within a few minutes; this evidently is not only incorrect but also illogical. Glowacki (1962) described development of marked optic disc edema in five to eight hours in two patients, one of whom had a metastatic frontal lobe tumor. (I wonder how he was able to calculate the time.) Most of the authors are of the opinion that it takes about a week to ten days for definite optic disc edema to appear. Walsh and Hedges (1950) found no optic disc edema in patients with raised intracranial pressure due to ruptured aneurysm, who died in a matter of hours, although some neurologists do claim to have seen optic disc edema in such cases. In my first phase studies (see above), when intracranial pressure was acutely elevated to 40 to 60 mm Hg by injection of saline into the cerebello-medullary cistern in rhesus monkeys and maintained for one to two hours, no optic disc changes were seen in all 35 animals. In chronically elevated intracranial pressure caused by introduction of a rubber balloon in rhesus monkeys, in the first phase study, ophthalmoscopic optic disc edema appeared in 2 to 7 days in the majority of animals, although in some it took as many as 17 days (see above). In my second phase study, stereoscopically demonstrable optic disc edema was seen in about 30% within 24 hours, in about 50% within two days, in the vast majority within five days, and in 90% within seven days after the introduction of the balloon; in the rest there might not have been any post-operative rise of CSF pressure. On fluorescein angiography, however, demonstrable changes took longer. The difference in time interval noted between my two studies is due to the fact that the former was based on routine ophthalmoscopy and the latter on stereoscopic fundus photography; also in the former the fundus was examined less often than in the latter because there was no satisfactory and safe anesthetic available at the time of the first study.
5.3.6. Resolution of Optic Disc Edema after Reduction of Intracranial Pressure
It has been stated that fully developed optic disc edema may resolve completely six to eight weeks after successful craniotomy (Walsh and Hoyt 1969). Bettman et al. (1968) similarly reported complete resolution of optic disc edema in idiopathic intracranial hypertension in two months. In my series it was not possible to give a time period required for complete resolution of optic disc edema from its maximum phase, because this would depend upon the severity of optic disc edema and the speed of normalization of intracranial pressure. As pointed out in my first phase experimental study (Hayreh 1965a,1968), a constant inflation of the balloon was required to maintain a high intracranial pressure. If inflation of the balloon was not continued for a sufficient length of time, the intracranial pressure returned to normal in spite of the large-sized balloon lying in the brain, and so did the optic disc edema. The sequence of the resolution was seen to follow a course the reverse of that seen in its evolution. The disc returned to normal when edema had cleared completely.
In my both studies, it was possible to produce complete resolution of optic disc edema by normalizing intracranial pressure, and then to re-produce the optic disc edema by raising the intracranial pressure again. In the second phase study, I produced up to three evolutions of optic disc edema. These demonstrated that the optic disc is capable of showing recurrent optic disc edema. Similar recurrences have been reported in patients, e.g., in those with fluctuating idiopathic intracranial hypertension. Igersheimer (1935) reported two patients with recurrence of optic disc edema; in one case he noticed four evolutions of optic disc edema during a period of seven years.
5.3.7. Ipsilaterality of the Fundus Changes
In my first phase study, the optic disc changes were not usually equal on the two sides and the optic disc edema generally appeared first on the side of the intracranial balloon and was also more marked on that side. This was also the opinion of Hedges (1975). In the second phase study, although my initial impression was somewhat similar, a detailed statistical analysis of the data showed that there was no significant difference between the ipsilateral and contralateral sides in the onset and severity of optic disc edema. However, in this investigation overall, the optic disc changes were usually not equal on the two sides and appeared at different times in the two eyes of an animal. With the balloon in the cerebellar region, the optic disc changes were initially seen to be equal on the two sides in the majority, although in a few of these it either appeared first on the ipsilateral side or were more marked on that side; later on, in all animals the optic disc changes were slightly more marked on the side with the balloon, although in some the ultimate cavity of the balloon occupied a midline position. In the supratentorial group, the fundus changes usually appeared first on the side of the balloon and more marked on that side, and in a few the fundus changes were present on both sides and equally marked when first seen; however, the eyes were not examined daily so that it was not possible to pinpoint on which side the changes appeared first. Later on, however, the fundus changes were invariably more marked on the ipsilateral side, the difference between the two sides being noticeable.
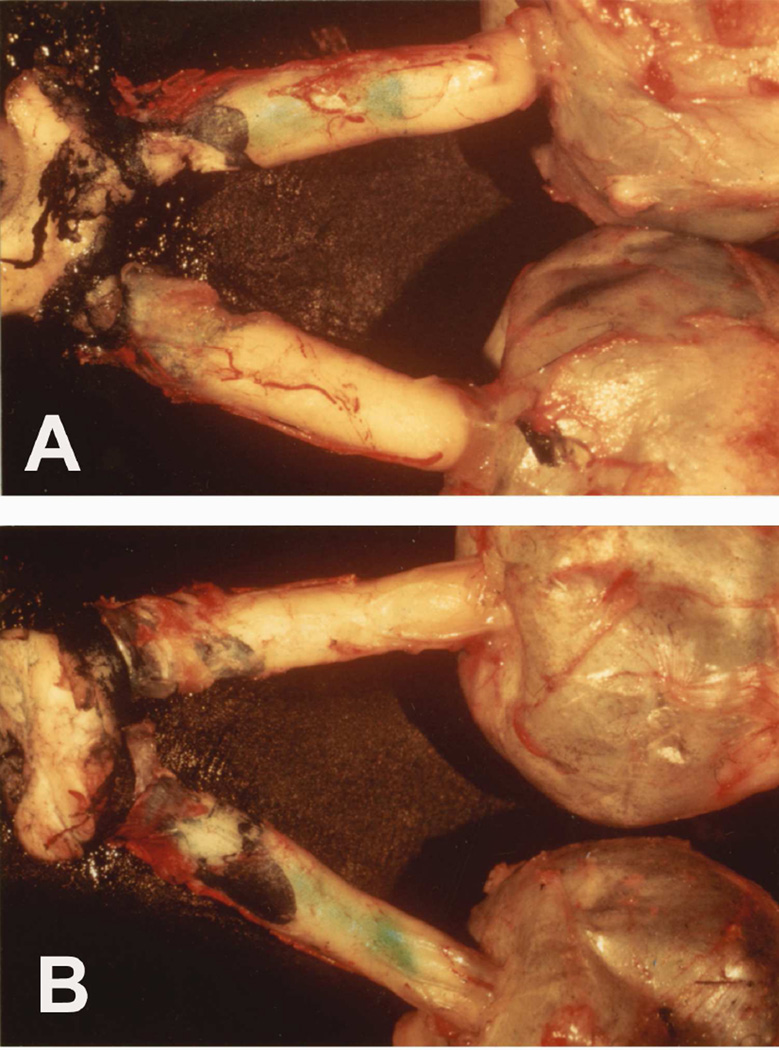
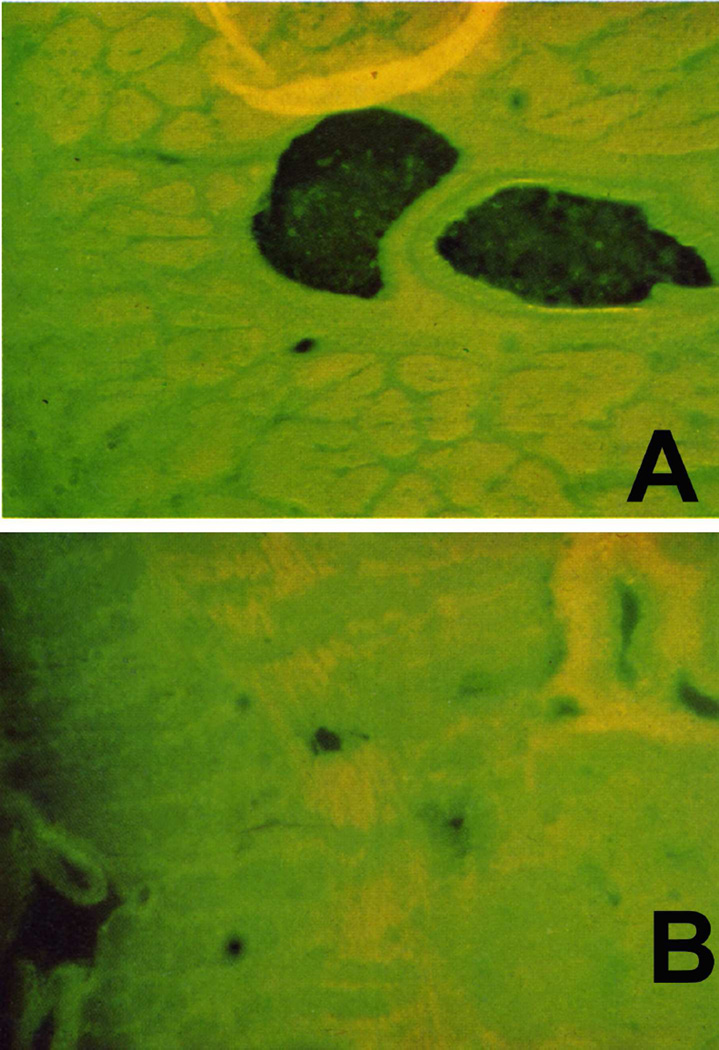
A very interesting observation was made in the first study (Hayreh 1965a,1968) in two rhesus monkeys (the balloon being in the cerebellar region in one and in the temporal region in the other). In them Prussian Blue solution was injected into the cerebello-medullary cistern just before their death. Both animals had a marked difference of edema of the optic disc on the two sides. More filling of the sheath of the optic nerve with the dye was seen on the side with more marked edema of the disc, which was also the side of the balloon (Fig. 31). Although the exact hydrodynamics responsible for such a difference in the distribution of the dye is not clear, this finding is very important in illustrating the mechanism of the production of edema of the optic disc, more marked on the ipsilateral side.
Fig. 31.
Both eyeballs, optic nerves and optic chiasm show distribution of blue dye in the sheath of the optic nerve. (A) From the superior aspect. (B) From the inferior aspect. (Reproduced from Hayreh SS. 1965a)
5.3.8. Effect of Opening the Sheath of the Optic Nerve on the Optic Disc Edema
From the above observations, it can be concluded that the fundus changes associated with edema of the optic disc were related to the rate of growth of the balloon and the raised CSF pressure in the cranial subarachnoid space, and that these were more marked on the side of the balloon, especially when the latter was situated in the supratentorial region. Many authors have mentioned that a rise in the CSF pressure in the optic nerve sheath is essential to produced optic disc edema in raised intracranial pressure.
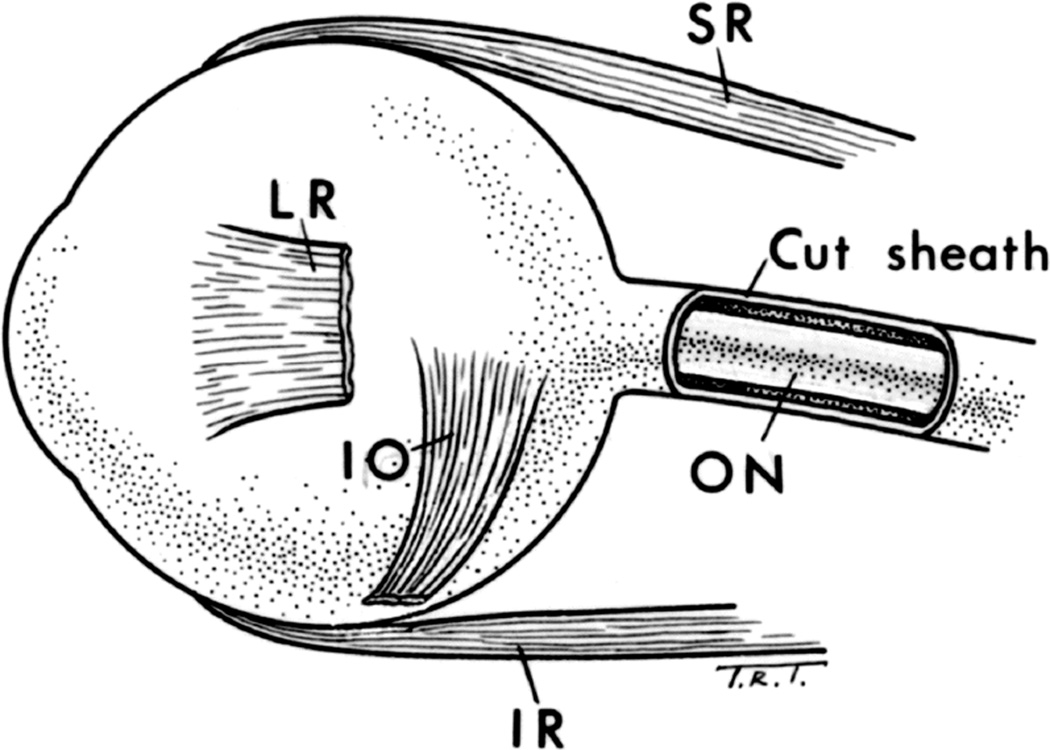
To investigate the role of raised CSF pressure in the production of optic disc edema, I decided to open the sheath of the optic nerve on the ipsilateral side by lateral orbitotomy (Fig. 32). The ipsilateral side was chosen because of its proven involvement and because the changes on this side were normally more marked (sees above).
Fig. 32.
Schematic diagram, showing opened optic nerve sheath.
Abbreviations: LR = Lateral rectus; I0= Inferior oblique; IR = Inferior rectus; 0N = Optic nerve; SR= Superior rectus. (Reproduced from Hayreh SS. 1964b)
This investigation was carried out in 11 monkeys (Hayreh 1964b,1965a). In one, the balloon was in the central and adjoining left part of the cerebellum, while in all the others it was in the temporal region. The study was carried out in the following three combinations between the inflation of the balloon and the opening of the sheath of the optic nerve, to rule out artefacts.
Group I
The balloon was distended to a certain level and the fundus changes were observed on both sides. Then the sheath was opened and the balloon was still further distended gradually in 5 animals. The optic disc edema progressed on inflation of the balloon, being more marked on the side of the balloon. At this stage, on opening the sheath on the side of the balloon and subsequent inflation of the balloon, the disc edema on the ipsilateral side subsided and the disc returned to the normal in a few days (Fig. 33). On the other hand, the changes on the contralateral side, with the sheath intact, either progressed or remained stationary at that level, except in one monkey where the disc returned to normal on both sides and remained normal in spite of further inflation of the balloon.
Fig. 33.
(A) Rate of inflation of the balloon and CSF pressure, in a monkey before and after optic nerve sheath fenestration. (Reproduced from Hayreh SS. 1965a)
(B) Fundus photographs of both eyes of a rhesus monkey 79 days after insertions of the balloon. The optic nerve sheath was cut opened on the left side 25 days after insertions of the balloon (A). It shows optic disc edema of the right optic disc and normal optic disc on the left side. (Reproduced from Hayreh SS. 1965a)
Group II
The balloon was inserted but was not inflated in one monkey. The optic disc edema on both sides due to the post-operative reaction was allowed to subside and then, when the discs were normal, the sheath was opened and the balloon was inflated. The fundus on the side where the sheath was opened remained normal all along, while the contralateral side had marked optic disc edema. Thus, in the same animal the pattern of fundus changes was reversed by opening the sheath.
Group III
The sheath of the optic nerve was opened simultaneously with the introduction of the balloon in 5 monkeys. The balloon was inflated later as usual. In these animals, no post-operative reactionary optic disc edema was seen on the side of the opened sheath, while it was present on the contralateral side with the intact sheath. With subsequent inflation of the balloon, on the side with the opened sheath the fundus remained normal all along, while the contralateral side showed the usual marked fundus changes.
Thus, these consistent findings showed that high pressure in the sheath of the optic nerve, due to a rise in the CSF pressure intracranially, is responsible for edema of the optic disc and the associated fundus changes. I found that optic nerve sheath fenestration on one side in many cases reduced optic disc edema in the fellow eye as well; this has also been shown by a clinical study in 78 patients (Alsuhaibani et al. 2011). This indicates that the sheath fenestration also lowers the CSF pressure in the intracranial region of the optic canals.
Histological examination of the optic nerve (Fig.34), where the sheath of the optic nerve was cut open (Fig. 34A), showed that the gap in the sheath of the optic nerve filled in by a proliferation of the connective tissue which was adherent to the pia, so that no normal spaces of the sheath were present in the region of the fenestration; however, the spaces were normal in all other parts of the sheath, medially, distally and proximally to the cut area (Fig. 34B). In some specimens where a serial sectioning of this region of the sheath was done, this proliferation of connective tissue was found to be missing in places and was replaced by only a very loose, thin layer of the tissue (Fig. 34B – white arrow). The optic nerve underlying the cut part of the sheath was normal. This suggests that most probably the continuing release of pressure in the sheath of the optic nerve was due to the CSF seeping through the loose tissue in the area where the sheath was cut open. Tsai et al. (1995), in one patient, with idiopathic intracranial hypertension and optic disc edema who had optic nerve sheath fenestration, histopathological and ultrastructural examination showed fibroblasts localized to the site of fenestration. Adipose tissue was also adherent to the optic nerve pia in areas of incised dura. They concluded that filtration of CSF after optic nerve sheath decompression may occur through an enclosed bleb of fibrosis rather than through an open fistula.
Fig. 34.
(A,B) Longitudinal sections of the optic nerves show anterior part of the optic nerve sheath and its cut region of the sheath.
(A) Arrows indicate the two cut edges of the sheath. Abbreviations: A = Arachnoid; D = Dura; N = Ciliary nerve.
(B) Shows the cut part of the sheath (black arrow) and the part filled by a loose connective tissue (white arrow).
Sanders (1997) postulated that lack of development of optic disc edema after optic nerve sheath fenestration may be due to development of fibrous tissue around the optic nerve at the site of fenestration, which prevents the transmission of the CSF pressure to the optic nerve head. My study does not support that view because, as mentioned above, my histological study showed that the optic nerve sheath was still patent all around the optic nerve except in the localized area of fibrosis at the site of the opening in the sheath (Fig. 34B), so that fibrous tissue did not close the sheath of the optic nerve completely. Sallomi et al. (1998), on post-operative magnetic resonance imaging in cases with optic nerve sheath fenestration, showed decreased CSF volume around the optic nerve and a fluid collection within the orbit.
After completing my study on optic nerve sheath opening in experimentally produced optic disc edema in raised intracranial pressure, when writing my findings (Hayreh 1964b, 1965a), I conducted a literature search. Surprisingly, I discovered that De Wecker had reported in 1872 a procedure in which he inserted a neurotome, without anesthesia, in two patients with optic disc edema in raised intracranial pressure; he reported relief of headache, improvement of symptoms, and improvement of vision in one patient. There were reports of the same procedure in one patient by Power (1872) and by Carter (1888) in 15 patients. No one did the procedure again after these three reports (most probably because De Wecker’s procedure not only had no beneficial result but also resulted in complications), till I published my study in rhesus monkeys in 1964 (Hayreh 1964a). Since then optic nerve sheath fenestration has become a common standard procedure in patients with optic disc edema due to raised intracranial pressure and visual deterioration, and all the published reports have shown its beneficial effect.
6. PATHOLOGICAL STUDIES
6.1. IN THE FIRST PHASE OF THE STUDY
Routine microscopic evaluation was carried out on the eyeball and the optic nerve in half of the animals. This is discussed elsewhere (Hayreh 1965a). The animals were fixed either intravitally or within 10–15 minutes of death, so that postmortem changes could be excluded. Whenever edema was present, swelling of the optic disc was seen. The pathological changes were seen in the optic disc and prelaminar region, and no changes were seen in the region of the lamina cribrosa and the rest of the optic nerve (Fig.35B). Lamina cribrosa is a dense fibrous tissue band, incapable of bending or swelling with the amount of raised intracranial pressure seen in these animals or clinically in patients. When the optic disc swelling was marked, it displaced the adjacent retina, and in marked optic disc edema there was mild retinal detachment in the peripapillary region. No other changes were detected in the retina or rest of the optic nerve. No change was seen in the sheath of the optic nerve, except in the animals in which it had been cut open (see above).
Fig. 35.
Longitudinal sections of optic nerve head in rhesus monkey: (A) Normal, and (B) with swelling of the disc secondary to raised intracranial pressure. (Reproduced from Hayreh SS. 1964b)
6.2. IN THE SECOND PHASE OF THE STUDY
In this study, light microscopic, horseradish peroxidase, electron microscopic and axoplasmic flow studies were conducted. The methods and findings of these studies are discussed in detail elsewhere (Tso and Hayreh 1977a,b). Following is a brief account.
6.2.1. Light Microscopic Study
This study was conducted in 21 eyes. The findings are discussed at length elsewhere (Tso and Hayreh 1977a). Briefly, in the typical swollen optic nerve head, the axons in the surface nerve fiber layer on the optic disc and anterior part of the prelaminar region were grossly swollen and had a vacuolated appearance (Fig. 36A). In the peripapillary region, the swollen axons displaced the adjacent retina laterally (Fig. 36B). The nerve fiber layer of the peripapillary retina was also thickened. Serous detachment of the retina was seen around the optic nerve head with severe optic disc edema. At times, cytoid bodies, consisting of a dense nucleoid and paler cytoplasm, were noted in this location (Fig. 36A). In the prelaminar and lamina cribrosa regions, vacuolated axons were occasionally seen (Fig 37). The retrolaminar part of the optic nerve showed no swelling of the axons or any other abnormality. The blood vessels of the optic nerve head, the peripapillary choroid, and the pia mater showed no remarkable changes. No inflammatory reaction was seen in the optic nerve head.
Fig. 36.
0ptic nerve head of rhesus monkey with optic disc edema secondary to raised intracranial pressure.
(A) Note elevation of floor of optic disc. In peripapillary region (arrows), retina is displaced laterally, and axons have vacuolated appearance and abut retinal pigment epithelium (toluidine blue stain, original magnification x 110). (Reproduced from Tso and Hayreh. 1977a)
(B) Optic disc edema (toluidine blue stain, original magnification x 100).
Fig. 37.
Vacuolated axons (black and white arrows) noted in region of prelaminar and lamina cribrosa regions. Swollen axons (black arrows) are also present in peripapillary region. BM = Bruch's membrane (toluidine blue stain, original magnification x 120). (Reproduced from Tso and Hayreh. 1977a)
Thus, this study showed that in optic disc edema in raised intracranial pressure there are severe axonal swellings and mild interstitial edema in the optic nerve head, but no intracellular edema of the glial elements. Axonal swelling was so prominent that it appeared to be primarily responsible for the overall swelling of the optic disc, as observed ophthalmoscopically. Some of the axonal swellings gave a histologic appearance of cytoid bodies (Fig. 36A), which were believed to be an attempt by the axons to localize the degenerative dense bodies in the process of recovery (Tso and Fine 1976).
6.2.2. Horseradish Peroxidase Study
This study was conducted in 21 eyes. The findings are discussed at length elsewhere (Tso and Hayreh 1977a). Briefly, since horseradish peroxidase normally diffuses into and outlines the interstitial space of the optic nerve head (Tso et al. 1975), this tracer material helps to determine the vascular change and the extent and site of interstitial edema. Horseradish peroxidase was injected intravenously 5 to 30 minutes before the monkeys were killed. The blood vessels in the surface nerve fiber layer appeared unchanged, and showed no evidence of leakage of the tracer material, and the interstitial space was not enlarged. In the posterior part of the nerve fiber layer and prelaminar and lamina cribrosa regions, the tracer material was abundantly present in the interstitial space (Fig. 38). The swollen axons, which displaced the peripapillary retina laterally, were also entirely surrounded by the tracer material. The tracer material aggregated around the perivascular extracellular space and heavily infiltrated the basement membrane of the endothelial cells and the pericytes of the blood vessels. An increased number of pinocytotic vesicles were noted both in the pericytes and endothelial cells. Also, the tracer material was found aggregated in pockets between adjacent endothelial cells and extending into the basement membrane of the endothelial cells. In the peripapillary region, the tracer material was seen extending from the optic nerve into the subretinal space. In the prelaminar region, there was plenty of tracer material in the interstitial space of the choroidal stroma, which passed through the permeable border tissue of Elschnig, and infiltrated around the axons in the optic nerve head. The tracer material was also seen in the interstitial space between myelinated nerve fibers in the retrolaminar optic nerve.
Fig. 38.
Deeper region of the nerve fiber layer shows accumulation of tracer material in interstitial space (black and white arrows). Horseradish peroxidase-reaction product is entirely confined within its lumen (L). Horseradish peroxidase also infiltrates basement membrane of endothelial cells and pericytes (black arrows) (original magnification x 6,700). (Reproduced from Tso and Hayreh. 1977a)
The pattern of vascular leakage and interstitial edema in optic disc edema in raised intracranial pressure was distinctive and consistent. The direct leakage of tracer material from blood vessels in this region contributed to the extravasation of the tracer. The occasional observation of fibrinous deposit in the interstitial space strongly suggested direct leakage from the blood vessels. The endothelial cells and pericytes of blood vessels in this region had a large number of pinocytotic vesicles; therefore, vesicular transport might have played a role in the extravasation of the tracer substance. Additionally, the presence of pockets of the tracer aggregation in between adjacent endothelial cells and extension of the tracer into the basement membrane suggested that the cell junctions of the endothelial cells might not be competent.
The pattern of extravasation of horseradish peroxidase in this experimental study provides an explanation of the leakage of fluorescein in fluorescin angiography seen in optic disc edema, and also that optic disc edema is due to a combination of axonal swelling and to fluid leakage from the blood vessels with accumulation of extracellular fluid.
6.2.3. Electron Microscopic Study
This study was conducted in 21 eyes. The findings are discussed at length elsewhere (Tso and Hayreh 1977a). Briefly, the primary change was in the axons. The swollen axons observed by light microscopy in the optic nerve head contained a few, scattered, disoriented mitochondria in a lucent cytoplasm (Fig. 39). The neurotubules were frequently disrupted. The axons that showed the most swelling were in the peripapillary region where the retina was displaced laterally. In some axons, groups of giant mitochondria, 30 to 60 times larger than the average mitochondria with irregularly arranged cristae were seen. Some of the axons demonstrated severe hydropic degeneration. The adjacent axons were frequently of irregular shape and contained mitochondria that were dense. Other swollen axons contained numerous, dense, laminated bodies and abundant mitochondria with dense or lucent ground substance (Fig. 40). In the vicinity of these axons, a small amount of extracellular fibrin was occasionally noted (Fig. 40). These different morphologic appearances of the axons probably represented a range of axonal injuries, exhibiting different stages of degeneration or regeneration in different segments of the affected axons.
Fig. 39.
Swollen axons (A) in the deeper region of the nerve fiber layer. Neurotubules in axons are disrupted. Some axons in immediate vicinity of swollen axons are of normal size, and their neurotubules and mitochondria appear intact. Glial elements (G) in this region are not swollen (original magnification x 14,600). (Reproduced from Tso and Hayreh. 1977a)
Fig. 40.
Some axons (A) in deeper region of the nerve fiber layer are filled with mitochondria and laminated dense bodies. Fibrin deposits (arrows) are observed in interstitial space between axons (original magnification x 7,400). (Reproduced from Tso and Hayreh. 1977a)
Most of the glial cells in the optic nerve head showed no abnormality. A few, however, contained cellular debris. Others deposited multiple layers of basement membrane in the perivascular space. The glial cells of the intermediate tissue of Kuhnt were disrupted in severe optic disc edema so that the swollen axons in the peripapillary region were in direct contact with the pigment epithelial cells.
In the peripapillary region, the retinal pigment epithelium demonstrated reactive changes. The melanin granules in these cells were irregularly arranged. Some of the cells had vacuoles.
Schutta and Hedges (1971) studied one monkey with optic disc edema secondary to raised intracranial pressure and one monkey with disc edema secondary to induced ocular hypotony and raised intracranial pressure. They also observed axonal swelling. These authors, however, erroneously interpreted the swelling of the axons in their experimental model as a fixation artifact. They further suggested that the swollen axons in their experimental model were due to imbibition of interstitial fluid into axons that were partially damaged by fixation. However, in our above tracer study, even though these swollen axons were completely surrounded extracellularly by the horseradish peroxidase, the tracer material rarely diffused into the axoplasm. The autoradiographic study of these animals with optic disc edema below also failed to show diffusion of tritiated leucine, which has a molecular weight of 131.2, into these swollen axons six hours after intravitreous injection of the isotope (see below).
6.2.4. Axoplasmic Transport Study
The findings of this study are discussed at length elsewhere (Tso and Hayreh 1977b). Following is a brief summary. Tritiated leucine, 100 µCi, was injected in the vitreous in 17 eyes of rhesus monkeys with optic disc edema due to raised intracranial pressure, and in 7 eyes of normal, healthy adult rhesus monkeys. The methods of tissue preparation, autoradiographic preparation and other details are discussed in detail elsewhere (Tso and Hayreh 1977b). Fast and slow components of axoplasmic transport along the optic nerve axons were studied.
Following were the autoradiographic findings after the intravitreous injection of tritiated leucine.
Pattern in Eyes with Optic Disc Edema
Six hours after the injection: (i) There was heavy labeling in the ganglion cells of the retina (Fig. 41), (ii) moderate labeling in the glial cells on the anterior surface of the optic disc, and the perivascular glial cells, (iii) only light labeling of the nerve fiber layers of the retina, as well as the swollen axons in the optic disc, (iv) silver grains aggregated as a broad band in the axonal bundles of the prelaminar and lamina cribrosa region, (Fig. 41), and (v) the labeling dropped off sharply in the retrolaminar myelinated portion of the optic nerve.
Two to four days after the injection: (i) Marked accumulation of silver grains was seen in the axonal bundles of the entire optic nerve head anterior to the prelaminar and lamina cribrosa region (Fig. 42). (ii) The glial tissues in this region were only lightly labeled. (iii) The peripapillary region, where the axons appeared severely swollen and displaced the retina laterally, was heavily labeled. (iv) The myelinated optic nerve was also lightly labeled at this time.
Seven to 12 days after the injection: (i) Silver grains continued in large quantity in the axonal bundles of the entire optic nerve head (Fig. 43). (ii) Moderate labeling was observed in the retrolaminar myelinated optic nerve; however, there were still substantially more silver grains in the axonal bundles in the prelaminar and lamina cribrosa region than in the retrolaminar myelinated optic nerve.
Fig. 41.
Top: Autoradiograph of optic nerve head of rhesus monkey with optic disc edema secondary to raised intracranial pressure. Eye was enucleated six hours after intravitreous injection of tritiated leucine. Note accumulation of silver grains in ganglion cells of retina (single black arrow), supporting meniscus tissue of Kuhnt (double black arrows), Bergmeister papilla (B), perivascular glial tissue and axonal bundles in region of prelaminar and lamina cribrosa regions (black and white arrows) (paraphenylenediamine, original magnification x 80).
Bottom: Prelaminar and lamina cribrosa regions under higher magnification. Note accumulation of silver grains in axonal bundles (arrows). Few grains are present over connective tissue septa separating axonal bundles (paraphenylenediamine, original magnification x 300).
Fig. 42.
Autoradiograph of optic nerve head with optic disc edema three days after intravitreous injection of tritiated leucine. Abundant silver grains (arrows) were observed in axonal bundles of entire optic nerve head anterior to retrolaminar myelinated optic nerve (ML) (paraphenylenediamine, original magnification x 60).
Fig. 43.
Top: Autoradiograph of optic nerve head with optic disc edema injected with tritiated leucine 12 days before enucleation. Abundant silver grains still present in entire optic nerve head anterior to retrolaminar myelinated optic nerve (ML) (paraphenylenediamine, original magnification x 80). Bottom: Prelaminar and lamina cribrosa regions just anterior to ML under higher magnification. Considerable amount of silver grains still present in axonal bundles (arrows) (paraphenylenediamine, original magnification x 300).
Figure 44 shows a plot of the amount of silver grains per unit area in 5 optic nerve heads with optic disc edema 6 hours, and 1½, 3, 8 and 12 days after the injection. The grain counts of each eye showed a peak at the lamina cribrosa. The highest count was noted at this area three days after injection of the isotope. The grain counts dropped off rather precipitously in the retrolaminar optic nerve. A considerable number of silver grains remained in the optic nerve head 12 days after injection of the isotope.
Fig. 44.
Grain counts per unit area in different regions of optic nerve head with edema secondary to raised intracranial pressure. Grain counts have been corrected for glial and myelin correction factor. Grain counts for each curve taken from autoradiographic preparation of optic nerve head from eyes enucleated six hours and 1½, 3, 8, and 12 days after intravitreous injection of tritiated leucine.
Abbreviations: ALR = anterior part of nerve fiber layer; LC = lamina cribrosa; ML = anterior line of retrolaminar myelinated optic nerve; NFL = Nerve fiber layer; ON = optic nerve; PL = prelaminar region; PLR = posterior part of nerve fiber layer;
Pattern in Optic Nerve Heads of Normal Rhesus Monkeys
Figure 45 shows a plot of the amount of silver grains per unit area in 4 normal optic nerve heads 6 hours, and 1, 4 and 12 days after the injection.
Fig. 45.
Grain counts per unit area in different regions of the normal optic nerve head. Grain counts have been corrected for glia and myelin correction factor. Grain counts for each curve taken from autoradiograph preparation of optic nerve head from eyes enucleated six hours and 1, 4, and 12 days after injection of tritiated leucine into vitreous cavity.
Abbreviations: ALR = anterior part of nerve fiber layer; LC = lamina cribrosa; ML = anterior line of retrolaminar myelinated optic nerve; NFL = Nerve fiber layer; ON = optic nerve; PL = prelaminar region; PLR = posterior part of nerve fiber layer
Figs. 46–68: Fundus photographs show three grades of severity of optic disc edema and other fundus changes due to raised intracranial pressure.
-
(i)
Six hours after the injection: Only relatively small amounts of silver grains were noted in the axonal bundles of the optic nerve head.
-
(ii)
One day after the injection: There were a considerable number of silver grains in the optic disc, and the grain counts dropped off relatively precipitously posterior to the lamina cribrosa.
-
(iii)
Four days after injection: The peak amount of the isotope appeared to have passed into the myelinated optic nerve.
-
(iv)
Twelve days after injection: Only a small amount of radioactivity remained in the optic nerve head.
These findings in optic disc edema secondary to raised intracranial pressure show that the fast and slow components of axoplasmic transport were disturbed.
The Fast Component of Axoplasmic Transport
This accumulated in the prelaminar and lamina cribrosa regions six hours after intravitreous injection of the isotope.
The Slow Component of Axoplasmic Transport
This arrived at the optic nerve head two to four days later. At this time, the swollen axons of the entire optic nerve head were filled with radioactive isotope. Twelve days after injection, the isotope cleared from the optic nerve head in normal animals, but in those with optic disc edema, the optic nerve head was still diffusely labeled.
The persistent labeling of the optic nerve head 12 days after administration of the isotope further supported the evidence that in optic disc edema there were axoplasmic stasis and delay in transit of axoplasmic components from the optic nerve head to the retrolaminar optic nerve. There is also the possibility of tritiated leucine incorporation into the structural proteins of the tissues in optic disc edema due to increased intracranial pressure. On the other hand, the continual decline of grain counts in most regions of the optic nerve head from three to 12 days suggested that some axoplasmic components did pass from the prelaminar and lamina cribrosa regions into the retrolaminar region of the optic nerve.
A peak grain count in the region of the lamina cribrosa was observed in all eyes with optic disc edema that were enucleated six hours to 12 days after administration of the isotope. This suggested that the site of obstruction of both the fast and slow components of axoplasmic transport were located in this region. The factors causing an increase of axoplasmic stasis at this region were difficult to define. It should be noted, however, that the narrowest overall cross-sectional surface area of the normal optic nerve is at the level of Bruch's membrane and not at the prelaminar or lamina cribrosa regions (Minckler et al. 1976). Furthermore, the average axonal diameter in the region of the lamina cribrosa is greater than that in the regions of the nerve fiber layer and prelaminar region (Minckler et al. 1976). Therefore, the axonal bundles in the region of the lamina cribrosa do not appear to be situated at an anatomic bottleneck. Ernest and Potts (1968) observed in the cat that the tissue pressure in the optic nerve posterior to the lamina cribrosa was independent of the intraocular pressure and was directly affected by the CSF pressure. Since the intraocular pressure is normally higher than the CSF pressure, a pressure differential is present at this location. A disturbance of pressure differential in optic disc edema as the primary cause for production of axoplasmic stasis is a possibility and is discussed later (see below). Accumulation of mitochondria in swollen axons observed by electron microscopy in the optic nerve head is further evidence of axoplasmic flow stasis.
Since axoplasmic flow stasis was the primary factor giving rise to the swelling of the axons, this study provided an explanation for the well-known clinical observation that eyes with optic atrophy do not develop optic disc edema, as discussed above. Naturally, if there are no intact axons in their optic nerve head, there is not going to be any swelling of the optic disc.
Wirtschafter et al. (1975) speculated in a purely deductive paper that axoplasmic flow stasis was the cause of optic disc edema in raised intracranial pressure. They postulated that that represents both intra-axonal and extra-axonal accumulation of axoplasm. They proposed that there is a leakage of axoplasmic fluid through the axolemma in the prelaminar region into extracellular space in this area, and the volume of the prelaminar extracellular space, which they considered important in the production of swollen disc. Our axoplasmic flow studies revealed no extracellular accumulation of the labeled radioactive isotope, refuting this speculation.
7. Summary of My Findings Providing Insight into Pathogenesis of Optic Disc Edema in Raised Intracranial Pressure
As discussed above, optic disc edema in raised intracranial pressure has been known since 1853; however, its pathogenesis has been controversial ever since; a host of theories have been postulated to explain it (Hayreh 1965a, 1968,1977a), many based purely on speculation, but none has stood the test of time. My systematic experimental studies, discussed above, collectively provide understanding about the pathogenesis of optic disc edema in raised intracranial pressure. They showed the following.
7.1. Invalidity of Previous Common Theories
That the theory most commonly put forward over the years - that compression of the central retinal vein causes optic disc edema in raised intracranial pressure by raising blood pressure in it, is not valid.
That the theory that blockage of the centripetal flow of fluids along the optic nerve by raised cerebrospinal fluid pressure causes optic disc edema in raised intracranial pressure is not supported by the evidence.
Histopathological studies showed that optic disc edema is not a manifestation of cerebral edema. This contradicts the view by Glew (1960) and others before him.
Acute intracranial hypertension lasting for several hours does not produce optic disc edema, in spite of a rise in blood pressure in the ophthalmic vein (also in the central retinal vein), and the ophthalmic artery (also in the central retinal artery).
Following is a brief recapitulation of the studies discussed above, which provided further useful information for an in-depth understanding of the pathogenesis.
7.2. Role of the Raised CSF pressure in the Optic Nerve Sheath
The studies showed that successful transmission of raised CSF pressure in the cranial subarachnoid space into the optic nerve sheath in chronic intracranial hypertension is an essential prerequisite for the production of optic disc edema. I showed that decompression of the sheath of the optic nerve in these cases produced disappearance of optic disc edema on that side; this has since been amply confirmed in human studies. The other important feature found was that in the optic canal area the communication between the intracranial subarachnoid space and that of the optic nerve sheath is usually reduced to almost capillary size (Figs. 2–4), and not a free communication, which is a common impression. This can result in the slow equalization of the CSF pressure in the sheath and the cranial cavity. Therefore, the anatomy of the sheath of the optic nerve in the region of the optic canal has great clinical importance since it plays a crucial role in the dynamics of conveying the CSF pressure of the cranial cavity into the sheath of the optic nerve in cases of raised intracranial pressure.
7.3 Histopathologic Findings
These showed that the edematous changes were limited to the part of the optic nerve head in front of the lamina cribrosa and the adjacent retina (Figs. 35–37) (Hayreh 1965a, 1968; Tso and Hayreh 1977a; Schutta and Hedges 1971). No histopathologic change was seen in the retrolaminar part of the optic nerve; this contradicts the views of Paton and Holmes (1911) and others.
7.4. Horseradish Peroxidase Findings
This study in optic disc edema in raised intracranial pressure showed direct leakage of tracer material from blood vessels in the posterior part of the nerve fiber layer and prelaminar and lamina cribrosa regions. This resulted in presence of plenty of tracer material in the interstitial spaces in this region. This provides an explanation of the leakage of fluorescein in fluorescin angiography seen in optic disc edema, and also that optic disc edema is due to a combination of axonal swelling and to fluid leakage from the blood vessels with accumulation of extracellular fluid.
7.5. Axoplasmic Flow Findings
Our experimental optic disc edema due to raised intracranial pressure induced a stasis of both rapid and slow components of the axoplasmic flow (Tso and Hayreh 1977b). The radioactive isotopes representing the rapid component formed a distinct band in the lamina cribrosa and prelaminar regions (Fig. 41), and those representing the slow component accumulated in the nerve fibers of the entire optic nerve head anterior to the lamina cribrosa (Figs. 42,43). No appreciable extracellular accumulation of the labeled materials was observed (Tso and Hayreh 1977b). These findings indicated that the swelling of the disc in optic disc edema due to raised intracranial pressure is due to intra-axonal accumulation of the axoplasm and not to axonal imbibition of extracellular fluid. That may also be responsible for the nerve fiber striation seen ophthalmoscopically in these eyes (Hayreh 1965a,1968; Hayreh and Hayreh 1977b).
7.6. Electron Microscopy Findings
These showed swelling of the axons in the anterior part of the optic nerve head and adjacent retina, with abundant accumulation of ordinary and giant mitochondria – a sign of axoplasmic flow stasis (Figs. 39,40) (Tso and Hayreh 1977a). In early edema, no increase of extracellular space in the prelaminar region was evident, although in eyes with marked edema, the interstitial space was enlarged (Fig. 40) (Tso and Hayreh 1977a). The glial cells were mostly unremarkable (Tso and Hayreh 1977a). Schutta and Hedges (1971), in similar studies, also found axonal swelling, large numbers of mitochondria in the distended prelaminar axons, and normal glial cells, but they considered axonal swelling an artefact.
7.7. Effect of Optic Atrophy on Optic Disc Edema
As discussed above, atrophic parts of the optic disc did not develop edema in raised intracranial pressure, whether the atrophy was due to optic nerve damage (Hayreh 1965a,1968) or retinal ganglion cell damage (Hayreh and Hayreh 1977a). The reason is simple: there were no nerve fibers to swell, in spite of the persistence of normal optic disc vasculature. This further indicated that the primary change in optic disc edema in raised intracranial pressure is the swelling of the nerve fibers.
7.8. Stereoscopic Color Fundus Photography and Fluorescein Fundus Angiography Findings
These provide useful information for the understanding of the pathogenesis of optic disc edema in raised intracranial pressure. The classical signs of early optic disc edema in raised intracranial pressure described in the literature were drawn from routine direct ophthalmoscopy; these included hyperemia of the disc, distention of the retinal veins, and absence of retinal venous pulsation on the disc. But, as discussed below, these signs were almost never found in early edema due to raised intracranial pressure in my study. Unfortunately, many previous theories on the pathogenesis of optic disc edema were based on the erroneous impressions gained from routine direct ophthalmoscopy. I did the following stereoscopic color fundus photography and fluorescein fundus angiography studies, both in experimental monkeys and in patients.
7.8.1. Stereoscopic Color Fundus Photography Findings
Experimental Study in Rhesus Monkeys
These are discussed in detail above. Briefly, stereoscopic color fundus photography revealed swelling of the optic disc as the first change seen in optic disc edema (Hayreh and Hayreh 1977a,b). The swelling did not involve the various parts of the disc simultaneously and equally.
Clinical Study in Patients
The pattern of optic disc edema found in patients with raised intracranial pressure usually is somewhat different from that seen in the monkeys. This is because the optic disc edema in the monkeys was evaluated serially from its onset and most of the monkeys died within 2–3 months without developing significant vascular changes of the type seen after chronic edema of some duration. In patients the pattern is usually that of a chronic optic disc edema, since patients with raised intracranial pressure usually have had optic disc edema for some time before they are first examined in the clinic. Vascular changes such as marked surface capillary dilation, microaneurysm formation, hemorrhages and venous engorgement take some time to develop. Figures 46–49A are four examples of progressively increasing marked optic disc edema in patients with idiopathic intracranial hypertension, showing marked vascular changes – the more marked the optic disc edema, the more marked are the vascular changes.
Fig. 46. shows moderate degree of optic disc edema, engorged retinal veins and choroidal folds (arrow).
Fig. 49.
Fundus photograph and fluorescein fundus angiograms of left eye, of a 14-year-old boy with benign intracranial hypertension, taken at first visit.
(A) shows severe degree of optic disc edema, some hemorrhages, and markedly engorged retinal veins.
(B-E) Fluorescein fundus angiograms during the early retinal arterial (B), late retinal arterial (C), retinal arteriovenous (D), and late (E) phases. (Fig. 49E reproduced from Hayreh SS. 1977a)
Recently optical coherence tomography studies have also shown optic disc swelling. There is a report that on optical coherence tomography of optic disc edema with raised intracranial pressure, retinal pigment epithelial layer and Bruch's membrane are commonly deflected inward (Kupersmith et al. 2011).
7.8.2. Stereoscopic Fluorescein Fundus Angiography Findings
Vascular changes constitute an important component of optic disc edema in raised intracranial pressure. Fluorescein fundus angiography provides far more useful information, much earlier and better than ophthalmoscopy or stereoscopic color fundus photography. Moreover, it also provides information about the part played by vascular changes in the optic nerve head in the pathogenesis of optic disc edema. To reach a better understanding of the various vascular abnormalities in optic disc edema in raised intracranial pressure, I did the following fluorescein fundus angiographic studies, in experimental monkeys and in patients.
A. Experimental Study
Fluorescein fundus angiographic findings are discussed at length elsewhere (Hayreh and Hayreh 1977b). They showed no detectable abnormalities during the very early stage of edema, and the vascular changes were a comparatively late phenomenon. These included capillary dilation, the formation of microaneurysms, retinal venous dilation and consequent fluorescein leakage (Figs. 27,29). The great advantage of the study in monkeys was that I had the baseline information before the optic disc edema developed; that was helpful to evaluate the evolution of changes as edema developed – obviously not available from patients with optic disc edema due to raised intracranial pressure.
B. Clinical Study in Patients
I also conducted stereoscopic fluorescein fundus angiography in patients with optic disc edema due to raised intracranial pressure (Hayreh 1977a). I critically evaluated changes in the optic disc and the surrounding retina. That showed that the angiographic changes are different in different regions of the optic nerve head.
(i) Surface of the Optic Disc and Adjacent Retina
Capillaries in this region started to fill in the vast majority during the latter part of the retinal arterial phase (Fig. 49C), and completely filled during the peak retinal arteriovenous phase (Figs. 47B, 49D). The amount of capillary dilation and microaneurysm formation depended on the degree of optic disc edema - the more marked the edema, the more marked these changes, being absent in very mild edema. These changes were mostly limited to the surface of the swollen part, with some extension onto the adjacent retinal capillaries (Figs. 47B, 49D), but in some eyes capillary dilation and microaneurysm formation involved the long radial peripapillary capillaries along the superior and inferior temporal retinal vessels as well (Fig. 47B). The dilated capillaries started to leak fluorescein slowly by the retinal arteriovenous or venous peak (Figs. 47B, 49D).
Fig. 47.
(A) shows more marked optic disc edema, markedly engorged retinal veins, and dilated capillaries on the optic disc and microaneurysms. (B) Fluorescein fundus angiogram during the arteriovenous phase shows dilated capillaries on the optic disc and in the region of the radial peripapillary and microaneurysms, and fluorescein leakage.
(ii). Prelaminar Region of the Optic Nerve Head
Since this region is supplied by the peripapillary choroid (Fig. 6; Hayreh 1969,2001a), the prelaminar region normally starts to show fluorescence either before the retinal arteries fill or during the early retinal arterial phase (Figs. 27E, 28B). This is because normally the choroidal vessels usually start to fill before the retinal arterioles. In eyes with marked optic disc edema, however, the circulation in the prelaminar region was appreciably delayed so that during the latter part of the arterial phase, this region was either nonfluorescent (Fig. 49B) or only faintly fluorescent (Fig. 49C), with almost normal fluorescence seen only in eyes with mild edema (Fig. 50B). This absence of fluorescence in the prelaminar part was not due to any masking effect by the overlying surface capillary filling in the swollen surface layer of the disc, because on stereoscopy, the latter was quite clear. During the retinal arteriovenous phase, the masking effect by the filling of the overlying surface capillaries made it hard to assess the prelaminar fluorescence. During the retinal venous phase, the prelaminar region started to show evidence of fluorescein leakage, which gradually built up as the time passed, so that during the late phase it was markedly fluorescent. The prelaminar late fluorescence was localized, and was seen only in the swollen prelaminar tissue.
Fig. 50.
Patient in figure 49 was treated with systemic corticosteroids, which produced marked resolution of optic disc edema in both eyes. Fundus photograph and fluorescein fundus angiograms of left eye are 5½ weeks after initial visit.
(A): Fundus photograph shows minimal optic disc edema, with some temporal pallor and retinal folds (arrow).
(B-E): Fluorescein fundus angiograms during the early retinal arterial (B), late retinal arterial (C), retinal arteriovenous (D), and late (E) phases. (Reproduced from Hayreh SS. 1977a) Compare severity of fundus and fluorescein fundus angiography in this eye with those in figure 49.
(iii). Late Hyperfluorescence of the Optic Disc
This is the classical sign of optic disc edema (Figs. 49E, 50E). The study revealed that it had two components.
(a) Surface fluorescence in the superficial layer of the optic disc and adjacent retina
Surface fluorescence is due to the leak from the dilated capillaries in these areas. It has ill-defined margins, and its extent depends on the severity of edema - the more marked the edema, the brighter and more extensive the fluorescence. In very marked edema, it usually extends up and / or down more than to the sides, usually being least extensive on the temporal side (Fig. 49E).
(b) Deep hyperfluorescence
The size and shape of deep fluorescence depend on the severity of edema. In mild edema, only the peripheral parts of this region may show more than normal fluorescence (Figs. 50B,C). In marked edema the fluorescence is not only intense but also involves an area much larger than that of the normal optic disc and assumes either an oval or a kidney-shaped appearance, with the long axis vertical (Fig. 49E). The temporal border is either straight or somewhat notched, while the superior, nasal and inferior margins are rounded and displaced away from the normal margins of the disc (Fig. 49E). The horseradish peroxidase studies in optic disc edema revealed a marked leakage of the tracer material in the prelaminar and lamina cribrosa regions, as well as its abnormal accumulation among the swollen axons displacing the peripapillary retina; some of this material was also seen in the subretinal space around the optic disc. These abnormalities may explain the pattern of deep hyperfluorescence. Thus, the late hyperfluorescence of the disc in edema is mainly due to the fluorescein leakage from the prelaminar vessels and staining of the deeper tissues of the optic nerve head and the adjacent tissues, with usually a small contribution from the surface vessels, which is evident mostly beyond the deep hyperfluorescence.
(iv). Choroid in the Immediate Vicinity of the Optic Disc
This mostly showed delayed filling (Fig. 49B); it filled in almost all eyes only during the latter part of the retinal arterial phase (Figs. 49C), and in some eyes not until the early retinal arteriovenous phase (Fig. 50D). Stereoscopic evaluation revealed that this is not due to the masking effect by the overlying swollen retina. However, the sloping edges of a markedly swollen disc may exercise some masking effect on the choroidal fluorescence. This delayed circulation in the peripapillary choroid may be a factor in the production of the peripapillary chorioretinal atrophy seen in eyes with chronic edema with optic atrophy (Fig. 51).
Fig. 51.
Right eye of a patient with idiopathic intracranial hypertension shows marked optic disc pallor, with mild optic disc edema, peripapillary retina hemorrhages and peripapillary atrophy.
The delay in the filling of the capillaries in the prelaminar region of the optic nerve head suggested by these studies indicates evidence of circulatory stasis, most probably venous stasis, due to compression of thin-walled and low pressure venous channels in this region by the swollen axons in the restricted prelaminar region. Serial angiographic examination of some of these patients showed that with the disappearance of edema, the capillary filling improved to normal (compare Fig 49B,C with Figs. 50B,C). In marked edema, evidence of retinal venous stasis was seen in the form of slow filling and emptying of the retinal veins.
7.9. Role of Optic Nerve Tissue Pressure in Optic Disc Edema in Intracranial Hypertension
This plays an important role in the flow of the axoplasm in the axons and its stasis; therefore, it requires detailed discussion. I investigated this by injection of fluorescein solution into the CSF in the cisterna magna, after removing an equal volume of the CSF, in normal rhesus monkeys without any raised CSF pressure or optic disc edema. This is discussed detail elsewhere (Hayreh 1977a). Usually within 30 minutes after the injection of the dye into the CSF, the disc developed progressively increasing intensity of fluorescence. (Fig. 52B–D) - much more intense and widespread than can be accounted for by absorption into the blood or even an intravenous injection of fluorescein (Fig. 52A). Histological examination of the optic nerve showed diffusion of fluorescein throughout the tissues of the nerve except into the lumen of the vessels, because the diffusion into the vessels was prevented by the blood-optic nerve barrier (Fig. 53A); the fluorescein also diffused into the optic nerve head (Fig. 5B) and could be seen even in the vitreous and retina adjacent to that. This study suggests that this fluorescence of the optic disc is due to diffusion of fluorescein from the CSF in the sub-arachnoid space of the optic nerve into the optic nerve and the optic disc. My studies support the findings of Rodriguez-Peralta (1966) and Tsukahara and Yamashita (1975).
Fig. 52.
Fluorescence of the optic discs of rhesus monkey. (A) Right optic disc one hour after intravenous injection of 1 ml 25% fluorescein shows optic disc fluorescence, with fluorescent outline of the retinal vessels. (B-D) Right eye is after injection of 1 ml 25% fluorescein solution into cisterna magna, after release of same amount of cerebrospinal fluid. B through D show progressive intense fluorescence of the optic disc ½, 1, and 1½ hours, respectively after the injection. At 3½ hours after injection, both optic discs were intensely fluorescent and no fundus details were visible. (Reproduced from Hayreh SS. 1977a)
Fig. 53.
Fluorescence photomicrographs of frozen longitudinal histologic sections of optic nerve after injection of fluorescein in cisterna magna, as figure 52. (A) Through center of intraorbital part of optic nerve containing central retinal vessels. (B) Through optic nerve head (on left) and retrolaminar optic nerve (on right). (Reproduced from Hayreh SS. 1977a)
These studies indicate a free diffusion of the materials from the CSF in the sheath of the optic nerve into the optic nerve, due to the permeable nature of the pia mater. As a corollary to this, it may be reasonable to assume that the free diffusion of CSF into the optic nerve also influences the tissue pressure in the optic nerve. As the CSF pressure in the subarachnoid space of the sheath of the optic nerve rises, the tissue pressure in the optic nerve would also rise. Hedges and Zaren (1973) in cats reported a rise in optic nerve tissue pressure with acute increase in intracranial pressure. Hedges (1975) called it “hydrostatic-tissue” pressure. Morgan et al. (1995), in their study in dogs, reported that that CSF pressure largely determines retrolaminar tissue pressure.
Studies have been conducted by some workers to investigate the effect of acutely raised CSF pressure on the optic nerve tissue pressure. Two of these studies showed a rise of tissue pressure in the retrolaminar part of the optic nerve with raised intracranial pressure (Ernest and Potts 1968; Hedges and Zaren 1973). However, all the researchers in the field admit that there are unavoidable errors and artefacts in their experimental methods, and that their results are not entirely reliable. Moreover, these studies dealt with an acute rise of CSF pressure to high levels, and the rise of optic nerve tissue pressure with chronic rise of CSF pressure still remains to be established firmly.
Whatever the case may be, the above-mentioned studies strongly suggest that the CSF pressure could influence the optic nerve tissue pressure. This rise of tissue pressure in the optic nerve would interfere with the axoplasmic flow in the optic nerve and result in axoplasmic flow stasis in the optic nerve head. Why the site of axoplasmic flow obstruction is at the lamina cribrosa remains a mystery. One can only speculate as to a possible mechanism. The axoplasm flows from the retinal ganglion cells along their axons (i.e. optic nerve fibers), at first in their intraocular segment (i.e. in the retina and the intraocular part of the optic nerve) and then in the extraocular part of the optic nerve and optic tract, to reach the lateral geniculate body. The various factors that normally influence its flow from the ganglion cell onward are still obscure. One of the factors responsible for the cellulifugal drive of axonal fluid has been considered to be peristaltic surface waves that passively drive the axonal content, and this can be retarded or arrested by mechanical obstruction (Weiss 1972). Another factor may be the intra-axonal pressure that would depend on the surrounding tissue pressure - the intraocular pressure in the eye and optic nerve tissue pressure in the extraocular part of the optic nerve. Normally the intraocular pressure is higher than the tissue pressure in the optic nerve. (The tissue pressure in the nerve may be 8 mm Hg – Ernest and Potts 1968; or 5 to 6 mm Hg. – Hedges and Zaren 1973) This pressure gradient in the axons from their intraocular part to the retrolaminar optic nerve part may be one of the factors in the axoplasmic flow. Pulsation in the intraocular pressure may further help force the axoplasm along the axon. A rise in the optic nerve tissue pressure, as a result of the raised CSF pressure, would presumably exert its influence in the optic nerve up to region of the lamina cribrosa or the immediately adjacent retrolaminar part of the nerve and could disturb the normal balance between the optic nerve tissue pressure and the intraocular pressure required in the axoplasmic flow dynamic. Minckler and Tso (1976a), in their axoplasmic flow studies in normal monkey eyes, found that the drop in grain count of the isotope across the line of myelination immediately behind the lamina cribrosa is larger than would be expected from glial and myelin dilution alone.
The physiological block in slow axoplasm, I believe, may be due to the difference in the pressure gradient in the axon in its intraocular portion (the intraocular pressure) and extraocular portion (optic nerve tissue pressure). The presence of identical optic disc edema and axoplasmic flow stasis in ocular hypotony without raised intracranial pressure (Minckler and Tso 1976b; Minckler et al. 1976) further suggests a disturbance in the normal balance between the intraocular pressure and optic nerve tissue pressure is required in the axoplasmic flow dynamic.
7.10. Role of Intraocular Pressure in Optic Disc Edema in Intracranial Hypertension
This view was put forward enthusiastically by Henderson in 1912 at the meeting of the Ophthalmology Society of the United Kingdom. He described the edema as a manifestation of a disturbed equilibrium between the intracranial and intraocular pressures. A critical review of this paper reveals that it was purely deductive, with no experimental or pathologic support. Parsons (1912), Holmes (1912), and Paton (1912) during discussion at the meeting dismissed the study by Henderson (1912) as of no scientific value. Parker, based on clinical (Parker 1911) and experimental (Parker 1916) studies, concluded that optic disc edema in raised intracranial pressure appeared first in the eye with low intraocular pressure, and the low pressure influenced the course and severity of optic disc edema. A critical evaluation of his clinical study shows that his conclusions were not fully justified, because in some of the eyes in his study, edema was either equal or more marked on the side with higher intraocular pressure. In his experimental study, Parker claimed to have produced 3- to 6-diopter edema within 24 hours and even to the extent of 7 diopters in five minutes, which is simply impossible. The occasional occurrence of optic disc edema, however, in eyes with marked ocular hypotony, is clinically well-known although not universal.
Hedges (1969,1975) tried to revive the “hydrostatic concept” originally postulated by Henderson in 1912. Hedges (1969) offered the following “hydrostatic” theory to explain the pathogenesis of optic disc edema in raised intracranial pressure: “A ‘hydrostatic’ mechanism for the pathogenesis of papilloedema is based on the hydrostatic properties of all the fluids contained within the confines of the skull and dura, including the water of the brain and optic nerve tissue as well as the cerebrospinal fluid and blood. These hydrostatic properties explain the development of an abnormal pressure gradient between the vascular and tissue pressure at the level of the optic nerve head, resulting in vasodilatation, hyperaemia and oedema formation. The degree of oedema in the nervehead which results is determined by the degree of disproportion between the capillary pressure and tissue or intra-ocular pressure at the nervehead and to the interval of time this pressure difference exists.” However, none of the available scientific evidence summarized above lends any support to the “hydrostatic concept” put forward by Hedges, or his conclusion.
Killer et al. (2009) advanced another theory to explain the pathogenesis of optic disc edema in raised intracranial pressure. In 2007 Killer et al. stated that the subarachnoid space of the optic nerve sheath is a cul-de-sac, so that CSF in it “cannot recycle from that region to the general subarachnoid space”. According to them, that results in diminished local clearance or local overproduction of beta-trace protein, a lipocalin-like prostaglandin d-synthase, compared to the spinal CSF. They further added that 3 patients with idiopathic intracranial hypertension and asymmetric optic disc edema demonstrated a lack of contrast-loaded CSF in the subarachnoid space of the optic nerve, despite its being present in the intracranial subarachnoid space, thus suggesting compartmentation of the subarachnoid space of the optic nerve sheath. In my study, discussed above, when fluorescein solution was injected into the cisterna magna in normal rhesus monkeys, after removal of an equal volume of the CSF, the disc usually developed a progressively increasing intensity of fluorescence within 30 minutes after the injection (Fig.52B–D), clearly showing that it travelled fairly quickly in the CSF all the way from the cisterna magna to the optic nerve sheath; this contradicts the claim by Killer et al. (2007).
Based on the claims described above, Killer et al. (2009) hypothesized that increased intracranial pressure alone is not the cause of all cases of optic disc edema; in addition to the direct effects of pressure on the optic nerve, the composition of the CSF around the nerve may contribute to the development of optic disc by producing a “toxic milieu” that damages the astrocytic and neuronal components of the nerve. I find none of the available clinical and pathological evidence supporting this hypothesis: in cases with optic nerve sheath fenestration, the subarachnoid space of the optic nerve sheath is still full of CSF which, according to them, should not “recycle from that region to the general subarachnoid space”, and, consequently, its composition should be almost the same as before fenestration. Therefore, the presumed “toxic milieu” still exists. If the hypothesis of Killer et al. (2009) was valid, under those circumstances, optic nerve sheath fenestration alone should not resolve optic disc edema. Moreover, their claim that a “toxic milieu” damages the astrocytic and neuronal components of the nerve is contradicted by our light and electron microscopic studies, which showed no abnormality in the retrolaminar part of the optic nerve (Hayreh 1965a; Tso and Hayreh 1977a). Most importantly, we have indisputable evidence that it is the lowering of the pressure in the sheath that is the only factor responsible for resolution of optic disc edema in raised intracranial pressure.
8. PATHOGENESIS OF OPTIC DISC EDEMA INDICATED BY MY STUDIES
Based on all the observations discussed above, my studies suggest the following as the most probable sequence of events in the development of optic disc edema in raised intracranial pressure.
8.1. Primary Changes
The course of events in raised CSF pressure leading to optic disc edema is as follows: raised intracranial subarachnoid CSF pressure → rise of CSF pressure in the sheath of the optic nerve → rise of tissue pressure in the optic nerve → axoplasmic flow stasis → swelling of the nerve fibers in the optic nerve head → optic disc swelling. The swelling is the first stereoscopic ophthalmoscopic manifestation of optic disc edema. My study showed that optic disc edema takes one to five days to appear after intracranial pressure rises (Hayreh and Hayreh 1977a). This latent period may be due partly to the time required to build up the optic nerve tissue pressure in response to the raised CSF pressure because of capillary communication in the optic canal between the intracranial and optic nerve sheath subarachnoid spaces, and partly to the slow process of axoplasmic accumulation, and consequent swelling of the axons, in the optic nerve head. From the above discussion, it is evident that the severity of optic disc edema depends upon the number of swollen axons; with the development of optic atrophy, as the number of nerve fibers decreases, the edema correspondingly becomes less marked. Acutely elevated CSF pressure for up to two hours did not produce optic disc edema (Hayreh and Edwards 1971a). Similarly, sudden lowering of the CSF pressure to normal does not produce an immediate resolution of optic disc edema.
8.2. Secondary Changes
The swollen axons and optic disc compress the fine vessels lying among them in the surface nerve fiber layer and prelaminar region of the optic nerve head. Capillaries and venous channels, being thin-walled fine vessels and a low pressure system, are the first and most vulnerable and easily compressed, while the arterial channels, being a high pressure system, remain patent. This results in venous stasis in the surface nerve fiber layer and prelaminar region. The effects of venous stasis can best be appreciated if the vascular patterns of the normal optic nerve head and adjacent retina (Hayreh 2001a) are borne in mind (Fig 6). In the surface nerve fiber layer of the optic disc, the fine vessels are mainly venous in nature. Radial peripapillary capillaries (Fig. 30), which lie among the superficial nerve fibers, along the superior and inferior temporal arcades of retinal vessels and the peripapillary region have distinct charteristics, which include: (i) they are long, straight capillaries, measuring several hundred microns to several millimeters; (ii) they rarely anastomose with one another; and (iii) importantly, they arise from the peripapillary retinal arterioles lying deeper in the retina, and drain into retinal venules or veins on the optic disc (Fig. 6). Because of these characteristics, the radial peripapillary capillaries are more vulnerable to involvement in marked optic disc edema, since their venous end on the optic disc gets compressed without any interference with their arterial end. That accounts for these capillaries developing dilation, microaneurysms and hemorrhages (Figs. 27F, 29B, 47B).
The venous stasis could produce three types of vascular changes.
Compression of the vessels on the surface of the disc by the swollen axons produces dilation, formation of microaneurysms, and hemorrhages on the disc as well as in the distribution of the radial peripapillary capillaries in the neighboring retina. This would explain the well-known fluorescein angiographic vascular changes and their extension in the neighboring retina (Figs. 27F, 29B, 47B, 49C,D) and also, in a number of eyes, up and down along the temporal retinal vessels in the zone of the long radial peripapillary capillary network (Figs. 27F, 29B, 47B).
Swollen axons in the unyielding prelaminar region similarly compress the fine vessels and the veins among them, without compressing the high-pressure arterial vessels, and that causes venous stasis, and slow filling of the prelaminar capillaries (Figs. 27E, 28B).
Since the central retinal vein, a thin-walled vessel, also travels through the optic nerve head, it is also compressed by the surrounding swollen optic disc and produces retinal venous engorgement.
Distention of the capillaries from venous stasis → separation of endothelial cells in the capillaries → break-down of the normal blood-retinal and optic nerve-blood barriers → fluid leakage and accumulation of extracellular fluid; this fluid accumulation was shown on electron microscopy in well-developed optic disc edema (Tso and Hayreh 1977a). Thus, fluorescein leakage in the optic disc and its marked accumulation in the disc (Figs. 26E, 27G, 29C, 49E) in marked optic disc edema represent a vascular phenomenon, and cannot be explained by the postulated axoplasmic fluid leak (Wirtschafter et al. 1975). It seems that while the very early edema is due to swelling of the nerve fibers, the marked edema seen later on represents swollen nerve fibers, extracellular fluid accumulation, and vascular engorgement in the optic nerve head.
My studies in monkeys revealed that optic disc edema in raised intracranial pressure first appeared at the lower pole, then the upper pole, then the nasal part, and finally the temporal part of the disc; the severity of the edema generally followed suit (Hayreh and Hayreh 1977a). This pattern would seem to be due to the relative thickness of the nerve fibers at various parts of the optic disc. Wolff and Davies (1931) found that in the human optic disc, the fibers are thinnest in the region of the macular bundle, lying in the temporal part of the disc; next in thickness are superior and inferior temporal quadrants, then the nasal part of the disc, and finally the thickest fibers are in the superior and inferior nasal quadrants. In rhesus monkeys, even in some normal eyes, some heaping of the axons is seen at the lower pole. This pattern of thickness of the nerve fibers mostly agrees with the pattern of appearance and severity of optic disc edema in my study (Hayreh and Hayreh 1977a).
All the available evidence indicates that slowing of the axoplasmic flow by itself does not interfere with the function of the axon. This is because the nerve impulse is conducted along the membrane of the axon and not by the axoplasm, and also the axoplasmic flow is not completely stopped. Therefore, the persistence of normal visual function in optic disc edema with raised intracranial pressure does not in any way conflict with the thesis presented here.
8.3. Conclusion
Based on the combined information from all the studies discussed above, it is clear that the pathogenesis of optic disc edema in raised intracranial pressure is a mechanical phenomenon. It is primarily due to a rise of CSFP in the optic nerve sheath, which produces axoplasmic flow stasis in the optic nerve fibers in the surface nerve fiber layer and prelaminar region of the optic nerve head. Axoplasmic flow stasis then results in swelling of the nerve fibers, and consequently of the optic disc. Swelling of the nerve fibers and of the optic disc secondarily compresses the fine, low-pressure venules in that region, resulting in venous stasis and fluid leakage; that leads to the accumulation of extracellular fluid. Contrary to the previous theories, the various vascular changes seen in optic disc edema are secondary and not primary. Thus, optic disc edema in raised CSFP is due to a combination of swollen nerve fibers and the accumulation of extracellular fluid.
9. PATHOGENESES OF VISUAL DISTURBANCES IN RAISED INTRACRANIAL PRESSURE
Transient visual obscuration is well-known to develop in patients with raised intracranial pressure; in addition, a variety of other visual disorders, including visual field defects and even blindness can develop in these patients. There is a large amount of literature on the subject. The discussions above about various aspects of optic disc edema in raised intracranial pressure and other pieces of information are relevant to the pathogenesis of visual disturbances in raised intracranial pressure. My clinical studies in 22 patients with idiopathic intracranial hypertension, and experimental studies of optic disc edema due to raised intracranial pressure in 66 rhesus monkeys provided further useful information about understanding their pathogeneses. The subject is discussed at length elsewhere (Hayreh 1977b).
9.1. Clinical Studies
9.1.1. Types of visual disturbances
Following were the visual disorders in this group of patients.
Attacks of Transient Visual Obscuration
Thirteen patients (60%) had a definite history of these attacks, and they were frequently one of the presenting symptoms. They usually involved both eyes, although sometimes only one. In one patient with marked optic disc edema in the left eye and only mild optic disc edema in the right eye, obscuration occurred in the left eye only. The attacks came on suddenly, at irregular intervals, and followed no particular pattern. Most patients were vague about the duration of the obscuration, but it seemed usually to last between 5 and 30 seconds, sometimes more, but apparently rarely more than a minute. A majority of patients stated that the obscuration was brought on by suddenly standing up from a sitting position, and several of them said that this change of posture also brought on dizziness. In some patients, stooping produced the obscuration. One patient reported that emotional upsets brought it on. The frequency of these attacks varied markedly, being as many as about 50 a day in one patient. During the attack, the visual deterioration varied from some blurring to almost complete blindness. A variety of descriptions were used for the obscuration -"fuzz-out of vision," "black out,” like "fog" or "mist” or "smoke" or "being shut in a dark room," "vision blacked out like venetian blinds." One patient complained that her vision was obscured by scotomas during the attacks. There seemed to be no appreciable difference in the CSF pressure level between those with and those without obscuration. Stereoscopic fundus examination showed that in about two thirds of the cases, optic disc edema was of a marked degree, and in the rest moderate. A review of the literature shows that Jackson described this visual obscuration in 1871 as “epileptiform amaurosis”. Uhthoff in 1914 found that 75% of these eyes go blind within 3 months. Meadows (1959) warned that these attacks should usually be considered a warning of impending blindness.
Other Visual Disturbances
All the eyes had enlarged blind spots; the degree of enlargement usually depended on the severity of optic disc edema - the more marked the edema, the greater the enlargement. In some of the eyes with marked optic disc edema, the enlarged blind spot was so big that it produced a bitemporal visual field defect in 1–2e isopter of the field with the Goldmann perimeter, but the peripheral fields with larger targets were normal; these patients complained of visual blurring with normal visual acuity because that large blind spot kept bothering them. Enlargement of the blind spot was first described in 1870 by Knapp. Three patients developed visual field defects other than the enlarged blind spot during the follow-up period. In one patient with bilateral pale discs (left paler than right) and mild optic disc edema, the left eye had only a small island of field left in the inferior temporal region, while the right eye showed concentric contraction of the peripheral fields. In another patient with bilateral pale discs and mild optic disc edema, in addition to bilateral concentric contraction of the peripheral visual fields, there were optic-disc-related field defects in the upper half of the fields of vision in both eyes. The third patient showed an inferonasal, disc-related visual field defect in the left eye only, with a moderate degree of optic disc edema in both eyes, more marked in the left than the right. This confirms that, as would be expected, the more marked the optic disc edema, the greater are the chances of visual disturbances. Arcuate field defect, central scotoma, paracentral scotomas and nasal step have been reported in the literature.
9.1.2. Fundus findings
Optic Disc Edema
At the first visit or during the period of follow-up, it was marked (Figs. 46–Fig. 49A) in about half of the patients and moderately marked in the remainder, although in two patients it was mild - one of them was developing optic atrophy. From the previous discussion about the pathogenesis of optic disc edema in raised intracranial pressure, it is evident that the severity of optic disc edema depends upon the number of swollen axons; with the development of optic atrophy, as the number of nerve fibers decreases, the edema correspondingly becomes less marked. Since the severity of optic disc edema was assessed only from the stereoscopic color fundus photographs taken on some of the visits to the hospital, it is possible that a marked degree of optic disc edema may have occurred more frequently than was documented by the pictures.
Optic Atrophy
A variable degree of pallor of the optic disc developed in four patients of this series during the follow-up period. The eye with the more marked optic disc edema was either the only eye to develop optic atrophy or showed more marked atrophy. As discussed above, once pallor of the disc started to develop, the edema decreased. Fluorescein fundus angiography of the atrophic disc showed reduced vascularity. One eye with marked optic atrophy had a temporal island of the visual field only. In the patient with the most marked optic atrophy of this series (Fig. 51), pigment epithelial atrophy was seen around the optic disc, more marked in the eye with more marked optic atrophy.
The Rest of the Fundus
In my series, the fundi showed no ophthalmoscopic or angiographic abnormalities other than those associated with optic disc edema or optic atrophy; one eye showed choroidal folds (Fig. 46), and two retinal folds between the optic disc and the macular region (Fig. 50A). In the literature, macular edema has also been reported in some of these patients. In another patient not part of this series, I saw cilioretinal artery occlusion associated with marked edema, with a corresponding centrocecal visual field defect (Fig. 54).
Fig. 54.
Right eye of a patient with idiopathic intracranial hypertension, shows (A) severe optic disc edema and cilioretinal artery occlusion. (B) There is a centrocecal scotoma corresponding to the distribution of the occluded cilioretinal artery.
9.1.3. Progress
In all the patients, once the CSF pressure was brought down to the normal level and maintained there, optic disc edema and the visual symptoms resolved.
9.1.4. Pathogenesis of Visual Disorders in Clinical Studies
Many theories have been postulated to explain that, and are discussed elsewhere (Hayreh 1977b). For a logical understanding of this, the most important issues are: (i) the blood supply of the optic nerve head, and (ii) the factors that influence blood flow it. I have discussed both these topics at length elsewhere (Hayreh 2001a,b). Very briefly, the optic nerve head is supplied by the posterior ciliary artery circulation, and watershed zones between the various posterior ciliary arteries usually lie at one or the other part of the optic nerve head; it is well-established that watershed zones play an important role in ischemic disorders in the event of fall of perfusion pressure in the vascular bed. The blood flow in the optic nerve head is determined by the following formula:
Resistance to flow Perfusion pressure = Mean arterial blood pressure minus the intraocular pressure, or arterial pressure minus venous pressure.
Marked and moderate optic disc edema with raised intracranial pressure make the optic disc highly vulnerable to ischemia, because of compression of the vessels in it. Wall et al. (1998) also showed this in their study of 478 patients with idiopathic intracranial hypertension. This is for the following reasons. In these eyes, there is increased vascular resistance because of (i) compression of the capillaries by swollen axons and extracellular fluid accumulation in edema, and (ii) venous stasis. That makes the optic disc vulnerable to ischemia in any situation that causes a fall of perfusion pressure, which can be due to: (a) a fall of blood pressure, and/or (b) rise of intraocular pressure. Fall of blood pressure can result from orthostatic arterial hypotension or nocturnal arterial hypotension. Intraocular pressure can rise on bending down or Valsalva maneuvers. Patients often complain of transient visual obscuration when they suddenly stand up or stoop. It is well-established that nocturnal arterial hypotension plays an important role in the development of anterior ischemic optic neuropathy (Hayreh et al. 1997); the various visual field defects and optic disc atrophy seen in patients with marked optic disc edema are a manifestation of anterior ischemic optic neuropathy. The development of optic atrophy in these eyes is also due to anterior ischemic optic neuropathy
9.2. Experimental Studies
Among these monkeys, 12 animals with the inflated balloons in the supratentorial region had definite visual disturbances. Since all the animals were not watched closely all the time (being in an animal house and not in the laboratory), there is a good chance that disturbances in some other animals might have gone unnoticed, so the occurrence of the visual disturbances may be underestimated. The following types of visual field defects were recorded in these 12 animals.
9.2.1. Types of visual disturbances
(a). Intermittent Complete Blindness
Nine animals developed definite episodes of this. These lasted from a few minutes to a few hours, and were sudden in onset and disappearance. In 5 of them, the attacks of intermittent blindness continued until death. In one animal, temporary blindness occurred only once. In the remaining 3, it progressed to complete blindness 1, 13 and 21 days respectively after the onset of intermittent blindness; in one of these animals, with the balloon in the occipital region, a definite left hemianopia was discovered five days after the introduction of the balloon, and the field defect persisted until the animal developed intermittent blindness and later on permanent blindness
(b). Suddenly Permanent Blindness
Three animals suddenly developed permanent blindness without any previous signs of temporary blindness; however, it is possible that temporary blindness might have occurred and gone unnoticed. In one animal, complete blindness developed suddenly after rapid inflation of the balloon.
Unlike the study in the patients above, there was no correlation at all between the visual disorders and the fundus changes in these animals. The two seemed to be independent manifestations of the intracranial space-occupying lesion. The monkeys that suffered visual disturbances had their balloons inflated considerably faster (0.318 to 0.621 ml per day) than those that did not (0.172 to 0.342 ml per day). The only exceptions were the animals with the balloon in the occipital region, where an inflation rate of 0.198 to 0.258 ml per day produced visual disturbances as well as early death from respiratory failure, because of the hindbrain herniation into the foramen magnum by the direct downward pressure by the distended balloon.
Autopsy in these animals showed herniation of the parahippocampal gyrus down through the tentorial notch (Fig. 55), when the balloon was in the supratentorial region. That also displaced adjacent midbrain and compressed the neighboring optic tracts and lateral geniculate bodies. There seemed to be a much higher incidence of midbrain distortion and displacement in animals with visual disturbances than in those without them. Histopathological study of the lateral geniculate body in one animal with visual loss showed a wedge-shaped degeneration in the sixth layer, and the oblique fibers of the optic radiation on both sides were much less numerous than normal. Histological examination of the occipital cortex, optic nerve and retina showed no abnormalities.
Fig. 55.
Inferior surface of cerebral hemispheres and midbrain of a rhesus monkey with left temporal lobe balloon in situ (white arrow), shows herniated part of left parahippocampal gyrus surrounded temporally by compression mark (black arrow) produced by free edge of tentorium cerebelli, and compressed, displaced, and distorted midbrain. (Reproduced from Hayreh SS. 1977b)
9.2.1. Pathogenesis of Visual Disorders in Experimental Studies
These findings suggest that intermittent and complete blindness in these animals was not related to the optic disc edema but most probably due to herniation of the parahippocampal gyrus down through the tentorial notch, which displaced adjacent midbrain and compressed the neighboring optic tracts and lateral geniculate bodies. Therefore, episodes of intermittent complete blindness were most probably due to transient episodes of herniation. This has also been mentioned as occurring in humans but would be much less common, because the intracranial space occupying lesions in humans grow at a much slower rate than those in my experimental balloon study.
10. CONCLUSIONS AND FUTURE DIRECTIONS
My studies showed that the pathogenesis of optic disc edema in raised intracranial pressure is a mechanical phenomenon, due to axoplasmic flow stasis in the optic nerve fibers in the surface nerve fiber layer and prelaminar region of the optic nerve head. Axoplasmic flow stasis then results in swelling of the nerve fibers, and consequently of the optic disc. The various vascular changes seen in optic disc edema are secondary to optic disc edema, and that results in venous stasis and fluid leakage; that leads to the accumulation of extracellular fluid. Thus, optic disc edema in raised CSFP is due to a combination of swollen nerve fibers and the accumulation of extracellular fluid.
There are now more sophisticated technologies, such as optical coherence tomography, adaptive optics scanning laser ophthalmoscopy and other technologies to evaluate and to acquire quantitative data about optic disc edema, and there will be, no doubt, other future technologies to measure cerebrospinal fluid pressure intracranially and in the optic nerve sheath individually as well as simultaneously, more frequently or continuously. It may then be possible to have more critical information about the pathogenesis of optic disc edema in raised intracranial pressure clinically in patients, which was not possible in my experimental studies.
Fig. 48.
shows severe degree of optic disc edema, some hemorrhages, markedly engorged retinal veins and choroidal folds in temporal peripapillary region.
Acknowledgments
Supported partly by grants EY-1151 and 1576 from the National Institutes of Health.
Footnotes
This is a PDF file of an unedited manuscript that has been accepted for publication. As a service to our customers we are providing this early version of the manuscript. The manuscript will undergo copyediting, typesetting, and review of the resulting proof before it is published in its final citable form. Please note that during the production process errors may be discovered which could affect the content, and all legal disclaimers that apply to the journal pertain.
The author has no conflict of interest.
REFERENCES
- Allbutt TC. On the Use of the Ophthalmoscope in Diseases of the Nervous System and of the Kidneys. London: Macmillan; 1871. p. 35. 54–64, 112–178. [Google Scholar]
- Allbutt TC. On the causation and significance of the choked disc in intracranial diseases. Br. Med. J. 1872;1:443–445. doi: 10.1136/bmj.1.591.443. [DOI] [PMC free article] [PubMed] [Google Scholar]
- Alsuhaibani AHI, Carter KD, Nerad JA, Lee AG. Effect of optic nerve sheath fenestration on papilledema of the operated and the contralateral nonoperated eyes in idiopathic intracranial hypertension. Ophthalmology. 2011;118:412–414. doi: 10.1016/j.ophtha.2010.06.025. [DOI] [PubMed] [Google Scholar]
- Bettman JW, Daroff RB, Sanders MD, Hoyt WF. Papilledema and asymptomatic intracranial hypertension in systemic lupus erythematosus. Arch Ophthalmol. 1968;80:189–193. doi: 10.1001/archopht.1968.00980050191007. [DOI] [PubMed] [Google Scholar]
- Briggs G. Ophthalmographia, sive Oculi ejusque partium descriptio Anatomica. Foan, Hayes, Celeberrimae, Cantab. 1676:1628. [Google Scholar]
- Carter RB. On retrobulbar incision of the optic nerve in cases of swollen disc. Brain. 1888;10:199–209. [Google Scholar]
- Coccius . Über die Anwendung des Augenspiegels. Leipzig: 1853. p. 124. [Google Scholar]
- Cushing H, Bordley J. Observations on experimentally induced choked disc. Bull. Hopkins Hosp. 1909;20:95–101. [Google Scholar]
- de Wecker L. Report 4th Int. Ophthalmol. Congress. London: 1872. On incision of the optic nerve in cases of neuroretinitis; pp. 11–14. [Google Scholar]
- Deyl J. Choked Disk and its sequelae. In: Norris WF, Oliver CA, editors. System of Diseases of the Eye. Vol. 3. London: Lippincot; 1898. pp. 592–610. [Google Scholar]
- Elschnig A. Ueber die sogenannte Stauungspapille. Wien. Klin. Wsch. 1894;7:957–960. [Google Scholar]
- Elschnig A. Ueber die pathologische Anatomie und Pathogenese der sogenannten Stauungs-papille. Arch. f Ophthal. 1895;41(2):179–293. [Google Scholar]
- Ernest JT, Potts AM. Pathophysiology of the distal portion of the optic nerve: I. Tissue pressure relationships. Am. J. Ophthalmol. 1968;66:373–380. doi: 10.1016/0002-9394(68)91520-1. [DOI] [PubMed] [Google Scholar]
- Glew WB. The pathogenesis of papilledema in intracranial disease: a review of the literature. Am J Med Sci. 1960;239:221–230. doi: 10.1097/00000441-196002000-00017. [DOI] [PubMed] [Google Scholar]
- Glowacki J. Acute papilloedema. Bull. Polish Med. Hist. Sci. 1962;5:15–16. [PubMed] [Google Scholar]
- Gowers WR. Manual and Atlas of Medical Ophthalmoscopy. London: Churchill; 1879. pp. 40–83. [Google Scholar]
- Hayreh SS. The ophthalmic artery III. Branches. Br J Ophthalmol. 1962;46:212–247. doi: 10.1136/bjo.46.4.212. [DOI] [PMC free article] [PubMed] [Google Scholar]
- Hayreh SS. The central artery of the retina- its role in the blood supply of the optic nerve. Br J Ophthalmol. 1963a;47:651–663. doi: 10.1136/bjo.47.11.651. [DOI] [PMC free article] [PubMed] [Google Scholar]
- Hayreh SS. Blood supply and vascular disorders of the optic nerve. Anal Instit Barraquer. 1963b;4:7–109. [Google Scholar]
- Hayreh SS. Arteries of the orbit in the human being. Br J Surg. 1963c;50:938–953. doi: 10.1002/bjs.18005022708. [DOI] [PubMed] [Google Scholar]
- Hayreh SS. The orbital vessels of rhesus monkeys. Exp. Eye Res. 1964a;3:16–30. [PubMed] [Google Scholar]
- Hayreh SS. Pathogenesis of oedema of the optic disc (papilloedema) - A preliminary report. Br. J. Ophthalmol. 1964b;48:522–543. doi: 10.1136/bjo.48.10.522. [DOI] [PMC free article] [PubMed] [Google Scholar]
- Hayreh SS. Pathogenesis of oedema of the optic disc (papilloedema). (Thesis for PhD) London, England: London University; 1965a. pp. 1–580. [Google Scholar]
- Hayreh SS. Occlusion of the central retinal vessels. B.r J. Ophthalmol. 1965b;49:626–645. doi: 10.1136/bjo.49.12.626. [DOI] [PMC free article] [PubMed] [Google Scholar]
- Hayreh SS. Posterior drainage of the intraocular fluid from the vitreous. Exp. Eye Res. 1966;5:123–144. [Google Scholar]
- Hayreh SS. Pathogenesis of oedema of the optic disc. Doc. Ophthalmol. 1968;24:289–411. doi: 10.1007/BF02550944. [DOI] [PubMed] [Google Scholar]
- Hayreh SS. Blood supply of the optic nerve head and its role in optic atrophy, glaucoma and oedema of the optic disc. Br. J. Ophthalmol. 1969;53:721–748. doi: 10.1136/bjo.53.11.721. [DOI] [PMC free article] [PubMed] [Google Scholar]
- Hayreh SS. Optic disc edema in raised intracranial pressure V. Pathogenesis. Arch. Ophthalmol. 1977a;95:1553–1565. doi: 10.1001/archopht.1977.04450090075006. [DOI] [PubMed] [Google Scholar]
- Hayreh SS. Optic disc edema in raised intracranial pressure VI. Associated visual disturbances and their pathogenesis. Arch. Ophthalmol. 1977b;95:1566–1579. doi: 10.1001/archopht.1977.04450090088007. [DOI] [PubMed] [Google Scholar]
- Hayreh SS. Fluids in the anterior part of the optic nerve in health and disease. Surv. Ophthalmol. 1978;23:1–25. doi: 10.1016/0039-6257(78)90194-7. [DOI] [PubMed] [Google Scholar]
- Hayreh SS. The sheath of the optic nerve. Ophthalmologica. 1984;189:54–63. doi: 10.1159/000309386. [DOI] [PubMed] [Google Scholar]
- Hayreh SS. The blood supply of the optic nerve head and the evaluation of it - Myth and reality. Prog. Retin. Eye Res. 2001a;20:563–593. doi: 10.1016/s1350-9462(01)00004-0. [DOI] [PubMed] [Google Scholar]
- Hayreh SS. Blood flow in the optic nerve head and factors that may influence it. Prog. Retin. Eye Res. 2001b;20:595–624. doi: 10.1016/s1350-9462(01)00005-2. [DOI] [PubMed] [Google Scholar]
- Hayreh SS, Dass R. The ophthalmic artery I. Origin and intra-cranial and intra-canalicular course. Br J Ophthalmol. 1962a;46:65–98. doi: 10.1136/bjo.46.2.65. [DOI] [PMC free article] [PubMed] [Google Scholar]
- Hayreh SS, Dass R. The ophthalmic artery II. Intra-orbital course. Br J Ophthalmol. 1962b;46:165–185. doi: 10.1136/bjo.46.3.165. [DOI] [PMC free article] [PubMed] [Google Scholar]
- Hayreh SS, Edwards J. Ophthalmic arterial and venous pressures. Effects of acute intracranial hypertension. Br. J. Ophthalmol. 1971a;55:649–663. doi: 10.1136/bjo.55.10.649. [DOI] [PMC free article] [PubMed] [Google Scholar]
- Hayreh SS, Edwards J. Vascular responses to acute intracranial hypertension. J. Neurol. Neurosurg. Psychiatry. 1971b;34:587–601. doi: 10.1136/jnnp.34.5.587. [DOI] [PMC free article] [PubMed] [Google Scholar]
- Hayreh MS, Hayreh SS. Optic disc edema in raised intracranial pressure I. Evolution and resolution. Arch. Ophthalmol. 1977a;95:1237–1244. doi: 10.1001/archopht.1977.04450070135013. [DOI] [PubMed] [Google Scholar]
- Hayreh SS, Hayreh MS. Optic disc edema in raised intracranial pressure II. Early detection with fluorescein fundus angiography and stereoscopic color photography. Arch. Ophthalmol. 1977b;95:1245–1254. doi: 10.1001/archopht.1977.04450070143014. [DOI] [PubMed] [Google Scholar]
- Hayreh SS, Podhajsky PA, Zimmerman B. Non-arteritic anterior ischemic optic neuropathy - Time of onset of visual loss. Am J Ophthalmol. 1997;124:641–647. doi: 10.1016/s0002-9394(14)70902-x. [DOI] [PubMed] [Google Scholar]
- Hayreh SS, Vrabec Fr. The structure of the head of the optic nerve in rhesus monkey. Am. J. Ophthalmol. 1966;61:136–150. doi: 10.1016/0002-9394(66)90758-6. [DOI] [PubMed] [Google Scholar]
- Hedges TR. Intracranial pressure and papilledema. Trans. Ophthalmol. Soc. U. K. 1969;89:691–773. [PubMed] [Google Scholar]
- Hedges TR. Papilledema: its recognition and relation to increased intracranial pressure. Surv. Ophthalmol. 1975;19:201–223. [PubMed] [Google Scholar]
- Hedges TR, Weinstein JD, Crystle CD. Orbital vascular response to acutely increased intracranial pressure in the rhesus monkey. Arch. Ophthalmol. 1964;71:226–237. doi: 10.1001/archopht.1964.00970010242018. [DOI] [PubMed] [Google Scholar]
- Hedges TR, Zaren HA. The relationship of optic nerve tissue pressure to intracranial and systemic arterial pressure. Am. J. Ophthalmol. 1973;75:90–98. doi: 10.1016/0002-9394(73)90657-0. [DOI] [PubMed] [Google Scholar]
- Henderson T. The pathogenesis of choked disc. Trans. Ophthalmol. Soc. U. K. 1912;32:82–97. [Google Scholar]
- Henkind P. Radial peripapillary capillaries of the retina. I. Anatomy: human and comparative. Br J Ophthalmol. 1967;51:115–123. doi: 10.1136/bjo.51.2.115. [DOI] [PMC free article] [PubMed] [Google Scholar]
- Holmes G. In discussion on “The pathogenesis of choked disc”. Trans. Ophthalmol. Soc. U. K. 1912;32:95–96. [Google Scholar]
- Huber A. Eye Symptoms in Brain Tumor. CV Mosby Co, St Louis: 1961. pp. 108–109. [Google Scholar]
- Igersheimer J. Beitrage zur Pathologie und Pathogenese der Stauungspapille. Folia Ophthalmol. Orient. 1935;2:1–10. [Google Scholar]
- Jackson JH. On the routine use of the ophthalmoscope in cases of cerebral disease. Med. Times Gaz. 1871;1:627–629. [Google Scholar]
- Jackson JH. Discussion on the relation between optic neuritis and intracranial disease. Trans. Ophthalmol. Soc. U. K. 1881;1:60–94. [Google Scholar]
- Killer HEI, Jaggi GP, Flammer J, Miller NR, Huber AR, Mironov A. Cerebrospinal fluid dynamics between the intracranial and the subarachnoid space of the optic nerve. Is it always bidirectional? Brain. 2007;130:514–520. doi: 10.1093/brain/awl324. [DOI] [PubMed] [Google Scholar]
- Killer HEI, Jaggi GP, Miller NR. Papilledema revisited: is its pathophysiology really understood? Clin. Exp. Ophthalmol. 2009;37:444–447. doi: 10.1111/j.1442-9071.2009.02059.x. [DOI] [PubMed] [Google Scholar]
- Knapp H. The channel by which, in cases of neuroretinitis, the exudation proceeds from the brain into the eye. Trans. Am. Ophthalmol. Soc. 1870;1:118–120. [PMC free article] [PubMed] [Google Scholar]
- Kuhnt L’oedema papillaire. Ann. Ocul. 1879;82:180. [Google Scholar]
- Kupersmith MJI, Sibony P, Mandel G, Durbin M, Kardon RH. Optical coherence tomography of the swollen optic nerve head: deformation of the peripapillary retinal pigment epithelium layer in papilledema. Invest. Ophthalmol. Vis. Sci. 2011;52:6558–6564. doi: 10.1167/iovs.10-6782. [DOI] [PMC free article] [PubMed] [Google Scholar]
- Langley JN. British Association; 1899. [Google Scholar]
- Lorentzen SE. Incidence of spontaneous venous pulsations in the retina. Acta Ophthalmol. 1970;48:765–770. [PubMed] [Google Scholar]
- Lynn BH. Retrobulbar neuritis: A survey of the present condition of cases occurring over the last 56 years. Trans. Ophthalmol. Soc. U. K. 1959;79:701–716. [PubMed] [Google Scholar]
- Meadows SP. The swollen optic disc. Trans. Ophthalmol. Soc. U. K. 1959;79:121–143. [PubMed] [Google Scholar]
- Minckler DS, Tso MOM. A light microscopic, autoradiographic study of axoplasmic transport in the normal rhesus optic nerve head. Am. J. Ophthalmol. 1976a;82:1–15. doi: 10.1016/0002-9394(76)90657-7. [DOI] [PubMed] [Google Scholar]
- Minckler DS, Tso MOM. Experimental papilledema produced by cyclocryotherapy. Am. J. Ophthalmol. 1976b;82:577–589. doi: 10.1016/0002-9394(76)90545-6. [DOI] [PubMed] [Google Scholar]
- Minckler DM, Tso MOM, Zimmerman LE. A light microscopic, autoradiographic study of axoplasmic transport in the optic nerve head during ocular hypotony, increased intraocular pressure, and papilledema. Am. J. Ophthalmol. 1976;827:741–757. doi: 10.1016/0002-9394(76)90012-x. [DOI] [PubMed] [Google Scholar]
- Morgan WH, Yu D-Y, Cooper RL, Alder VA, Cringle SJ, Constable IJ. The influence of cerebrospinal fluid pressure on the lamina cribrosa tissue pressure gradient. Invest. Ophthalmol. Vis. Sci. 1995;36:1163–1172. [PubMed] [Google Scholar]
- Parinaud H. De la Névrite Optique dans les Affections Cérébrales. Ann. Ocul. 1879;82:5–47. [Google Scholar]
- Parker WR. The relation of choked disc to intraocular tension: a clinical study of six cases. Trans. Am. Ophthalmol. Soc. 1911;12:940–943. [PMC free article] [PubMed] [Google Scholar]
- Parker WR. The relation of choked disc to the tension of the eyeball. JAMA. 1916;67:1053–1058. [Google Scholar]
- Parsons JH. The Pathology of the Eye. IV. London: Hodder & Stoughton; 1908. pp. 1349–1365. [Google Scholar]
- Parsons JH. In discussion “The pathogenesis of choked disc”. Trans. Ophthalmol. Soc. U. K. 1912;32:92–93. [Google Scholar]
- Paton L. In discussion “The pathogenesis of choked disc”. Trans. Ophthalmol. Soc. U. K. 1912;32:93–95. [Google Scholar]
- Paton L, Holmes G. The pathology of papilloedema. Brain. 1911;33:389–432. [Google Scholar]
- Power H. A case of optic neuritis in which Wecker's operation was performed. St Bart ‘s Hosp. Rep. 1872;12:171–172. [Google Scholar]
- Ramsey JF. Retinal venous pulsations and intracranial hypertension, seminar. Iowa City: University of Iowa; 1976. [Google Scholar]
- Rodriguez-Peralta LA. Hematic and fluid barriers in the optic nerve. J. Comp. Neurol. 1966;126:109–121. doi: 10.1002/cne.901260109. [DOI] [PubMed] [Google Scholar]
- Sanders MD. Eye. Vol. 11. Lond: 1997. The Bowman Lecture. Papilloedema: 'the pendulum of progress'; pp. 267–294. [DOI] [PubMed] [Google Scholar]
- Sallomi DI, Taylor H, Hibbert J, Sanders MD, Spalton DJ, Tonge K. The MRI appearance of the optic nerve sheath following fenestration for benign intracranial hypertension. Eur. Radiol. 1998;8:1193–1196. doi: 10.1007/s003300050533. [DOI] [PubMed] [Google Scholar]
- Schutta HS, Hedges TR. Fine structure observations on experimental papilledema in the rhesus monkey. J. Neurol. Sci. 1971;12:1–14. doi: 10.1016/0022-510x(71)90248-6. [DOI] [PubMed] [Google Scholar]
- Singh (Hayreh) S, Dass R. The central artery of the retina I. Origin and course. Br. J. Ophthalmol. 1960a;44:193–212. doi: 10.1136/bjo.44.4.193. [DOI] [PMC free article] [PubMed] [Google Scholar]
- Singh (Hayreh) S, Dass R. The central artery of the retina II. Distribution and anastomoses. Br J Ophthalmol. 1960b;44:280–299. doi: 10.1136/bjo.44.5.280. [DOI] [PMC free article] [PubMed] [Google Scholar]
- Tenon . Mémoire et observations sur l'anatomie, la pathologie et la chirurgie. Paris: 1806. [Google Scholar]
- Traquair HM. In discussion on “Optic Neuritis”. Br. Med. J. 1927;2:872. [Google Scholar]
- Tsai JCI, Petrovich MS, Sadun AA. Histopathological and ultrastructural examination of optic nerve sheath decompression. Br. J. Ophthalmol. 1995;79:182–185. doi: 10.1136/bjo.79.2.182. [DOI] [PMC free article] [PubMed] [Google Scholar]
- Tso MOM, Fine BS. Electron microscopic study of papilledema in man. Am. J. Ophthalmol. 1976;82:424–434. doi: 10.1016/0002-9394(76)90490-6. [DOI] [PubMed] [Google Scholar]
- Tso MOM, Hayreh SS. Optic disc edema in raised intracranial pressure III. A pathologic study of experimental papilledema. Arch. Ophthalmol. 1977a;95:1448–57. doi: 10.1001/archopht.1977.04450080158022. [DOI] [PubMed] [Google Scholar]
- Tso MOM, Hayreh SS. Optic disc edema in raised intracranial pressure IV. Axoplasmic transport in experimental papilledema. Arch. Ophthalmol. 1977b;95:1458–1462. doi: 10.1001/archopht.1977.04450080168023. [DOI] [PubMed] [Google Scholar]
- Tso MOM, Shih CY, McLean IW. Is there a blood-brain barrier in the optic nerve head? Arch. Ophthalmol. 1975;93:815–825. doi: 10.1001/archopht.1975.01010020703008. [DOI] [PubMed] [Google Scholar]
- Tsukahara I, Yamashita H. An electron microscopic study on the blood-optic nerve and fluid-optic nerve barrier. Albrecht von Graefe’s Arch. Klin. Exp. Ophthalmol. 1975;196:239–246. doi: 10.1007/BF00410035. [DOI] [PubMed] [Google Scholar]
- Türck Ein Fall von Hämorrhagie der Netzhaut beider Augen. Zeit. Ges. Wien. Ärzte. 1853;9(1):214–218. [Google Scholar]
- Uhthoff W. Zur Frage der Stauungspapille. Neurol. Centralbl. 1904;23:930–934. [Google Scholar]
- Uhthoff W. Ophthalmic experiences and considerations on the surgery of cerebral tumours and tower skull. Trans. Ophthalmol. Soc. U. K. 1914;34:47–123. [Google Scholar]
- Ulrich R. Studien über die Pathogenese des Glaucoms. Arch. f Ophthalmol. 1884;30(4):235–288. [Google Scholar]
- von Graefe A. Sur certaines altérations de la rétine et du nerf optique, en rapport avec des affections cérébrales. Gaz. Hebdom. 1860;7:707–708. [Google Scholar]
- von Graefe A. Tumor orbitae et cerebri. Arch f Ophthal. 1866;12(2):100–114. [Google Scholar]
- Wall M, White WN., 2nd Asymmetric papilledema in idiopathic intracranial hypertension: prospective interocular comparison of sensory visual function. Invest. Ophthalmol. Vis. Sci. 1998;39(1):134–142. [PubMed] [Google Scholar]
- Walsh FB, Hedges TR. Optic nerve sheath hemorrhage. Trans. Am. Acad. Ophthalmol. Otolaryngol. 1950;55:29–48. [PubMed] [Google Scholar]
- Walsh FB, Hoyt WF. Clinical Neuro-ophthalmology. ed 3. Baltimore: Williams & Wilkins Co; 1969. pp. 577–583. [Google Scholar]
- Weiss PA. Neuronal dynamics and axonal flow: axonal peristalsis. Proc. Natl. Acad. Sci. 1972;69:1309–1312. doi: 10.1073/pnas.69.5.1309. [DOI] [PMC free article] [PubMed] [Google Scholar]
- Williamson-Noble FA. Venous pulsation. Trans. Ophthalmol. Soc. U. K. 1952;72:317–326. [Google Scholar]
- Wirtschafter JD, Rizzo FJ, Smiley BC. Optic nerve axoplasm and papilledema. Surv. Ophthalmol. 1975;20:157–189. doi: 10.1016/0039-6257(75)90001-6. [DOI] [PubMed] [Google Scholar]
- Wolff E, Davies F. A contribution to the pathology of papilloedema. Br. J. Ophthalmol. 1931;15:609–632. doi: 10.1136/bjo.15.11.609. [DOI] [PMC free article] [PubMed] [Google Scholar]


