Abstract
TMEM16A is a newly identified Ca2+-activated Cl− channel in biliary epithelial cells (BECs) that is important in biliary secretion. While extracellular ATP stimulates TMEM16A via binding P2 receptors and increasing intracellular Ca2+ concentration ([Ca2+]i), the regulatory pathways have not been elucidated. Protein kinase C (PKC) contributes to ATP-mediated secretion in BECs, although its potential role in TMEM16A regulation is unknown. To determine whether PKCα regulates the TMEM16A-dependent membrane Cl− transport in BECs, studies were performed in human biliary Mz-cha-1 cells. Addition of extracellular ATP induced a rapid translocation of PKCα from the cytosol to the plasma membrane and activation of whole cell Ca2+-activated Cl− currents. Currents demonstrated outward rectification and reversal at 0 mV (properties consistent with TMEM16A) and were inhibited by either molecular (siRNA) or pharmacologic (PMA or Gö6976) inhibition of PKCα. Intracellular dialysis with recombinant PKCα activated Cl− currents with biophysical properties identical to TMEM16A in control cells but not in cells after transfection with TMEM16A siRNA. In conclusion, our studies demonstrate that PKCα is coupled to ATP-stimulated TMEM16A activation in BECs. Targeting this ATP-Ca2+-PKCα signaling pathway may represent a therapeutic strategy to increase biliary secretion and promote bile formation.
Keywords: TMEM16A, PKCα, ATP, Cl− channel, cholangiocytes
intrahepatic biliary epithelial cells (BECs), also known as cholangiocytes, contribute to bile formation through the secretion of electrolytes and water. Cl− channels on the apical, or luminal, membrane of BECs provide the driving force for secretion (17). We have recently identified TMEM16A (also known as Ano1 or Anoctamin 1) as a Ca2+-activated Cl− channel in the apical membrane of BECs (6, 9). TMEM16A is activated by increases in intracellular Ca2+ concentration ([Ca2+]i) through a process involving extracellular ATP binding membrane P2 receptors (9). Importantly, in BECs the magnitude of ATP-stimulated Cl− currents mediated by TMEM16A is approximately threefold greater than that stimulated by increases in cAMP (mediated by CFTR) (6, 8). Additionally, in polarized epithelial monolayers, the short circuit current (Isc) response, a reflection of transepithelial Cl− movement, is approximately fourfold greater in response to ATP added to the apical membrane than to stimuli that increase cAMP (8). Together, these findings suggest that ATP-stimulated Cl− currents mediated by TMEM16A are the predominant Cl− currents in BECs. However, the regulatory pathways responsible for TMEM16A activation are largely unknown.
TMEM16A is a 114-kDa membrane protein with eight putative transmembrane domains and is activated by increases in [Ca2+]i (4, 30, 38). However, the mechanism by which Ca2+ activates the channel is not entirely clear. Previous studies have suggested that Ca2+ interacts with calmodulin at calmodulin-binding domains on the channel protein (18, 32). More recent studies, however, have suggested that Ca2+ binds specific amino acids on the channel protein directly to modulate anion permeability independent of calmodulin (40, 41). The differences in Ca2+ sensitivity between species and different cell types therefore is unexplained but may involve other factors that alter the Ca2+ sensitivity of the channel. Interestingly, TMEM16A contains several putative PKC phosphorylation sites that are near potential sites of Ca2+ binding (20). Furthermore, stimuli that are associated with increases in TMEM16A activity, such as shear force or membrane distention, are also associated with activation or translocation of PKC to the plasma membrane (26, 35, 39). Interestingly, both stimuli (shear, cell swelling) are associated with an increase in BEC ATP release, suggesting a final common pathway in which extracellular ATP, by binding P2 receptors, increases [Ca2+]i, activates PKC, and increases Cl− channel permeability.
PKC is a family of serine/threonine protein kinases classified into three groups on the basis of the arrangement of the regulatory domains. Conventional isoforms (α, β, γ) contain a diaglycerol (DAG) phorbol ester-binding C1 domain and a Ca2+-binding C2 domain. Novel isoforms (δ, ε, θ, η) also contain C1 domains, but their C2 domains are unable to bind Ca2+. Atypical isoforms (ζ, λ) lack C2 domains and have an atypical C1 domain and are regulated independently of Ca2+ or DAG (31). BECs express multiple PKC isoforms, including conventional, novel, and atypical isoforms (25). Among the conventional PKCs, PKCα is the predominant Ca2+- and phorbol-sensitive isoform present in BECs, while βI, βII, and γ are present in trace amounts only (33). Given that specific stimuli that increase both ATP release (with subsequent increases in [Ca2+]i) and Cl− channel activity are associated with PKC translocation from cytosol to plasma membrane (26, 34), we hypothesized that ATP-stimulated TMEM16A activity is mediated by both Ca2+ and the Ca2+-dependent isoform of PKC PKCα.
Therefore, the purpose of these studies was to assess the role of the conventional PKC isoform PKCα as a potential signaling molecule mediating biliary epithelial cell Cl− secretion by linking ATP receptor binding to TMEM16A channel activation.
EXPERIMENTAL PROCEDURES
Cell culture.
Studies were performed in human Mz-Cha-1 cells originally isolated from human cholangiocarcinoma (19). These cells exhibit phenotypic features characteristic of differentiated biliary epithelium (3, 19) and have been utilized as models for purinergic signaling and Ca2+-dependent secretion (6–8, 15, 28, 33). Importantly, they express TMEM16A, P2 receptors, and both Ca2+-dependent and atypical PKC isoforms (6, 19, 25, 36).
TMEM16A expression.
TMEM16A mRNA was detected by quantitative real-time PCR using the ABI Prism 7900HT Sequence Detection System (Applied Biosystems, Life Technologies, Carlsbad, CA). Amplification reactions were performed in a final volume of 10 μl containing cDNA from 10 ng of reverse transcribed total RNA, 150 nM each of forward and reverse primers (forward: CGGAAACAGATGCGACTCAAC and reverse: TGATCCTTGACAGCCTCCTCTT) and SYBR Green PCR Master Mix (Applied Biosystems). TMEM16A protein was detected by Western blotting utilizing goat polyclonal TMEM16A (S-20: sc-69343) or rabbit polyclonal TMEM16A antibody (H-41: sc-135235; Santa Cruz Biotechnology, Santa Cruz, CA). Signals were visualized using enhanced chemiluminescence detection (Pierce Biotechnology, Rockford, IL), specific signals were captured digitally (Chemigenius2 photo-documentation system; Syngene, Cambridge, UK), and band intensity was quantified using standard software (GeneTool; Syngene) or ImageJ (National Institutes of Health).
TMEM16A and PKCα silencing.
TMEM16A expression was inhibited using specific TMEM16A siRNA (TMEM16A-HSS123904). Duplexes of 25-nucleotide of siRNA were designed and synthesized by Invitrogen [AAG UUA GUG AGG UAG GCU GGG AAC C (antisense); GGU UCC CAG CCU ACC UCA CUA ACU U (sense)] and transfected using Fu-gene (5 μg/100 μl) or Lipofectamine RNAi Max (using company protocol). Noncoding StealthTM RNAi (medium GC duplex; Invitrogen) was utilized in control (mock) transfections. Similarly, PKCα expression was inhibited using specific PKCα siRNA (PKCα-s11094). Duplexes of 21-nucleotide of Silencer select siRNA were designed and synthesized by Ambion [GGCUGUACUUCGUCAUGGAtt (sense); UCCAUGACGAAGUAACAGCCga (antisense)]. Silencer select negative control #2 siRNA was used as control. Block-it Fluorescent Oligo (catalog no. 2013) from Invitrogen was used to optimize transfection conditions and for selection of transfected cells for whole cell patch-clamp current recording. Experiments were performed 24–48 h after transfection. Transfection efficiency and degree of TMEM16A and PKCα silencing were evaluated at message level by real-time PCR and at the protein level by Western blot analysis (6, 9).
PKC translocation.
The cytosolic and membrane fractions from Mz-Cha-1 cells were prepared according to the protocol in the Qiagen Qproteomecell compartment kit (Qiagen). Lysates from different fractions were resolved in 4–12% gradient SDS-PAGE and electroblotted on nitrocellulose membranes. Western blot analysis was performed using the mouse monoclonal anti-PKCα antibody (sc-8393; Santa Cruz Biotechnology).
Measurement of Cl− currents.
Membrane currents were measured via whole cell patch-clamp techniques. Cells on a coverslip were mounted in a chamber (volume: ∼400 μl) and whole cell currents were measured with a standard extracellular solution containing the following (in mM): 140 NaCl, 4 KCl, 1 CaCl2, 2 MgCl2, 1 KH2PO4, 10 glucose, and 10 HEPES/NaOH (pH ∼7.40). The standard intracellular (pipette) solution for whole cell recordings contained the following (in mM): 130 KCl, 10 NaCl, 2 MgCl2, 10 HEPES/KOH, 0.5 CaCl2, and 1 EGTA (pH 7.3), corresponding to a free [Ca2+] of ∼100 nM. Free [Ca2+]i was calculated using software kindly provided by Guy Droogmans (Guy.Droogmans@med.KULeuven.ac.be). In the select studies utilizing intracellular dialysis of PKCα, 50 nM phorbol 12-myristate 13-acetate (PMA) and 1 mM MgATP were also included in the patch pipette to serve as cofactors for phosphorylation. During these intracellular dialysis studies, suramin (100 μM) was included in the bath to negate any effects of ATP on membrane P2 receptors. Patch pipettes were pulled from Corning 7052 glass and had a resistance of 2–5 MΩ. Recordings were made with an Axopatch ID amplifier (Axon Instruments, Foster City, CA) and were filtered at 2 kHz and sampled at 4 kHz for storage on a computer and analyzed using pCLAMP version 10 (Axon Instruments, Burlingame, CA) as previously described (6, 22). Two voltage protocols were utilized: 1) holding potential −40 mV, with 100-ms steps to 0 and −80 mV at 10-s intervals (for real-time tracings), and 2) holding potential −40 mV, with 400-ms steps from −100 to +100 mV in 20-mV increments. Current-voltage (I–V) relations were generated from the “step” protocol. Results are compared with control studies measured on the same day to minimize any effects of day-to-day variability and reported as current density (pA/pF) to normalize for differences in cell size (6, 7). Concentration-response data for [Ca2+]i activation of whole cell currents were fitted to the following equation: Y = Vmax × Xn/(Kn + Xn). Where Y is the current density, X is free [Ca2+]i, Vmax is the maximum current density at −80 mV, K is the half maximum concentration of free [Ca2+]i, and n is the Hill coefficient.
Reagents.
Gö6976 was obtained from LC Laboratories (Woburn, MA). All other reagents, including recombinant PKCα and ATP, were obtained from Sigma-Aldrich (St. Louis, MO).
Statistics.
Results are presented as the means ± SE, with n representing the number of culture plates or repetitions for each assay as indicated. Student's paired or unpaired t-test or ANOVA for multiple comparisons was used to assess statistical significance as indicated, and P < 0.01 or 0.05 was considered to be statistically significant.
RESULTS
Pharmacologic inhibition of PKC blocks Ca2+-activated Cl− currents.
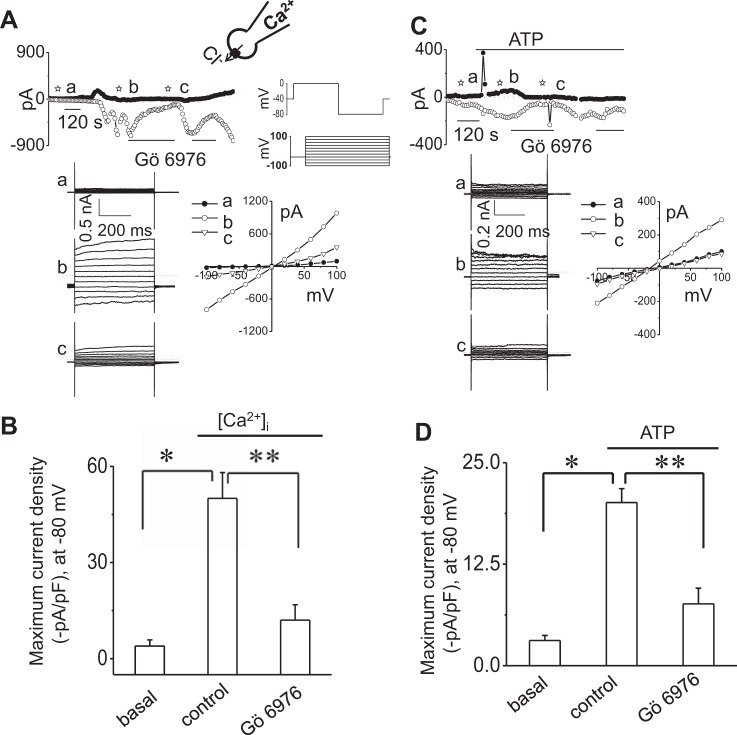
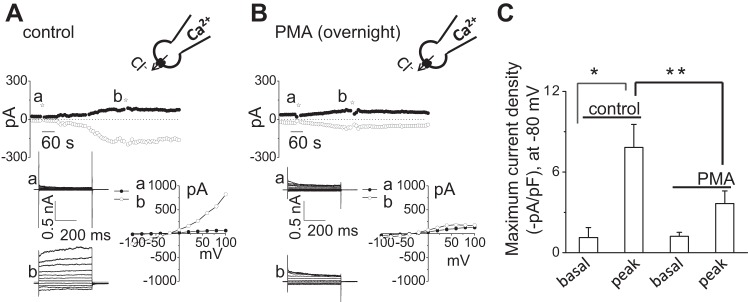
To determine if Ca2+-activated Cl− currents are dependent on PKC, whole cell patch-clamp studies were performed in Mz-Cha-1 cells in the presence or absence of PKC inhibition. Under whole cell patch-clamp conditions, the intracellular Ca2+ concentration was increased directly by addition of 1 μM of free Ca2+ in the patch-pipette. As shown in Fig. 1A, increasing intracellular free Ca2+ from 100 nM to 1 μM resulted in the gradual onset of currents, increasing current density from −4.0 ± 2.0 to −50 ± 8.1 pA/pF (Fig. 1, A and B). Currents demonstrated time-dependent activation at positive potentials (greater than +60 mV), outward rectification, and reversal at 0 mV (ECl− = 0) consistent with the properties of TMEM16A (4, 6, 9, 30, 38). In contrast, addition of the conventional PKC inhibitor Gö6976 to the perfusate abolished the Ca2+-activated Cl− currents. Additionally in separate studies, overnight incubation with PMA, to downregulate conventional and phorbol-sensitive PKC activity, also inhibited Ca2+-activated Cl− currents (Fig. 2).
Fig. 1.
Pharmacologic inhibition of conventional PKC isoforms blocks Ca2+-activated Cl− currents in single cells. A and C: representative whole cell currents recordings. Currents were measured in standard extracellular (bath) and intracellular (pipette) solution and with an increased concentration of free Ca2+, up to 1 μM, in the pipette (A) or in response to addition of ATP (100 μM) to the bath solution (C). Currents measured at −80 mV (○), representing ICl−, and at 0 mV (●), representing IK+, are shown. Horizontal bars below the trace indicate the presence of the conventional PKC inhibitor Gö6976 (10 μM) (A and C). A voltage-step protocol (from holding potential −40 mV, 500-ms steps from −100 to +100 mV in 20-mV increments) was obtained at basal (☆a), maximal inward current response in absence of inhibitor (☆b) and maximal inward current response in presence of inhibitor (☆c) as indicated (A and C). The I–V plots were generated from these protocols and demonstrate the current-voltage relation during basal (●) and intracellular Ca2+ concentration ([Ca2+]i)- or ATP-stimulated conditions (maximal inward currents, due to Cl− movement, in the absence ○ or presence ▽ of Gö6976). B and D: cumulative data demonstrating maximal current density (−pA/pF) in absence or presence of Gö6976, measured at −80 mV in response to [Ca2+]i (B) or in response to ATP (100 μM) (D). Bars represent means ± SE; n = 5–8 for [Ca2+]i, n = 6–13 for ATP. *P < 0.01 vs. basal, **P < 0.01 vs. control.
Fig. 2.
Incubation with phorbol 12-myristate 13-acetate (PMA) inhibits calcium-activated Cl− currents. Representative Ca2+-activated whole cell recordings from single Mz-Cha-1 control cells (A) and after overnight incubation with PMA (1 μM) (B). Currents measured at −80 mV (○), representing ICl−, and at 0 mV (●), representing IK+, are shown. The voltage-step protocol (500-ms steps from −100 to +100 mV in 20-mV increments) was obtained at a☆ and b☆ as indicated and used to generate the I–V relation during initial (●) and maximal-stimulated (○) conditions. C: cumulative data demonstrating maximal current density (−pA/pF) in control conditions and after overnight incubation with PMA (1 μM) measured at −80 mV (n = 6–7). *P < 0.01 vs. basal; **P < 0.05 vs. PMA (1 μM).
We have previously shown in mouse, rat, and human BECs that extracellular ATP increases [Ca2+]i through stimulation of membrane purinergic (P2) receptors and activates Cl− currents (6, 8, 9). To determine if ATP-stimulated Cl− currents are dependent on PKC, whole cell patch-clamp studies were performed in single cells in the presence or absence of PKC inhibition. Under whole cell patch-clamp conditions, exposure of cells to ATP (100 μM) resulted in activation of Cl− currents within 1 min (Fig. 1C). The biophysical properties of ATP-stimulated currents demonstrated time-dependent activation at positive potentials, outward rectification, and a reversal potential at 0 mV (ECl− = 0), properties consistent with TMEM16A channels (4, 6, 9, 30, 38). In contrast, addition of the conventional PKC inhibitor Gö6976 to the perfusate abolished the ATP-stimulated Cl− currents (Fig. 1, C and D). Likewise, overnight incubation with PMA abolished Ca2+-activated Cl− currents (Fig. 2). Collectively, these results demonstrate that the Ca2+- and ATP-stimulated Cl− currents are dependent on conventional, Ca2+-dependent isoforms of PKC. It should be noted that in some trials, ATP caused a transient upward deflection of the current trace consistent with opening of Ca2+-activated K+ channels, which we have previously identified in BECs as mediated in part by SK2 and IK1 (7, 11).
Molecular silencing of PKCα inhibits ATP-stimulated Cl− currents.
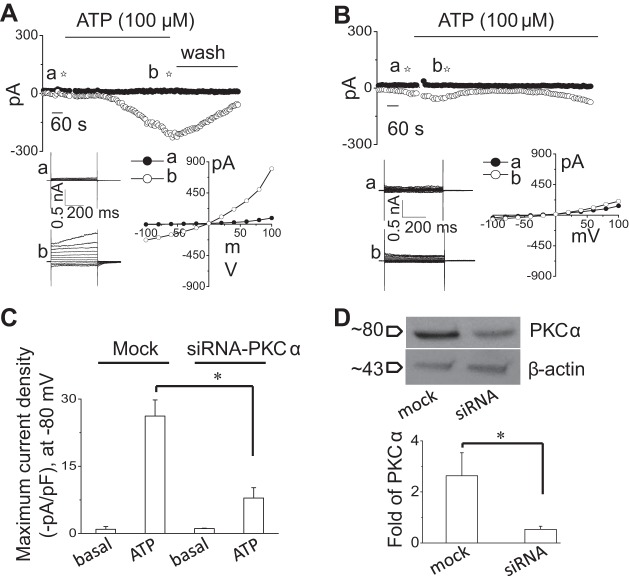
To confirm the specific role of PKCα in ATP-stimulated Cl− channel regulation, we performed whole cell patch-clamp studies in control cells and in cells after molecular silencing of PKCα by siRNA. As shown in Fig. 3, transfection of cells with PKCα siRNA decreased expression of PKCα protein by 66.8 ± 25.6% which was associated with a parallel decrease in the magnitude of whole cell Cl− currents by 74.1 ± 27.1% in response to extracellular ATP (100 μM) compared with cells transfected with nontargeting siRNA (mock; Fig. 3).
Fig. 3.
Molecular silencing of PKCα inhibits ATP-stimulated Cl− currents. Representative whole cell recordings from cells transfected with nontargeting siRNA (mock) (A) or with PKCα siRNA (B) in the presence of ATP (100 μM) in bath solution. The voltage-step protocol (400-ms steps from −100 to +100 mV in 20-mV increments) was obtained at a☆ and b☆ as indicated and used to generate the I–V relation during initial (●) and PKCα-stimulated conditions (○). C: cumulative data demonstrating maximal current density (−pA/pF) measured at −80 mV in presence of ATP in cells transfected with nontargeting siRNA (mock) or cells transfected with PKCα siRNA. Bars represent means ± SE; n = 5. *P < 0.05, peak currents (mock) vs. PKCα siRNA. D: representative Western blot (top) protein levels in cells transfected with nontargeting siRNA (mock) and cells transfected with PKCα siRNA. Cumulative data demonstrate change in PKCα at protein level (n = 5; *P < 0.05 vs. mock).
Exposure to extracellular ATP results in rapid translocation of PKCα to the plasma membrane.
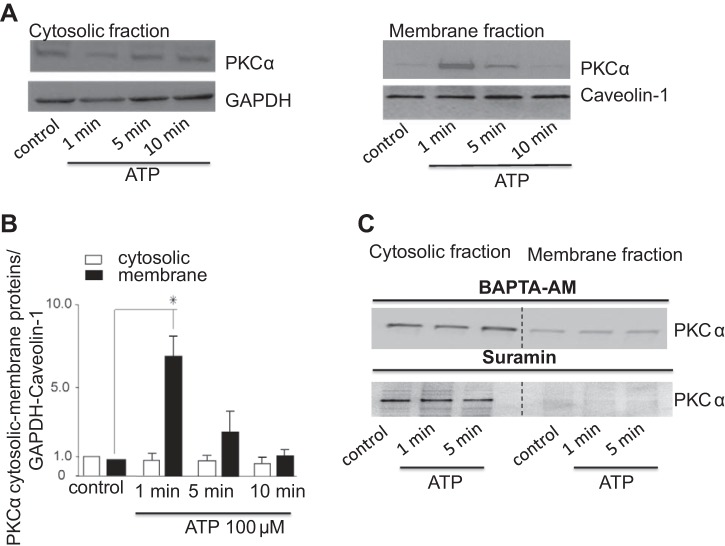
Given the above results, we sought to determine if acute exposure to ATP results in translocation of PKCα from the cytosol to the plasma membrane. Under basal conditions, PKCα was mainly present in cytosol (Fig. 4A). After application of ATP, PKCα translocated to the plasma membrane within 1 min as demonstrated by enrichment of PKCα in the plasma membrane fraction (Fig. 4, A and B). This rapid translocation corresponds to the onset of Cl− currents by exposure to ATP, which occurred within 85.7 ± 12.2 s. The enrichment of the plasma membrane fraction with PKCα was transient and returned to basal expression levels by 10 min.
Fig. 4.
ATP stimulates PKCα translocation to the plasma membrane. Cells were exposed to ATP (100 μM) at indicated time points and harvested for protein or fractionated into membrane and cytosolic portions as described in experimental procedures. The samples were then subjected to 4–12 gradient SDS-PAGE and Western blotting using anti-PKCα polyclonal antibody. A: Western blot of cystosolic (left) and membrane (right) fractions using anti-PKCα antibody. B: quantitative data showing relative PKCα abundance in cytosol and membrane fractions normalized to GAPDH or caveolin-1 levels at indicated time points after ATP addition. Bars represent means ± SE; n = 4. *P < 0.05 vs. control (nontreated cells). C: representative Western blot of n = 3 trials with similar results is shown. Cytosolic and membrane fractions using anti-PKCα antibody are shown on the left and right, respectively. Cells were stimulated with ATP (100 μM) at indicated time points in the presence of the P2 receptor inhibitor suramin or after incubation with the intracellular Ca2+ chelator BAPTA-AM (50 μM for 1-h pretreatment).
As ATP exerts cellular effects through binding P2 receptors and increases in [Ca2+]i, the effects of P2 receptor blockade or Ca2+ chelation on PKCα translocation was evaluated. As expected, in the presence of the P2 receptor antagonist suramin, the ATP-stimulated translocation of PKCα from the cytosol to the plasma membrane was not observed (Fig. 4C). In a similar manner, chelation of intracellular Ca2+ with BAPTA-AM decreased the membrane fraction of PKCα (Fig. 4C). Together, these results demonstrate that there is rapid and dynamic trafficking of PKCα to the plasma membrane in response to acute exposure to extracellular ATP that is dependent on intracellular Ca2+ and within a time frame that parallels activation of Cl− currents, suggesting a potential direct effect by PKCα on plasma membrane Cl− channels.
Intracellular dialysis with recombinant PKCα activates Cl− currents.
To directly assess the role of PKCα in membrane Cl− channel activation, recombinant human PKCα was delivered to the cell interior by inclusion in the patch pipette during whole cell recording conditions. Whole cell currents remained small in control cells (Fig. 5). In contrast, spontaneous activation of currents was observed with intracellular dialysis with PKCα (60 ng/ml). The PKCα-stimulated currents exhibited characteristics of the Ca2+-activated Cl− currents with reversal at 0 mV (ECl−), outward rectification, and time-dependent activation at depolarizing potentials above +60 mV. Moreover, the currents activated by intracellular dialysis with PKCα were significantly inhibited by Gö6976. To provide evidence that the activation of Cl− currents by recombinant PKCα is “downstream” of ATP binding P2 receptors, i.e., linking P2 receptor stimulation with channel activation and not due to indirect effects on ATP release, whole cell currents were measured in response to intracellular dialysis with PKCα in the presence or absence of the P2 receptor antagonist suramin. If PKC-activated currents were due to indirect effects of PKC on ATP release, and subsequent binding to P2R, inclusion of the P2R inhibitor suramin would be expected to abolish the currents in response to intracellular dialysis with PKCα. As shown in Fig. 6, in the presence of suramin, intracellular delivery of PKCα activated Cl− currents similar to control conditions (without suramin). This finding indicates that PKCα activates Cl− currents through direct effects on channel opening and not through indirect effects on ATP release. Together, the results are consistent with a model in which PKCα is downstream of ATP-P2 receptor binding and couples P2 receptor activation to opening of Ca2+-activated Cl− channels.
Fig. 5.
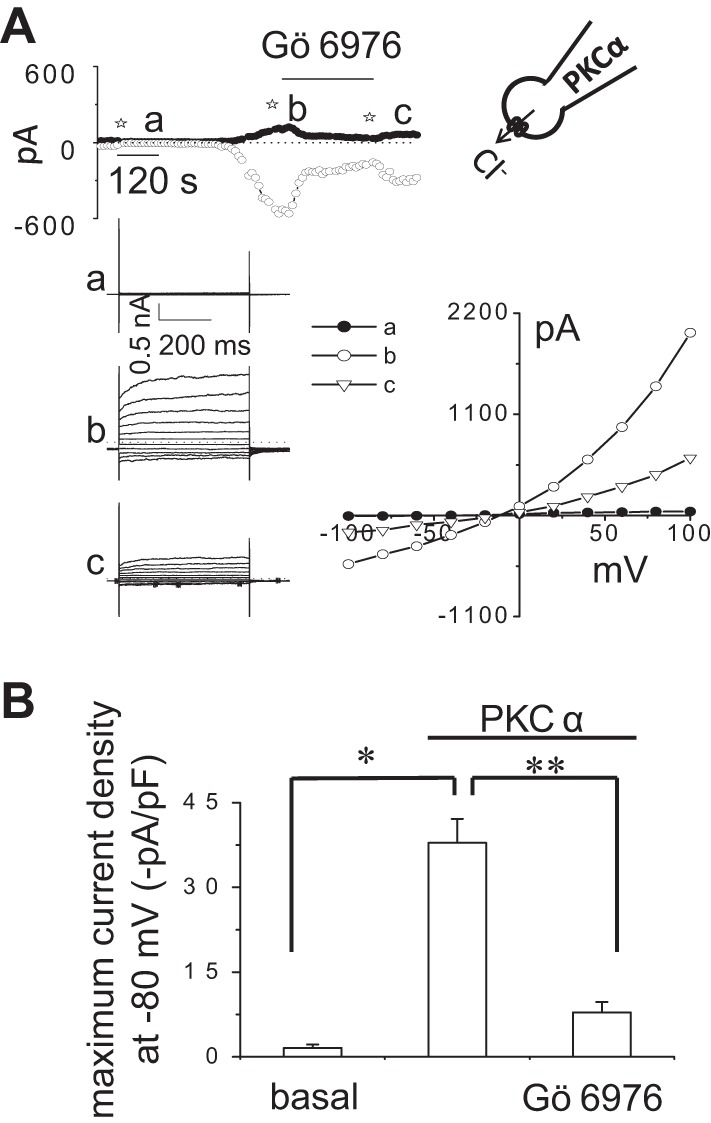
Intracellular dialysis with recombinant PKCα activates Cl− currents. Representative whole cell currents recorded during intracellular dialysis with PKCα (60 ng/ml) by inclusion in the patch-pipette (A). In these select studies, 50 nM PMA and 1 mM MgATP were also included in the patch pipette to serve as cofactors for phosphorylation. Currents measured at −80 mV (○), representing ICl−, and at 0 mV (●), representing IK+, are shown. Horizontal bar above the trace indicates application of the PKC inhibitor Gö6976 (10 μM) in the bath solution. The voltage-step protocol (400 ms steps from −100 to +100 mV in 20-mV increments) was obtained at ☆a, ☆b, and ☆c as indicated and used to generate the I–V relation, representing initial (basal) (●) and maximal PKCα-stimulated currents during control conditions (○) and in the presence of Gö6976 (▽). Cumulative data show the magnitude of PKCα-stimulated currents, reported as current density (−pA/pF) in presence or absence of Gö6976 (10 μM) measured at −80 mV (B) (n = 5). *P < 0.01 vs. basal. **P < 0.01, PKCα-stimulated currents are significantly inhibited by Gö6976 and PKCα significantly increases whole cell currents.
Fig. 6.
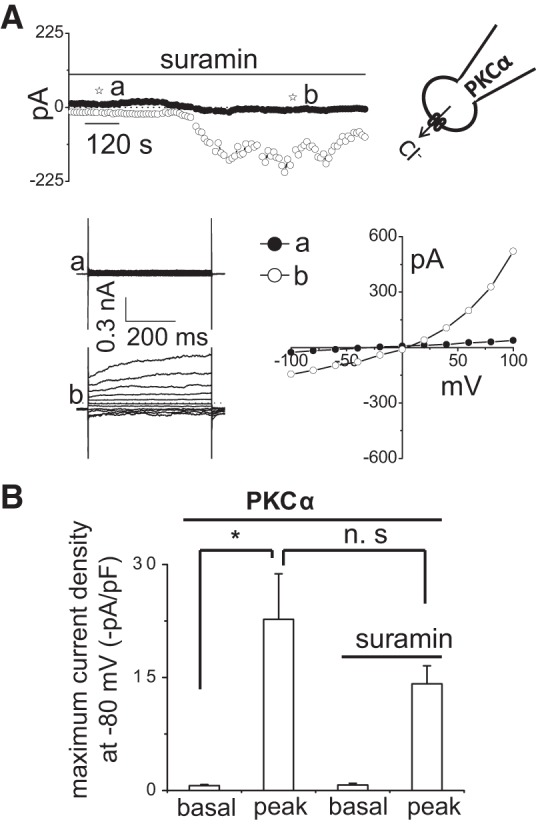
Intracellular dialysis with PKCα directly activates Cl− currents independent of ATP release and P2 receptor stimulation. Representative whole cell currents recorded in response to intracellular dialysis with PKCα (60 ng/ml), 50 nM PMA, and 1 mM MgATP in patch-pipette (A). Currents measured at −80 mV (○), representing ICl−, and at 0 mV (●), representing IK+, are shown. Horizontal bar above the trace indicates presence of suramin (100 μM) in bath solution. The voltage-step protocol (400-ms steps from −100 to +100 mV in 20-mV increments) was obtained at ☆a and ☆b as indicated and used to generate the I–V relation during initial (●) and PKCα-stimulated conditions in presence of suramin (○). B: cumulative data demonstrating the peak current density (−pA/pF) in response to intracellular dialysis with PKCα in the presence or absence of suramin (100 μM) measured at −80 mV; n = 4–5 each, n.s. = not significant. *P < 0.01 vs. basal.
Synergism of Ca2+ and PKCα in the activation of Cl− currents.
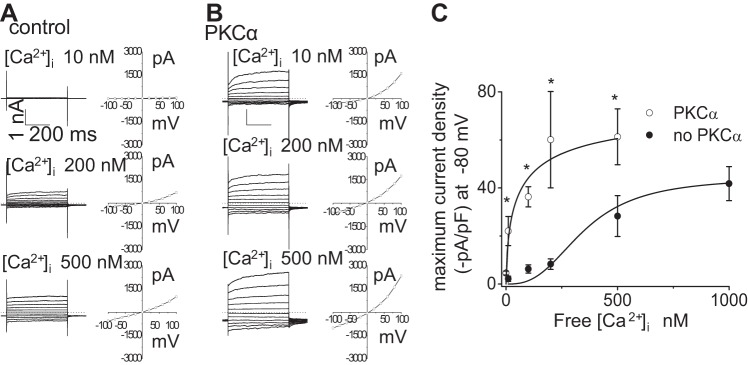
As shown in Fig. 1, activation of Ca2+-activated Cl− currents, either by exposure to ATP or direct increases in [Ca2+]i, is dependent on the activity of Ca2+-dependent, conventional isoforms of PKC. Thus both Ca2+ and PKCα appear necessary for channel activation. To determine potential cooperativity, or synergism, between Ca2+ and PKCα in the regulation of Cl− currents, whole cell Cl− currents were recorded in cells dialyzed with recombinant PKCα in the presence of different concentrations of Ca2+ in the intracellular buffer. As shown in Fig. 7, current density increased as the concentration of free Ca2+ in the patch pipette increased. In control cells, increasing [Ca2+]i resulted in an increase in the magnitude of currents with maximum current activation observed at 1 μM. When PKCα was dialyzed into the cell interior, the magnitude of the Ca2+-activated currents increased at every concentration of Ca2+ with maximum current activation observed at 500 nM. As shown in Fig. 7, the activation curve was shifted to the left. The half-maximal effective concentration (EC50) of Ca2+ required for channel activation was 349.4 ± 9.5 nM in control cells; however, in the presence of PKCα the EC50 of Ca2+ for maximal channel activation was lowered to 62.8 ± 3.9 nM (Fig. 7). Thus PKCα appears to work in a cooperative manner to lower the [Ca2+]i threshold necessary for maximal current activation; conversely, Ca2+ may directly increase activation of the added PKCα resulting in an increase in channel open probability.
Fig. 7.
PKCα-stimulated currents are dependent on intracellular [Ca2+]. Representative whole cell currents (utilizing voltage-step protocol, see experimental procedures) recorded in response to increasing [Ca2+]i in pipette solution (10, 200, and 500 nM; shown at left) and corresponding I–V relation (plotted at right) in the absence (A) or in the presence (B) of PKCα (60 ng/ml) in dialyzing pipette. C: [Ca2+]i dose-response curve for Cl− currents. Data were plotted from maximum current density (pA/pF) measured at −80 mV in response to different intracellular (pipette) Ca2+ concentrations in absence (●) or in presence (○) of PKCα (60 ng/ml) in dialyzing pipette. Each point represents means ± SE; n = 4–5 with PKCα, and n = 3–11 without PKCα; fit to the Hill equation (see experimental procedures); n = 4–5 each. *P < 0.05 vs. absence of PKCα.
PKCα-activated currents are mediated by TMEM16A.
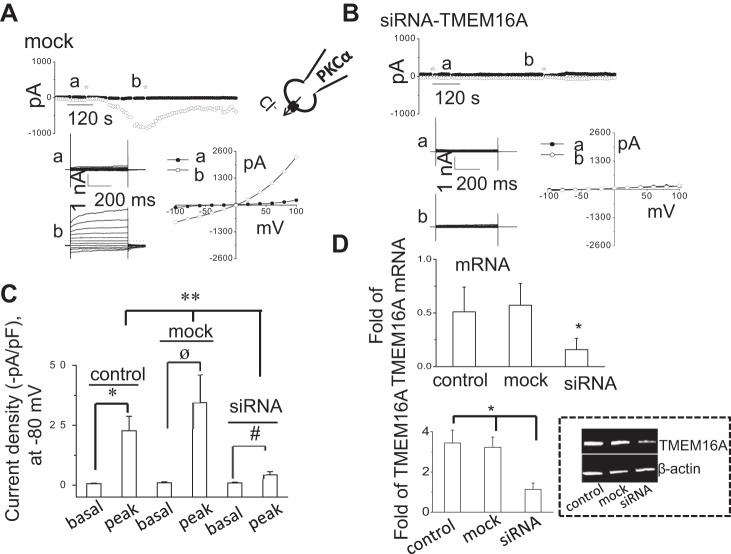
We have recently shown that Ca2+-activated Cl− currents are mediated by TMEM16A channels in mouse, rat, and human biliary epithelium, including Mz-Cha-1 cells (6, 9). In biliary epithelium, TMEM16A is located predominantly in the apical membrane and is activated in response to exposure to extracellular ATP (6). To confirm that the Cl− currents observed with intracellular dialysis of PKCα are mediated by TMEM16A, cells were transfected with either TMEM16A siRNA or a nontargeting siRNA for 24–48 h. Transfection of cells with TMEM16A siRNA significantly decreased expression of TMEM16A mRNA and protein as previously observed (6, 9) (Fig. 8) and significantly inhibited Cl− currents in response to intracellular dialysis with PKCα compared with cells transfected with nontargeting siRNA or nontransfected cells (Fig. 8). Together, these data demonstrate that TMEM16A channels contribute to the PKCα-activated Cl− currents in human biliary cells.
Fig. 8.
PKCα-stimulated Cl− currents are mediated through TMEM16A. Representative whole cell recordings from cells transfected with nontargeting siRNA (mock) (A) or with TMEM16A siRNA (B) in presence of PKCα (60 ng/ml) in dialyzing pipette. The voltage-step protocol (400-ms steps from −100 to +100 mV in 20-mV increments) was obtained at a☆ and b☆ as indicated and used to generate the I–V relation during initial (●) and PKCα-stimulated conditions (○). C: cumulative data demonstrating maximal current density (−pA/pF) measured at −80 mV in the presence of PKCα in nontransfected (control) cells, cells transfected with nontargeting siRNA (mock), or cells transfected with TMEM16A siRNA. Bars represent means ± SE; n = 5–6. *P < 0.01, peak currents (control) vs. basal currents. øP < 0.01, peak currents (mock) vs. basal currents. #P < 0.05, peak currents (siRNA) vs. basal currents. **P < 0.01, peak currents with TMEM16A siRNA vs. control or mock transfected. D: cumulative data demonstrating change in TMEM16A, mRNA (top) and representative Western blot (bottom) protein levels in control cells, cells transfected with nontargeting siRNA (mock), and cells transfected with anti-TMEM16A siRNA. *P < 0.05 vs. control or mock levels; n = 6 each.
DISCUSSION
Purinergic (P2) signaling along the apical membrane of duct cells has emerged as an important pathway contributing to liver bile formation (12). Released into bile by both hepatocytes and cholangiocytes (15, 16), ATP binds P2 receptors on the apical membrane of cholangiocytes resulting in increases in [Ca2+]i and Ca2+-activated Cl− channel activity (6, 15, 16, 27). The increase in luminal Cl− concentration drives Cl−/HCO3− exchange through AE2 (2) and water efflux through aquaporin 4 (23). The end result is an increase in the alkalinization and dilution of ductular bile. The P2 signaling pathway also represents a novel form of regulation in which ATP and nucleotides in bile directly regulate ductular transport through interactions with receptors on the apical membrane. The recent identification of TMEM16A as the downstream Cl− channel activated in response to apical receptor binding by ATP (6) suggests that this channel may represent a therapeutic target to promote Cl− efflux and HCO3− transport to promote bile flow in the treatment of cholestatic disorders.
In the current studies, utilizing a human biliary cell model, we have demonstrated that the conventional and Ca2+-dependent PKC isoform PKCα regulates ATP-stimulated TMEM16A channel activity. This is based on our findings that 1) the ATP-stimulated Cl− currents are abolished by GÖ6976, a specific inhibitor of conventional PKC isoforms; 2) ATP binding results in rapid translocation of PKCα from the cytosol to the plasma membrane; 3) intracellular dialysis with recombinant PKCα activates Cl− currents with identical biophysical properties to TMEM16A; 4) PKCα facilitates the activation of currents by [Ca2+]i in a synergistic manner; and 5) transfection of cells with TMEM16A siRNA significantly decreased TMEM16A protein expression and was associated with a significant decrease in the magnitude of Cl− currents in response to intracellular dialysis with recombinant PKCα. Together, these results demonstrate that PKCα is a critical signal linking P2 receptor stimulation to TMEM16A channel activation. Based on these findings and our previous work, we propose a model in which binding of P2 receptors by ATP results in release of Ca2+ from intracellular stores (8), rapid translocation of PKCα to plasma membrane targets, and a decrease in the EC50 of Ca2+ required for TMEM16A channel activation.
It should be noted that if these studies in a model biliary cell line apply to in vivo conditions, several questions and considerations remain. First, the specific site of PKCα action on TMEM16A is not defined. While PKCα has been associated with ATP release in other cell types, including hepatocytes and cholangiocytes (14, 29), the current studies do not support a role in ATP release and channel activation but rather a “downstream” cellular pathway linking P2 receptor activation to channel activity. Potentially, this could occur through a direct effect on the channel through phosphorylation or through activation of other regulatory molecules necessary for channel opening. TMEM16A is a protein of ∼960 amino acids and contains several potential PKC phosphorylation sites (4, 20). In fact, in other cell models PKC has been shown to directly modulate channel function (1, 24). Thus the possibility of direct TMEM16A channel phosphorylation by PKCα in BECs is a likely regulatory event, although it requires further study. Conversely, it is possible that PKCα interacts with other kinases or regulatory molecules in a signaling cascade that modulates TMEM16A function. For instance, CaMKII, a regulator of Ca2+-activated Cl− channels in other cell types, has been observed to interact with PKC (37). However, recent studies suggest that TMEM16A is not regulated by CaMKII or calmodulin but rather interacts with Ca2+ directly through specific amino acids in the channel protein (40, 41). This is consistent with our findings demonstrating a synergistic and additive effect of Ca2+ and PKCα on channel activation independent of calmodulin or CaMKII. Essentially, PKCα lowers the EC50 of [Ca2+]i required for full channel activation. Lastly, the possibility that PKC plays a role in vesicular trafficking and regulates the recruitment of TMEM16A containing vesicles to the plasma membrane in response to ATP cannot be excluded. In fact, PKC has been shown to directly modulate the membrane dwell time of other channel proteins including TRP Ca2+ channels (24).
Second, the mechanism that regulates the translocation of PKC to the membrane in response to ATP in BECs is unknown. Presumably, store-operated Ca2+ release, as a result of ATP binding the G-protein-linked P2Y receptor with IP3 generation, precedes the translocation event (8). In other models, the translocation of PKCα is a result of Ca2+ interaction with the C2 domain leading to a structural change and binding to plasma membrane targets (21). Once PKC is located at plasma membrane sites, further Ca2+ binding increases the dwell time of PKCα in the membrane and may potentially lead to regulation of other Ca2+-dependent processes, such as channel activation (24). Furthermore, the potential structural basis for the Ca2+ and PKC synergy on channel activation observed in our studies is unknown. Presumably, this may occur through changes in the folding of the structural domain or conformational changes of PKCα and/or the channel protein in response to Ca2+.
Third, our studies demonstrate that TMEM16A is a target of ATP-stimulated PKCα activity; however, it may not be the sole target and ATP-stimulated PKCα activity may regulate other membrane channel proteins. In fact, in the majority of studies in which delivery of recombinant PKCα to the cell interior resulted in Cl− currents, the Ca2+-activated Cl− currents were preceded by Ca2+-activated K+ currents. The molecular identification of these PKCα-stimulated K+ channels is unknown; however, two Ca2+-activated K+ channels have previously been identified in biliary cells including the small and intermediate conductance Ca2+-activated K+ channels SK2 (11) and IK1 (7). In secretory epithelium it is felt that activation of K+ channels leads to membrane hyperpolarization to maintain the electrical driving force for continued Cl− efflux (5). Thus PKC may represent a central regulator by integrating different stimuli into coordinated secretory responses through effects on distinct channel proteins, including Cl− and K+ channels.
Lastly, while PKCα is the predominant isoform linking P2 receptors to TMEM16A activation, other PKC isoforms may be involved in other steps in the purinergic-signaling pathway in which separate isoforms may respond to different stimuli. For example, we have previously shown that while ATP release in response to cell swelling, which involves exocytosis of ATP-containing vesicles (14, 29), is dependent on conventional PKC isoforms, fluid-flow- or shear-stress-induced ATP release is dependent on the atypical isoform PKCζ (35). Thus distinct PKC isoforms exist in BECs and their activity changes in response to different stimuli to coordinate a regulated physiologic response. Of course other volume-sensitive pathways exist in liver cells as well, including tyrosine kinase and MAP kinase pathways (10, 13). This paradigm, with distinct mechanical stimuli, multiple kinase signaling pathways, and various effector pathways, represents a means to coordinate and integrate various cellular signals with fidelity and specificity and a way to fine-tune membrane transport over a broad range of stimuli. The mechanism by which different mechanical stimuli activate specific and distinct kinase signaling cascades, the potential interaction between PKC isoforms and other protein kinases, and the target effector channels will require further study.
In summary, our studies demonstrate that PKCα is coupled to ATP-stimulated TMEM16A activation in BECs. This ATP-Ca2+-PKCα signaling pathway is an important regulator of BEC Cl− secretion and therefore may represent a potential target to promote bile formation.
GRANTS
This study was supported by National Institute of Allergy and Infectious Diseases Grant R21-AI-094427 (to A. Fujita); an American Liver Foundation Liver Scholar Award (to A. K. Dutta); and the Children's Medical Center Foundation, the Cystic Fibrosis Foundation, and National Institute of Diabetes and Digestive and Kidney Diseases Grant R01-DK-078587 (to A. P. Feranchak).
DISCLOSURES
No conflicts of interest, financial or otherwise, are declared by the author(s).
AUTHOR CONTRIBUTIONS
Author contributions: A.K.D. and A.P.F. conception and design of research; A.K.D., A.-K.K., S.L., Z.K., A.F., and C.K. performed experiments; A.K.D., A.-K.K., Z.K., and A.F. analyzed data; A.K.D. and A.-K.K. interpreted results of experiments; A.K.D. and A.-K.K. prepared figures; A.K.D., A.-K.K., and A.P.F. drafted manuscript; A.K.D., D.C.R., and A.P.F. edited and revised manuscript; A.K.D., S.L., Z.K., A.F., C.K., D.C.R., and A.P.F. approved final version of manuscript.
ACKNOWLEDGMENTS
We thank Dr. Philip Thomas and Dr. Jennifer Kohler, University of Texas Southwestern.
REFERENCES
- 1.Adapala RK, Talasila PK, Bratz IN, Zhang DX, Suzuki M, Meszaros JG, Thodeti CK. PKCα mediates acetylcholine-induced activation of TRPV4-dependent calcium influx in endothelial cells. Am J Physiol Heart Circ Physiol 301: H757–H765, 2011. [DOI] [PMC free article] [PubMed] [Google Scholar]
- 2.Banales JM, Arenas F, Rodriguez-Ortigosa CM, Saez E, Uriarte I, Doctor RB, Prieto J, Medina JF. Bicarbonate-rich choleresis induced by secretin in normal rat is taurocholate-dependent and involves AE2 anion exchanger. Hepatology 43: 266–275, 2006. [DOI] [PubMed] [Google Scholar]
- 3.Basavappa S, Middleton JP, Mangel A, McGill J, Cohn JA, Fitz JG. Cl− and K+ transport in human biliary cell lines. Gastroenterology 104: 1796–1805, 1993. [DOI] [PubMed] [Google Scholar]
- 4.Caputo A, Caci E, Ferrera L, Pedemonte N, Barsanti C, Sondo E, Pfeffer U, Ravazzolo R, Zegarra-Moran O, Galietta LJ. TMEM16A, a membrane protein associated with calcium-dependent chloride channel activity. Science 322: 590–594, 2008. [DOI] [PubMed] [Google Scholar]
- 5.Devor DC, Singh AK, Frizzell RA, Bridges RJ. Modulation of Cl− secretion by benzimidazolones. I. Direct activation of a Ca2+-dependent K+ channel. Am J Physiol Lung Cell Mol Physiol 271: L775–L784, 1996. [DOI] [PubMed] [Google Scholar]
- 6.Dutta AK, Khimji AK, Kresge C, Bugde A, Dougherty M, Esser V, Ueno Y, Glaser SS, Alpini G, Rockey DC, Feranchak AP. Identification and functional characterization of TMEM16A, a Ca2+-activated Cl− channel activated by extracellular nucleotides, in biliary epithelium. J Biol Chem 286: 766–776, 2011. [DOI] [PMC free article] [PubMed] [Google Scholar]
- 7.Dutta AK, Khimji AK, Sathe M, Kresge C, Parameswara V, Esser V, Rockey DC, Feranchak AP. Identification and functional characterization of the intermediate-conductance Ca2+-activated K+ channel (IK-1) in biliary epithelium. Am J Physiol Gastrointest Liver Physiol 297: G1009–G1018, 2009. [DOI] [PMC free article] [PubMed] [Google Scholar]
- 8.Dutta AK, Woo K, Doctor RB, Fitz JG, Feranchak AP. Extracellular nucleotides stimulate Cl− currents in biliary epithelia through receptor-mediated IP3 and Ca2+ release. Am J Physiol Gastrointest Liver Physiol 295: G1004–G1015, 2008. [DOI] [PMC free article] [PubMed] [Google Scholar]
- 9.Dutta AK, Woo K, Khimji AK, Kresge C, Feranchak AP. Mechanosensitive Cl− secretion in biliary epithelium mediated through TMEM16A. Am J Physiol Gastrointest Liver Physiol 304: G87–G98, 2013. [DOI] [PMC free article] [PubMed] [Google Scholar]
- 10.Feranchak AP, Berl T, Capasso J, Wojtaszek PA, Han J, Fitz JG. p38 MAP kinase modulates liver cell volume through inhibition of membrane Na+ permeability. J Clin Invest 108: 1495–1504, 2001. [DOI] [PMC free article] [PubMed] [Google Scholar]
- 11.Feranchak AP, Doctor RB, Troetsch M, Brookman K, Johnson SM, Fitz JG. Calcium-dependent regulation of secretion in biliary epithelial cells: the role of apamin-sensitive SK channels. Gastroenterology 127: 903–913, 2004. [DOI] [PubMed] [Google Scholar]
- 12.Feranchak AP, Fitz JG. Adenosine triphosphate release and purinergic regulation of cholangiocyte transport. Semin Liver Dis 22: 251–262, 2002. [DOI] [PubMed] [Google Scholar]
- 13.Feranchak AP, Kilic G, Wojtaszek PA, Qadri I, Fitz JG. Volume-sensitive tyrosine kinases regulate liver cell volume through effects on vesicular trafficking and membrane Na+ permeability. J Biol Chem 278: 44632–44638, 2003. [DOI] [PubMed] [Google Scholar]
- 14.Feranchak AP, Lewis MA, Kresge C, Sathe M, Bugde A, Luby-Phelps K, Antich PP, Fitz JG. Initiation of purinergic signaling by exocytosis of ATP-containing vesicles in liver epithelium. J Biol Chem 285: 8138–8147, 2010. [DOI] [PMC free article] [PubMed] [Google Scholar]
- 15.Feranchak AP, Roman RM, Doctor RB, Salter KD, Toker A, Fitz JG. The lipid products of phosphoinositide 3-kinase contribute to regulation of cholangiocyte ATP and chloride transport. J Biol Chem 274: 30979–30986, 1999. [DOI] [PubMed] [Google Scholar]
- 16.Feranchak AP, Roman RM, Schwiebert EM, Fitz JG. Phosphatidyl inositol 3-kinase represents a novel signal regulating cell volume through effects on ATP release. J Biol Chem 273: 14906–14911, 1998. [DOI] [PubMed] [Google Scholar]
- 17.Fitz JG, Basavappa S, McGill J, Melhus O, Cohn JA. Regulation of membrane chloride currents in rat bile duct epithelial cells. J Clin Invest 91: 319–328, 1993. [DOI] [PMC free article] [PubMed] [Google Scholar]
- 18.Jung J, Nam JH, Park HW, Oh U, Yoon JH, Lee MG. Dynamic modulation of ANO1/TMEM16A HCO3− permeability by Ca2+/calmodulin. Proc Natl Acad Sci USA 110: 360–365, 2013. [DOI] [PMC free article] [PubMed] [Google Scholar]
- 19.Knuth A, Gabbert H, Dippold W, Klein O, Sachsse W, Bitter-Suermann D, Prellwitz W, Meyer zum Buschenfelde KH. Biliary adenocarcinoma characterization of three new human tumor cell lines. J Heptatol 1: 579–596, 1985. [DOI] [PubMed] [Google Scholar]
- 20.Kunzelmann K, Kongsuphol P, Aldehni F, Tian Y, Ousingsawat J, Warth R, Schreiber R. Bestrophin and TMEM16-Ca(2+) activated Cl(-) channels with different functions. Cell Calcium 46: 233–241, 2009. [DOI] [PubMed] [Google Scholar]
- 21.Lai CL, Landgraf KE, Voth GA, Falke JJ. Membrane docking geometry and target lipid stoichiometry of membrane-bound PKCalpha C2 domain: a combined molecular dynamics and experimental study. J Mol Biol 402: 301–310, 2010. [DOI] [PMC free article] [PubMed] [Google Scholar]
- 22.Lidofsky SD, Xie MH, Sostman A, Scharschmidt BF, Fitz JG. Vasopressin increases cytosolic sodium concentration in hepatocytes and activates calcium influx through cation-selective channels. J Biol Chem 268: 14632–14636, 1993. [PubMed] [Google Scholar]
- 23.Marinelli RA, Pham LD, Tietz PS, LaRusso NF. Expression of aquaporin-4 water channels in rat cholangiocytes. Hepatology 31: 1313–1317, 2000. [DOI] [PubMed] [Google Scholar]
- 24.Peng H, Lewandrowski U, Muller B, Sickmann A, Walz G, Wegierski T. Identification of a protein kinase C-dependent phosphorylation site involved in sensitization of TRPV4 channel. Biochem Biophys Res Commun 391: 1721–1725, 2010. [DOI] [PubMed] [Google Scholar]
- 25.Perletti GP. Partial purification of protein kinase C isoenzymes from rat liver. J Biochem Biophys Methods 28: 195–204, 1994. [DOI] [PubMed] [Google Scholar]
- 26.Roman RM, Bodily K, Wang Y, Raymond JR, Fitz JG. Activation of protein kinase C alpha couples cell volume to membrane Cl− permeability in HTC hepatoma and Mz-ChA-1 cholangiocarcinoma cells. Hepatology 28: 1073–1080, 1998. [DOI] [PubMed] [Google Scholar]
- 27.Roman RM, Fitz JG. Emerging roles of purinergic signaling in gastrointestinal epithelial secretion and hepatobiliary function. Gastroenterology 116: 964–979, 1999. [DOI] [PubMed] [Google Scholar]
- 28.Roman RM, Wang Y, Fitz JG. Regulation of cell volume in a human biliary cell line: calcium-dependent activation of K+ and Cl− currents. Am J Physiol Gastrointest Liver Physiol 271: G239–G248, 1996. [DOI] [PubMed] [Google Scholar]
- 29.Sathe MN, Woo K, Kresge C, Bugde A, Luby-Phelps K, Lewis MA, Feranchak AP. Regulation of purinergic signaling in biliary epithelial cells by exocytosis of SLC17A9-dependent ATP-enriched vesicles. J Biol Chem 286: 25363–25376, 2011. [DOI] [PMC free article] [PubMed] [Google Scholar]
- 30.Schroeder BC, Cheng T, Jan YN, Jan LY. Expression cloning of TMEM16A as a calcium-activated chloride channel subunit. Cell 134: 1019–1029, 2008. [DOI] [PMC free article] [PubMed] [Google Scholar]
- 31.Steinberg SF. Structural basis of protein kinase C isoform function. Physiol Rev 88: 1341–1378, 2008. [DOI] [PMC free article] [PubMed] [Google Scholar]
- 32.Tian Y, Kongsuphol P, Hug M, Ousingsawat J, Witzgall R, Schreiber R, Kunzelmann K. Calmodulin-dependent activation of the epithelial calcium-dependent chloride channel TMEM16A. FASEB J 25: 1058–1068, 2011. [DOI] [PubMed] [Google Scholar]
- 33.Wang Y, Roman RM, Schlenker T, Hannun YA, Raymond JR, Fitz JG. Cytosolic calcium and protein kinase C(alpha) couple cellular metabolism to membrane K+ permeability in a human biliary cell line. J Clin Invest 99: 2890–2897, 1997. [DOI] [PMC free article] [PubMed] [Google Scholar]
- 34.Wang Y, Sostman A, Roman RM, Stribling S, Vigna S, Hannun YA, Raymond JR, Fitz JG. Metabolic stress opens K+ channels in hepatoma cells through a calcium- and protein kinase C alpha-dependent mechanism. J Biol Chem 271: 18107–18113, 1996. [DOI] [PubMed] [Google Scholar]
- 35.Woo K, Dutta AK, Patel V, Kresge C, Feranchak AP. Fluid flow induces mechanosensitive ATP release, calcium signaling and Cl− transport in biliary epithelial cells through a PKCzeta-dependent pathway. J Physiol 586: 2779–2798, 2008. [DOI] [PMC free article] [PubMed] [Google Scholar]
- 36.Woo K, Sathe M, Kresge C, Esser V, Ueno Y, Venter J, Glaser SS, Alpini G, Feranchak AP. Adenosine triphosphate release and purinergic (P2) receptor-mediated secretion in small and large mouse cholangiocytes. Hepatology 52: 1819–1828, 2010. [DOI] [PMC free article] [PubMed] [Google Scholar]
- 37.Yan JZ, Xu Z, Ren SQ, Hu B, Yao W, Wang SH, Liu SY, Lu W. Protein kinase C promotes N-methyl-d-aspartate (NMDA) receptor trafficking by indirectly triggering calcium/calmodulin-dependent protein kinase II (CaMKII) autophosphorylation. J Biol Chem 286: 25187–25200, 2011. [DOI] [PMC free article] [PubMed] [Google Scholar]
- 38.Yang YD, Cho H, Koo JY, Tak MH, Cho Y, Shim WS, Park SP, Lee J, Lee B, Kim BM, Raouf R, Shin YK, Oh U. TMEM16A confers receptor-activated calcium-dependent chloride conductance. Nature 455: 1210–1215, 2008. [DOI] [PubMed] [Google Scholar]
- 39.Yeh CC, Chang HI, Chiang JK, Tsai WT, Chen LM, Wu CP, Chien S, Chen CN. Regulation of plasminogen activator inhibitor 1 expression in human osteoarthritic chondrocytes by fluid shear stress: role of protein kinase Calpha. Arthritis Rheum 60: 2350–2361, 2009. [DOI] [PubMed] [Google Scholar]
- 40.Yu K, Zhu J, Qu Z, Cui YY, Hartzell HC. Activation of the Ano1 (TMEM16A) chloride channel by calcium is not mediated by calmodulin. J Gen Physiol 143: 253–267, 2014. [DOI] [PMC free article] [PubMed] [Google Scholar]
- 41.Yu Y, Kuan AS, Chen TY. Calcium-calmodulin does not alter the anion permeability of the mouse TMEM16A calcium-activated chloride channel. J Gen Physiol 144: 115–124, 2014. [DOI] [PMC free article] [PubMed] [Google Scholar]


